
Key Insights
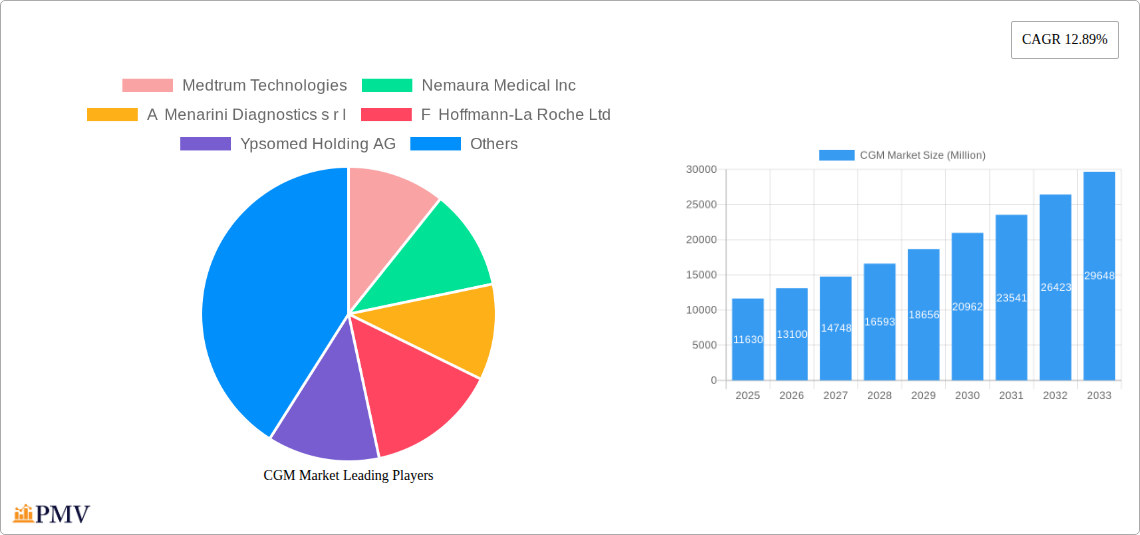
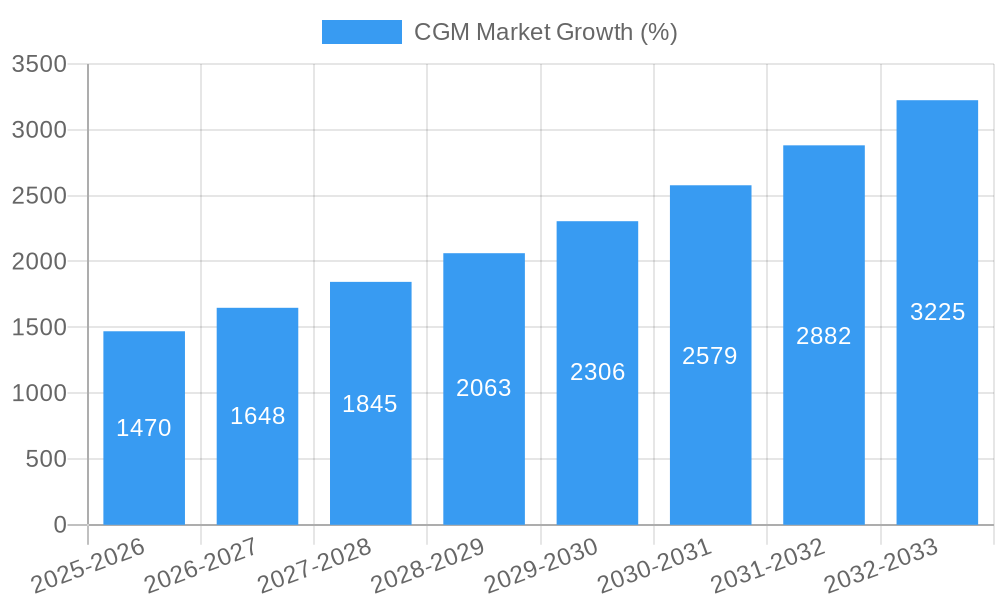
The Continuous Glucose Monitoring (CGM) market is experiencing robust growth, projected to reach \$11.63 billion in 2025 and maintain a Compound Annual Growth Rate (CAGR) of 12.89% from 2025 to 2033. This expansion is driven by several key factors. Rising prevalence of diabetes, particularly type 1 and type 2, fuels the demand for advanced glucose monitoring solutions offering improved accuracy and convenience compared to traditional methods. Technological advancements, such as the development of smaller, more accurate sensors and user-friendly mobile applications, are also contributing significantly. Furthermore, increasing patient awareness regarding the benefits of CGM in managing diabetes complications and improving overall health outcomes is driving market adoption. The shift towards personalized medicine and remote patient monitoring further strengthens the market outlook. Hospitals and clinics represent a significant portion of the end-user segment, followed by the growing home-use market driven by patient preference for self-management and improved quality of life. Competitive forces are strong, with major players like Medtronic, Abbott, and Dexcom vying for market share through innovation and strategic partnerships.
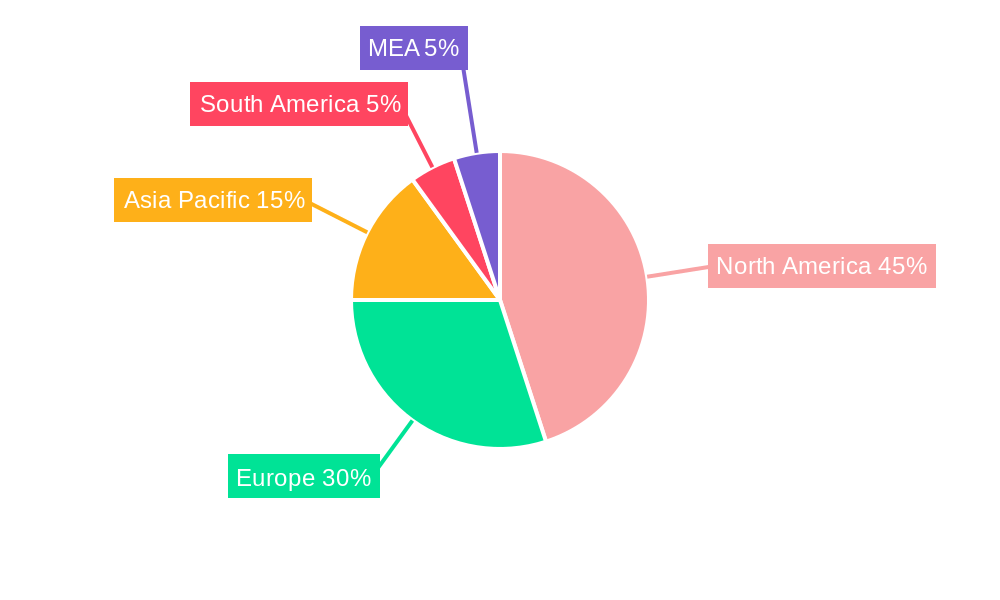
The CGM market segmentation reveals a dynamic landscape. While sensors and durables (receivers and transmitters) constitute the core components driving market revenue, the end-user segment exhibits a diverse mix of hospital/clinical settings and the rapidly growing home/personal use sector. Geographical analysis indicates North America currently holds a substantial market share due to higher diabetes prevalence and advanced healthcare infrastructure, yet strong growth potential exists in Asia-Pacific and other developing regions, particularly fueled by increasing healthcare expenditure and rising diabetes diagnoses. The forecast period (2025-2033) promises continued expansion, with a significant portion of growth anticipated from emerging economies adopting advanced diabetes management technologies. The market faces challenges such as high device costs and potential reimbursement hurdles, but the overwhelming benefits for improved patient health and reduced healthcare costs are expected to overcome these limitations.
CGM Market: A Comprehensive Market Analysis Report (2019-2033)
This comprehensive report provides an in-depth analysis of the Continuous Glucose Monitoring (CGM) market, offering valuable insights into market dynamics, competitive landscapes, and future growth prospects. The study period covers 2019-2033, with 2025 as the base and estimated year. The report projects the market's trajectory from 2025 to 2033. This detailed analysis is crucial for stakeholders seeking to understand and capitalize on opportunities within this rapidly evolving sector. The report utilizes data encompassing Millions of dollars for all values.
CGM Market Market Structure & Competitive Dynamics
The CGM market is characterized by a moderate level of concentration, with key players holding significant market share. However, the emergence of innovative technologies and new entrants is steadily increasing competition. The market's structure is influenced by stringent regulatory frameworks, particularly concerning device safety and efficacy. Product substitution, primarily from alternative diabetes management methods, presents a challenge to market growth. End-user trends show increasing preference for user-friendly, accurate, and minimally invasive CGM systems. Mergers and acquisitions (M&A) activities are also shaping the competitive landscape, with deal values reaching xx Million in recent years. Key M&A activities include [insert specific M&A deals if available, with deal values]. Dexcom Inc currently holds approximately xx% market share, followed by Abbott with xx% and Medtronic PLC with xx%. The innovation ecosystem is highly dynamic, driven by advancements in sensor technology, data analytics, and connectivity.
- Market Concentration: Moderate, with top players holding xx% of the market share.
- Innovation Ecosystem: Highly dynamic, driven by advancements in sensor technology and data analytics.
- Regulatory Frameworks: Stringent, focusing on device safety and efficacy.
- Product Substitutes: Traditional blood glucose monitoring methods.
- End-User Trends: Growing preference for user-friendly and accurate CGM systems.
- M&A Activities: Significant activity with xx Million in deal values in recent years.
CGM Market Industry Trends & Insights
The CGM market is experiencing robust growth, driven by factors such as the rising prevalence of diabetes, technological advancements leading to improved device accuracy and usability, and increasing patient awareness. The Compound Annual Growth Rate (CAGR) during the forecast period (2025-2033) is estimated to be xx%. Technological disruptions, including the integration of artificial intelligence (AI) and machine learning (ML) for predictive analytics, are transforming CGM technology. Consumer preferences are shifting towards smaller, less intrusive, and more integrated devices that offer seamless data connectivity and personalized insights. Competitive dynamics are intensifying, with key players investing heavily in research and development to maintain their market position. Market penetration is expected to reach xx% by 2033, driven by increased affordability and wider insurance coverage.
Dominant Markets & Segments in CGM Market
The North American region currently dominates the CGM market, primarily due to high diabetes prevalence, advanced healthcare infrastructure, and robust regulatory support. Within the component segment, Sensors holds the largest market share, followed by Durables (Receivers and Transmitter). In the end-user segment, the Home/Personal use category is experiencing significant growth, driven by increasing patient preference for self-monitoring and improved home-based healthcare options.
- Key Drivers of North American Dominance:
- High diabetes prevalence.
- Advanced healthcare infrastructure.
- Strong regulatory support and reimbursement policies.
- Component Segment:
- Sensors: Largest market share due to ongoing technological advancements.
- Durables (Receivers and Transmitter): Significant market share driven by demand for integrated systems.
- End-User Segment:
- Home/Personal: Fastest growing segment, driven by increased patient preference for self-monitoring.
- Hospital/Home: Significant market share driven by hospital and healthcare provider usage.
CGM Market Product Innovations
Recent innovations in CGM technology focus on improving accuracy, reducing invasiveness, extending sensor lifespan, and integrating advanced data analytics. Integrated CGM (iCGM) systems, like the Dexcom Stelo, are gaining popularity due to their simplified design and user-friendliness. These advancements are enhancing patient experience and improving diabetes management outcomes, leading to increased market adoption. Miniaturization, wireless connectivity, and improved data visualization are key technological trends driving product differentiation and competitive advantage.
Report Segmentation & Scope
The CGM market is segmented by component (Sensors, Durables (Receivers and Transmitter)) and end-user (Hospital/Home, Home/Personal). The Sensors segment is projected to experience significant growth driven by advancements in sensor technology and miniaturization. The Durables (Receivers and Transmitter) segment is also expected to show substantial growth due to increasing demand for integrated CGM systems. The Home/Personal end-user segment is expected to have the highest growth rate due to rising patient preference for self-monitoring and home-based care. Competitive dynamics within each segment vary based on technological capabilities, pricing strategies, and distribution channels.
Key Drivers of CGM Market Growth
Several factors drive the CGM market's growth. The rising prevalence of diabetes globally is a significant factor. Technological advancements leading to more accurate, user-friendly, and cost-effective devices are also contributing to market expansion. Favorable regulatory environments and increasing insurance coverage further boost market growth. Growing patient awareness and increased demand for self-monitoring are additional crucial drivers. The integration of CGM data with other health management platforms will further enhance market expansion.
Challenges in the CGM Market Sector
Despite robust growth, challenges remain. High device costs and limited insurance coverage restrict market penetration in certain regions. Supply chain disruptions and competition from alternative diabetes management technologies pose risks. Stringent regulatory approvals and potential safety concerns can also impede market expansion. The need for continuous calibration and potential for sensor failures remains a significant challenge.
Leading Players in the CGM Market Market
- Medtrum Technologies
- Nemaura Medical Inc
- A Menarini Diagnostics s r l
- F Hoffmann-La Roche Ltd
- Ypsomed Holding AG
- Senseonics Holdings Inc
- Dexcom Inc
- Medtronic PLC
- Abbott
- i-Sens Inc
Key Developments in CGM Market Sector
- March 2024: The Dexcom Stelo Glucose Biosensor System, an integrated CGM (iCGM), received marketing clearance from the US FDA. This expanded the CGM market to individuals aged 18 and older not requiring insulin.
- May 2023: Dexcom showcased its G6 CGM system at the 66th Annual Meeting of the Japan Diabetes Society, highlighting its real-time glucose data capabilities and eliminating the need for finger-prick testing. This significantly increased awareness and potential market expansion in Japan.
Strategic CGM Market Market Outlook
The CGM market is poised for continued growth driven by technological advancements, expanding applications, and increasing patient adoption. Strategic opportunities exist for companies investing in innovative sensor technologies, data analytics capabilities, and personalized diabetes management solutions. Partnerships and collaborations will play a crucial role in expanding market reach and improving patient outcomes. The integration of CGM with other wearable health technologies presents significant growth potential. The expanding market for continuous glucose monitoring in non-diabetic populations also represents significant untapped opportunity.
CGM Market Segmentation
-
1. Component
- 1.1. Sensors
- 1.2. Durables(Receivers and Transmitters)
-
2. End User
- 2.1. Hospital/Clinics
- 2.2. Home/Personal
CGM Market Segmentation By Geography
-
1. North America
- 1.1. United States
- 1.2. Canada
- 1.3. Rest of North America
-
2. Europe
- 2.1. France
- 2.2. Germany
- 2.3. Italy
- 2.4. Spain
- 2.5. United Kingdom
- 2.6. Russia
- 2.7. Rest of Europe
-
3. Latin America
- 3.1. Mexico
- 3.2. Brazil
- 3.3. Rest of Latin America
-
4. Asia Pacific
- 4.1. Japan
- 4.2. South Korea
- 4.3. China
- 4.4. India
- 4.5. Australia
- 4.6. Vietnam
- 4.7. Malaysia
- 4.8. Indonesia
- 4.9. Philippines
- 4.10. Thailand
- 4.11. Rest of Asia Pacific
-
5. Middle East and Africa
- 5.1. Saudi Arabia
- 5.2. Iran
- 5.3. Egypt
- 5.4. Oman
- 5.5. South Africa
- 5.6. Rest of Middle East and Africa
CGM Market REPORT HIGHLIGHTS
| Aspects | Details |
|---|---|
| Study Period | 2019-2033 |
| Base Year | 2024 |
| Estimated Year | 2025 |
| Forecast Period | 2025-2033 |
| Historical Period | 2019-2024 |
| Growth Rate | CAGR of 12.89% from 2019-2033 |
| Segmentation |
|
Table of Contents
- 1. Introduction
- 1.1. Research Scope
- 1.2. Market Segmentation
- 1.3. Research Methodology
- 1.4. Definitions and Assumptions
- 2. Executive Summary
- 2.1. Introduction
- 3. Market Dynamics
- 3.1. Introduction
- 3.2. Market Drivers
- 3.2.1. Growing Burden of Gastrointestinal Diseases; Rising Preference of Point of Care Test
- 3.3. Market Restrains
- 3.3.1. High Cost of Instruments
- 3.4. Market Trends
- 3.4.1. The Sensors Segment is Expected to Hold a Major Market Share Over the Forecast Period
- 4. Market Factor Analysis
- 4.1. Porters Five Forces
- 4.2. Supply/Value Chain
- 4.3. PESTEL analysis
- 4.4. Market Entropy
- 4.5. Patent/Trademark Analysis
- 5. Global CGM Market Analysis, Insights and Forecast, 2019-2031
- 5.1. Market Analysis, Insights and Forecast - by Component
- 5.1.1. Sensors
- 5.1.2. Durables(Receivers and Transmitters)
- 5.2. Market Analysis, Insights and Forecast - by End User
- 5.2.1. Hospital/Clinics
- 5.2.2. Home/Personal
- 5.3. Market Analysis, Insights and Forecast - by Region
- 5.3.1. North America
- 5.3.2. Europe
- 5.3.3. Latin America
- 5.3.4. Asia Pacific
- 5.3.5. Middle East and Africa
- 5.1. Market Analysis, Insights and Forecast - by Component
- 6. North America CGM Market Analysis, Insights and Forecast, 2019-2031
- 6.1. Market Analysis, Insights and Forecast - by Component
- 6.1.1. Sensors
- 6.1.2. Durables(Receivers and Transmitters)
- 6.2. Market Analysis, Insights and Forecast - by End User
- 6.2.1. Hospital/Clinics
- 6.2.2. Home/Personal
- 6.1. Market Analysis, Insights and Forecast - by Component
- 7. Europe CGM Market Analysis, Insights and Forecast, 2019-2031
- 7.1. Market Analysis, Insights and Forecast - by Component
- 7.1.1. Sensors
- 7.1.2. Durables(Receivers and Transmitters)
- 7.2. Market Analysis, Insights and Forecast - by End User
- 7.2.1. Hospital/Clinics
- 7.2.2. Home/Personal
- 7.1. Market Analysis, Insights and Forecast - by Component
- 8. Latin America CGM Market Analysis, Insights and Forecast, 2019-2031
- 8.1. Market Analysis, Insights and Forecast - by Component
- 8.1.1. Sensors
- 8.1.2. Durables(Receivers and Transmitters)
- 8.2. Market Analysis, Insights and Forecast - by End User
- 8.2.1. Hospital/Clinics
- 8.2.2. Home/Personal
- 8.1. Market Analysis, Insights and Forecast - by Component
- 9. Asia Pacific CGM Market Analysis, Insights and Forecast, 2019-2031
- 9.1. Market Analysis, Insights and Forecast - by Component
- 9.1.1. Sensors
- 9.1.2. Durables(Receivers and Transmitters)
- 9.2. Market Analysis, Insights and Forecast - by End User
- 9.2.1. Hospital/Clinics
- 9.2.2. Home/Personal
- 9.1. Market Analysis, Insights and Forecast - by Component
- 10. Middle East and Africa CGM Market Analysis, Insights and Forecast, 2019-2031
- 10.1. Market Analysis, Insights and Forecast - by Component
- 10.1.1. Sensors
- 10.1.2. Durables(Receivers and Transmitters)
- 10.2. Market Analysis, Insights and Forecast - by End User
- 10.2.1. Hospital/Clinics
- 10.2.2. Home/Personal
- 10.1. Market Analysis, Insights and Forecast - by Component
- 11. North America CGM Market Analysis, Insights and Forecast, 2019-2031
- 11.1. Market Analysis, Insights and Forecast - By Country/Sub-region
- 11.1.1 United States
- 11.1.2 Canada
- 11.1.3 Mexico
- 12. Europe CGM Market Analysis, Insights and Forecast, 2019-2031
- 12.1. Market Analysis, Insights and Forecast - By Country/Sub-region
- 12.1.1 Germany
- 12.1.2 United Kingdom
- 12.1.3 France
- 12.1.4 Spain
- 12.1.5 Italy
- 12.1.6 Spain
- 12.1.7 Belgium
- 12.1.8 Netherland
- 12.1.9 Nordics
- 12.1.10 Rest of Europe
- 13. Asia Pacific CGM Market Analysis, Insights and Forecast, 2019-2031
- 13.1. Market Analysis, Insights and Forecast - By Country/Sub-region
- 13.1.1 China
- 13.1.2 Japan
- 13.1.3 India
- 13.1.4 South Korea
- 13.1.5 Southeast Asia
- 13.1.6 Australia
- 13.1.7 Indonesia
- 13.1.8 Phillipes
- 13.1.9 Singapore
- 13.1.10 Thailandc
- 13.1.11 Rest of Asia Pacific
- 14. South America CGM Market Analysis, Insights and Forecast, 2019-2031
- 14.1. Market Analysis, Insights and Forecast - By Country/Sub-region
- 14.1.1 Brazil
- 14.1.2 Argentina
- 14.1.3 Peru
- 14.1.4 Chile
- 14.1.5 Colombia
- 14.1.6 Ecuador
- 14.1.7 Venezuela
- 14.1.8 Rest of South America
- 15. MEA CGM Market Analysis, Insights and Forecast, 2019-2031
- 15.1. Market Analysis, Insights and Forecast - By Country/Sub-region
- 15.1.1 United Arab Emirates
- 15.1.2 Saudi Arabia
- 15.1.3 South Africa
- 15.1.4 Rest of Middle East and Africa
- 16. Competitive Analysis
- 16.1. Global Market Share Analysis 2024
- 16.2. Company Profiles
- 16.2.1 Medtrum Technologies
- 16.2.1.1. Overview
- 16.2.1.2. Products
- 16.2.1.3. SWOT Analysis
- 16.2.1.4. Recent Developments
- 16.2.1.5. Financials (Based on Availability)
- 16.2.2 Nemaura Medical Inc
- 16.2.2.1. Overview
- 16.2.2.2. Products
- 16.2.2.3. SWOT Analysis
- 16.2.2.4. Recent Developments
- 16.2.2.5. Financials (Based on Availability)
- 16.2.3 A Menarini Diagnostics s r l
- 16.2.3.1. Overview
- 16.2.3.2. Products
- 16.2.3.3. SWOT Analysis
- 16.2.3.4. Recent Developments
- 16.2.3.5. Financials (Based on Availability)
- 16.2.4 F Hoffmann-La Roche Ltd
- 16.2.4.1. Overview
- 16.2.4.2. Products
- 16.2.4.3. SWOT Analysis
- 16.2.4.4. Recent Developments
- 16.2.4.5. Financials (Based on Availability)
- 16.2.5 Ypsomed Holding AG
- 16.2.5.1. Overview
- 16.2.5.2. Products
- 16.2.5.3. SWOT Analysis
- 16.2.5.4. Recent Developments
- 16.2.5.5. Financials (Based on Availability)
- 16.2.6 Senseonics Holdings Inc
- 16.2.6.1. Overview
- 16.2.6.2. Products
- 16.2.6.3. SWOT Analysis
- 16.2.6.4. Recent Developments
- 16.2.6.5. Financials (Based on Availability)
- 16.2.7 Dexcom Inc
- 16.2.7.1. Overview
- 16.2.7.2. Products
- 16.2.7.3. SWOT Analysis
- 16.2.7.4. Recent Developments
- 16.2.7.5. Financials (Based on Availability)
- 16.2.8 Medtronic PLC
- 16.2.8.1. Overview
- 16.2.8.2. Products
- 16.2.8.3. SWOT Analysis
- 16.2.8.4. Recent Developments
- 16.2.8.5. Financials (Based on Availability)
- 16.2.9 Abbott
- 16.2.9.1. Overview
- 16.2.9.2. Products
- 16.2.9.3. SWOT Analysis
- 16.2.9.4. Recent Developments
- 16.2.9.5. Financials (Based on Availability)
- 16.2.10 i-Sens Inc
- 16.2.10.1. Overview
- 16.2.10.2. Products
- 16.2.10.3. SWOT Analysis
- 16.2.10.4. Recent Developments
- 16.2.10.5. Financials (Based on Availability)
- 16.2.1 Medtrum Technologies
List of Figures
- Figure 1: Global CGM Market Revenue Breakdown (Million, %) by Region 2024 & 2032
- Figure 2: Global CGM Market Volume Breakdown (K Unit, %) by Region 2024 & 2032
- Figure 3: North America CGM Market Revenue (Million), by Country 2024 & 2032
- Figure 4: North America CGM Market Volume (K Unit), by Country 2024 & 2032
- Figure 5: North America CGM Market Revenue Share (%), by Country 2024 & 2032
- Figure 6: North America CGM Market Volume Share (%), by Country 2024 & 2032
- Figure 7: Europe CGM Market Revenue (Million), by Country 2024 & 2032
- Figure 8: Europe CGM Market Volume (K Unit), by Country 2024 & 2032
- Figure 9: Europe CGM Market Revenue Share (%), by Country 2024 & 2032
- Figure 10: Europe CGM Market Volume Share (%), by Country 2024 & 2032
- Figure 11: Asia Pacific CGM Market Revenue (Million), by Country 2024 & 2032
- Figure 12: Asia Pacific CGM Market Volume (K Unit), by Country 2024 & 2032
- Figure 13: Asia Pacific CGM Market Revenue Share (%), by Country 2024 & 2032
- Figure 14: Asia Pacific CGM Market Volume Share (%), by Country 2024 & 2032
- Figure 15: South America CGM Market Revenue (Million), by Country 2024 & 2032
- Figure 16: South America CGM Market Volume (K Unit), by Country 2024 & 2032
- Figure 17: South America CGM Market Revenue Share (%), by Country 2024 & 2032
- Figure 18: South America CGM Market Volume Share (%), by Country 2024 & 2032
- Figure 19: MEA CGM Market Revenue (Million), by Country 2024 & 2032
- Figure 20: MEA CGM Market Volume (K Unit), by Country 2024 & 2032
- Figure 21: MEA CGM Market Revenue Share (%), by Country 2024 & 2032
- Figure 22: MEA CGM Market Volume Share (%), by Country 2024 & 2032
- Figure 23: North America CGM Market Revenue (Million), by Component 2024 & 2032
- Figure 24: North America CGM Market Volume (K Unit), by Component 2024 & 2032
- Figure 25: North America CGM Market Revenue Share (%), by Component 2024 & 2032
- Figure 26: North America CGM Market Volume Share (%), by Component 2024 & 2032
- Figure 27: North America CGM Market Revenue (Million), by End User 2024 & 2032
- Figure 28: North America CGM Market Volume (K Unit), by End User 2024 & 2032
- Figure 29: North America CGM Market Revenue Share (%), by End User 2024 & 2032
- Figure 30: North America CGM Market Volume Share (%), by End User 2024 & 2032
- Figure 31: North America CGM Market Revenue (Million), by Country 2024 & 2032
- Figure 32: North America CGM Market Volume (K Unit), by Country 2024 & 2032
- Figure 33: North America CGM Market Revenue Share (%), by Country 2024 & 2032
- Figure 34: North America CGM Market Volume Share (%), by Country 2024 & 2032
- Figure 35: Europe CGM Market Revenue (Million), by Component 2024 & 2032
- Figure 36: Europe CGM Market Volume (K Unit), by Component 2024 & 2032
- Figure 37: Europe CGM Market Revenue Share (%), by Component 2024 & 2032
- Figure 38: Europe CGM Market Volume Share (%), by Component 2024 & 2032
- Figure 39: Europe CGM Market Revenue (Million), by End User 2024 & 2032
- Figure 40: Europe CGM Market Volume (K Unit), by End User 2024 & 2032
- Figure 41: Europe CGM Market Revenue Share (%), by End User 2024 & 2032
- Figure 42: Europe CGM Market Volume Share (%), by End User 2024 & 2032
- Figure 43: Europe CGM Market Revenue (Million), by Country 2024 & 2032
- Figure 44: Europe CGM Market Volume (K Unit), by Country 2024 & 2032
- Figure 45: Europe CGM Market Revenue Share (%), by Country 2024 & 2032
- Figure 46: Europe CGM Market Volume Share (%), by Country 2024 & 2032
- Figure 47: Latin America CGM Market Revenue (Million), by Component 2024 & 2032
- Figure 48: Latin America CGM Market Volume (K Unit), by Component 2024 & 2032
- Figure 49: Latin America CGM Market Revenue Share (%), by Component 2024 & 2032
- Figure 50: Latin America CGM Market Volume Share (%), by Component 2024 & 2032
- Figure 51: Latin America CGM Market Revenue (Million), by End User 2024 & 2032
- Figure 52: Latin America CGM Market Volume (K Unit), by End User 2024 & 2032
- Figure 53: Latin America CGM Market Revenue Share (%), by End User 2024 & 2032
- Figure 54: Latin America CGM Market Volume Share (%), by End User 2024 & 2032
- Figure 55: Latin America CGM Market Revenue (Million), by Country 2024 & 2032
- Figure 56: Latin America CGM Market Volume (K Unit), by Country 2024 & 2032
- Figure 57: Latin America CGM Market Revenue Share (%), by Country 2024 & 2032
- Figure 58: Latin America CGM Market Volume Share (%), by Country 2024 & 2032
- Figure 59: Asia Pacific CGM Market Revenue (Million), by Component 2024 & 2032
- Figure 60: Asia Pacific CGM Market Volume (K Unit), by Component 2024 & 2032
- Figure 61: Asia Pacific CGM Market Revenue Share (%), by Component 2024 & 2032
- Figure 62: Asia Pacific CGM Market Volume Share (%), by Component 2024 & 2032
- Figure 63: Asia Pacific CGM Market Revenue (Million), by End User 2024 & 2032
- Figure 64: Asia Pacific CGM Market Volume (K Unit), by End User 2024 & 2032
- Figure 65: Asia Pacific CGM Market Revenue Share (%), by End User 2024 & 2032
- Figure 66: Asia Pacific CGM Market Volume Share (%), by End User 2024 & 2032
- Figure 67: Asia Pacific CGM Market Revenue (Million), by Country 2024 & 2032
- Figure 68: Asia Pacific CGM Market Volume (K Unit), by Country 2024 & 2032
- Figure 69: Asia Pacific CGM Market Revenue Share (%), by Country 2024 & 2032
- Figure 70: Asia Pacific CGM Market Volume Share (%), by Country 2024 & 2032
- Figure 71: Middle East and Africa CGM Market Revenue (Million), by Component 2024 & 2032
- Figure 72: Middle East and Africa CGM Market Volume (K Unit), by Component 2024 & 2032
- Figure 73: Middle East and Africa CGM Market Revenue Share (%), by Component 2024 & 2032
- Figure 74: Middle East and Africa CGM Market Volume Share (%), by Component 2024 & 2032
- Figure 75: Middle East and Africa CGM Market Revenue (Million), by End User 2024 & 2032
- Figure 76: Middle East and Africa CGM Market Volume (K Unit), by End User 2024 & 2032
- Figure 77: Middle East and Africa CGM Market Revenue Share (%), by End User 2024 & 2032
- Figure 78: Middle East and Africa CGM Market Volume Share (%), by End User 2024 & 2032
- Figure 79: Middle East and Africa CGM Market Revenue (Million), by Country 2024 & 2032
- Figure 80: Middle East and Africa CGM Market Volume (K Unit), by Country 2024 & 2032
- Figure 81: Middle East and Africa CGM Market Revenue Share (%), by Country 2024 & 2032
- Figure 82: Middle East and Africa CGM Market Volume Share (%), by Country 2024 & 2032
List of Tables
- Table 1: Global CGM Market Revenue Million Forecast, by Region 2019 & 2032
- Table 2: Global CGM Market Volume K Unit Forecast, by Region 2019 & 2032
- Table 3: Global CGM Market Revenue Million Forecast, by Component 2019 & 2032
- Table 4: Global CGM Market Volume K Unit Forecast, by Component 2019 & 2032
- Table 5: Global CGM Market Revenue Million Forecast, by End User 2019 & 2032
- Table 6: Global CGM Market Volume K Unit Forecast, by End User 2019 & 2032
- Table 7: Global CGM Market Revenue Million Forecast, by Region 2019 & 2032
- Table 8: Global CGM Market Volume K Unit Forecast, by Region 2019 & 2032
- Table 9: Global CGM Market Revenue Million Forecast, by Country 2019 & 2032
- Table 10: Global CGM Market Volume K Unit Forecast, by Country 2019 & 2032
- Table 11: United States CGM Market Revenue (Million) Forecast, by Application 2019 & 2032
- Table 12: United States CGM Market Volume (K Unit) Forecast, by Application 2019 & 2032
- Table 13: Canada CGM Market Revenue (Million) Forecast, by Application 2019 & 2032
- Table 14: Canada CGM Market Volume (K Unit) Forecast, by Application 2019 & 2032
- Table 15: Mexico CGM Market Revenue (Million) Forecast, by Application 2019 & 2032
- Table 16: Mexico CGM Market Volume (K Unit) Forecast, by Application 2019 & 2032
- Table 17: Global CGM Market Revenue Million Forecast, by Country 2019 & 2032
- Table 18: Global CGM Market Volume K Unit Forecast, by Country 2019 & 2032
- Table 19: Germany CGM Market Revenue (Million) Forecast, by Application 2019 & 2032
- Table 20: Germany CGM Market Volume (K Unit) Forecast, by Application 2019 & 2032
- Table 21: United Kingdom CGM Market Revenue (Million) Forecast, by Application 2019 & 2032
- Table 22: United Kingdom CGM Market Volume (K Unit) Forecast, by Application 2019 & 2032
- Table 23: France CGM Market Revenue (Million) Forecast, by Application 2019 & 2032
- Table 24: France CGM Market Volume (K Unit) Forecast, by Application 2019 & 2032
- Table 25: Spain CGM Market Revenue (Million) Forecast, by Application 2019 & 2032
- Table 26: Spain CGM Market Volume (K Unit) Forecast, by Application 2019 & 2032
- Table 27: Italy CGM Market Revenue (Million) Forecast, by Application 2019 & 2032
- Table 28: Italy CGM Market Volume (K Unit) Forecast, by Application 2019 & 2032
- Table 29: Spain CGM Market Revenue (Million) Forecast, by Application 2019 & 2032
- Table 30: Spain CGM Market Volume (K Unit) Forecast, by Application 2019 & 2032
- Table 31: Belgium CGM Market Revenue (Million) Forecast, by Application 2019 & 2032
- Table 32: Belgium CGM Market Volume (K Unit) Forecast, by Application 2019 & 2032
- Table 33: Netherland CGM Market Revenue (Million) Forecast, by Application 2019 & 2032
- Table 34: Netherland CGM Market Volume (K Unit) Forecast, by Application 2019 & 2032
- Table 35: Nordics CGM Market Revenue (Million) Forecast, by Application 2019 & 2032
- Table 36: Nordics CGM Market Volume (K Unit) Forecast, by Application 2019 & 2032
- Table 37: Rest of Europe CGM Market Revenue (Million) Forecast, by Application 2019 & 2032
- Table 38: Rest of Europe CGM Market Volume (K Unit) Forecast, by Application 2019 & 2032
- Table 39: Global CGM Market Revenue Million Forecast, by Country 2019 & 2032
- Table 40: Global CGM Market Volume K Unit Forecast, by Country 2019 & 2032
- Table 41: China CGM Market Revenue (Million) Forecast, by Application 2019 & 2032
- Table 42: China CGM Market Volume (K Unit) Forecast, by Application 2019 & 2032
- Table 43: Japan CGM Market Revenue (Million) Forecast, by Application 2019 & 2032
- Table 44: Japan CGM Market Volume (K Unit) Forecast, by Application 2019 & 2032
- Table 45: India CGM Market Revenue (Million) Forecast, by Application 2019 & 2032
- Table 46: India CGM Market Volume (K Unit) Forecast, by Application 2019 & 2032
- Table 47: South Korea CGM Market Revenue (Million) Forecast, by Application 2019 & 2032
- Table 48: South Korea CGM Market Volume (K Unit) Forecast, by Application 2019 & 2032
- Table 49: Southeast Asia CGM Market Revenue (Million) Forecast, by Application 2019 & 2032
- Table 50: Southeast Asia CGM Market Volume (K Unit) Forecast, by Application 2019 & 2032
- Table 51: Australia CGM Market Revenue (Million) Forecast, by Application 2019 & 2032
- Table 52: Australia CGM Market Volume (K Unit) Forecast, by Application 2019 & 2032
- Table 53: Indonesia CGM Market Revenue (Million) Forecast, by Application 2019 & 2032
- Table 54: Indonesia CGM Market Volume (K Unit) Forecast, by Application 2019 & 2032
- Table 55: Phillipes CGM Market Revenue (Million) Forecast, by Application 2019 & 2032
- Table 56: Phillipes CGM Market Volume (K Unit) Forecast, by Application 2019 & 2032
- Table 57: Singapore CGM Market Revenue (Million) Forecast, by Application 2019 & 2032
- Table 58: Singapore CGM Market Volume (K Unit) Forecast, by Application 2019 & 2032
- Table 59: Thailandc CGM Market Revenue (Million) Forecast, by Application 2019 & 2032
- Table 60: Thailandc CGM Market Volume (K Unit) Forecast, by Application 2019 & 2032
- Table 61: Rest of Asia Pacific CGM Market Revenue (Million) Forecast, by Application 2019 & 2032
- Table 62: Rest of Asia Pacific CGM Market Volume (K Unit) Forecast, by Application 2019 & 2032
- Table 63: Global CGM Market Revenue Million Forecast, by Country 2019 & 2032
- Table 64: Global CGM Market Volume K Unit Forecast, by Country 2019 & 2032
- Table 65: Brazil CGM Market Revenue (Million) Forecast, by Application 2019 & 2032
- Table 66: Brazil CGM Market Volume (K Unit) Forecast, by Application 2019 & 2032
- Table 67: Argentina CGM Market Revenue (Million) Forecast, by Application 2019 & 2032
- Table 68: Argentina CGM Market Volume (K Unit) Forecast, by Application 2019 & 2032
- Table 69: Peru CGM Market Revenue (Million) Forecast, by Application 2019 & 2032
- Table 70: Peru CGM Market Volume (K Unit) Forecast, by Application 2019 & 2032
- Table 71: Chile CGM Market Revenue (Million) Forecast, by Application 2019 & 2032
- Table 72: Chile CGM Market Volume (K Unit) Forecast, by Application 2019 & 2032
- Table 73: Colombia CGM Market Revenue (Million) Forecast, by Application 2019 & 2032
- Table 74: Colombia CGM Market Volume (K Unit) Forecast, by Application 2019 & 2032
- Table 75: Ecuador CGM Market Revenue (Million) Forecast, by Application 2019 & 2032
- Table 76: Ecuador CGM Market Volume (K Unit) Forecast, by Application 2019 & 2032
- Table 77: Venezuela CGM Market Revenue (Million) Forecast, by Application 2019 & 2032
- Table 78: Venezuela CGM Market Volume (K Unit) Forecast, by Application 2019 & 2032
- Table 79: Rest of South America CGM Market Revenue (Million) Forecast, by Application 2019 & 2032
- Table 80: Rest of South America CGM Market Volume (K Unit) Forecast, by Application 2019 & 2032
- Table 81: Global CGM Market Revenue Million Forecast, by Country 2019 & 2032
- Table 82: Global CGM Market Volume K Unit Forecast, by Country 2019 & 2032
- Table 83: United Arab Emirates CGM Market Revenue (Million) Forecast, by Application 2019 & 2032
- Table 84: United Arab Emirates CGM Market Volume (K Unit) Forecast, by Application 2019 & 2032
- Table 85: Saudi Arabia CGM Market Revenue (Million) Forecast, by Application 2019 & 2032
- Table 86: Saudi Arabia CGM Market Volume (K Unit) Forecast, by Application 2019 & 2032
- Table 87: South Africa CGM Market Revenue (Million) Forecast, by Application 2019 & 2032
- Table 88: South Africa CGM Market Volume (K Unit) Forecast, by Application 2019 & 2032
- Table 89: Rest of Middle East and Africa CGM Market Revenue (Million) Forecast, by Application 2019 & 2032
- Table 90: Rest of Middle East and Africa CGM Market Volume (K Unit) Forecast, by Application 2019 & 2032
- Table 91: Global CGM Market Revenue Million Forecast, by Component 2019 & 2032
- Table 92: Global CGM Market Volume K Unit Forecast, by Component 2019 & 2032
- Table 93: Global CGM Market Revenue Million Forecast, by End User 2019 & 2032
- Table 94: Global CGM Market Volume K Unit Forecast, by End User 2019 & 2032
- Table 95: Global CGM Market Revenue Million Forecast, by Country 2019 & 2032
- Table 96: Global CGM Market Volume K Unit Forecast, by Country 2019 & 2032
- Table 97: United States CGM Market Revenue (Million) Forecast, by Application 2019 & 2032
- Table 98: United States CGM Market Volume (K Unit) Forecast, by Application 2019 & 2032
- Table 99: Canada CGM Market Revenue (Million) Forecast, by Application 2019 & 2032
- Table 100: Canada CGM Market Volume (K Unit) Forecast, by Application 2019 & 2032
- Table 101: Rest of North America CGM Market Revenue (Million) Forecast, by Application 2019 & 2032
- Table 102: Rest of North America CGM Market Volume (K Unit) Forecast, by Application 2019 & 2032
- Table 103: Global CGM Market Revenue Million Forecast, by Component 2019 & 2032
- Table 104: Global CGM Market Volume K Unit Forecast, by Component 2019 & 2032
- Table 105: Global CGM Market Revenue Million Forecast, by End User 2019 & 2032
- Table 106: Global CGM Market Volume K Unit Forecast, by End User 2019 & 2032
- Table 107: Global CGM Market Revenue Million Forecast, by Country 2019 & 2032
- Table 108: Global CGM Market Volume K Unit Forecast, by Country 2019 & 2032
- Table 109: France CGM Market Revenue (Million) Forecast, by Application 2019 & 2032
- Table 110: France CGM Market Volume (K Unit) Forecast, by Application 2019 & 2032
- Table 111: Germany CGM Market Revenue (Million) Forecast, by Application 2019 & 2032
- Table 112: Germany CGM Market Volume (K Unit) Forecast, by Application 2019 & 2032
- Table 113: Italy CGM Market Revenue (Million) Forecast, by Application 2019 & 2032
- Table 114: Italy CGM Market Volume (K Unit) Forecast, by Application 2019 & 2032
- Table 115: Spain CGM Market Revenue (Million) Forecast, by Application 2019 & 2032
- Table 116: Spain CGM Market Volume (K Unit) Forecast, by Application 2019 & 2032
- Table 117: United Kingdom CGM Market Revenue (Million) Forecast, by Application 2019 & 2032
- Table 118: United Kingdom CGM Market Volume (K Unit) Forecast, by Application 2019 & 2032
- Table 119: Russia CGM Market Revenue (Million) Forecast, by Application 2019 & 2032
- Table 120: Russia CGM Market Volume (K Unit) Forecast, by Application 2019 & 2032
- Table 121: Rest of Europe CGM Market Revenue (Million) Forecast, by Application 2019 & 2032
- Table 122: Rest of Europe CGM Market Volume (K Unit) Forecast, by Application 2019 & 2032
- Table 123: Global CGM Market Revenue Million Forecast, by Component 2019 & 2032
- Table 124: Global CGM Market Volume K Unit Forecast, by Component 2019 & 2032
- Table 125: Global CGM Market Revenue Million Forecast, by End User 2019 & 2032
- Table 126: Global CGM Market Volume K Unit Forecast, by End User 2019 & 2032
- Table 127: Global CGM Market Revenue Million Forecast, by Country 2019 & 2032
- Table 128: Global CGM Market Volume K Unit Forecast, by Country 2019 & 2032
- Table 129: Mexico CGM Market Revenue (Million) Forecast, by Application 2019 & 2032
- Table 130: Mexico CGM Market Volume (K Unit) Forecast, by Application 2019 & 2032
- Table 131: Brazil CGM Market Revenue (Million) Forecast, by Application 2019 & 2032
- Table 132: Brazil CGM Market Volume (K Unit) Forecast, by Application 2019 & 2032
- Table 133: Rest of Latin America CGM Market Revenue (Million) Forecast, by Application 2019 & 2032
- Table 134: Rest of Latin America CGM Market Volume (K Unit) Forecast, by Application 2019 & 2032
- Table 135: Global CGM Market Revenue Million Forecast, by Component 2019 & 2032
- Table 136: Global CGM Market Volume K Unit Forecast, by Component 2019 & 2032
- Table 137: Global CGM Market Revenue Million Forecast, by End User 2019 & 2032
- Table 138: Global CGM Market Volume K Unit Forecast, by End User 2019 & 2032
- Table 139: Global CGM Market Revenue Million Forecast, by Country 2019 & 2032
- Table 140: Global CGM Market Volume K Unit Forecast, by Country 2019 & 2032
- Table 141: Japan CGM Market Revenue (Million) Forecast, by Application 2019 & 2032
- Table 142: Japan CGM Market Volume (K Unit) Forecast, by Application 2019 & 2032
- Table 143: South Korea CGM Market Revenue (Million) Forecast, by Application 2019 & 2032
- Table 144: South Korea CGM Market Volume (K Unit) Forecast, by Application 2019 & 2032
- Table 145: China CGM Market Revenue (Million) Forecast, by Application 2019 & 2032
- Table 146: China CGM Market Volume (K Unit) Forecast, by Application 2019 & 2032
- Table 147: India CGM Market Revenue (Million) Forecast, by Application 2019 & 2032
- Table 148: India CGM Market Volume (K Unit) Forecast, by Application 2019 & 2032
- Table 149: Australia CGM Market Revenue (Million) Forecast, by Application 2019 & 2032
- Table 150: Australia CGM Market Volume (K Unit) Forecast, by Application 2019 & 2032
- Table 151: Vietnam CGM Market Revenue (Million) Forecast, by Application 2019 & 2032
- Table 152: Vietnam CGM Market Volume (K Unit) Forecast, by Application 2019 & 2032
- Table 153: Malaysia CGM Market Revenue (Million) Forecast, by Application 2019 & 2032
- Table 154: Malaysia CGM Market Volume (K Unit) Forecast, by Application 2019 & 2032
- Table 155: Indonesia CGM Market Revenue (Million) Forecast, by Application 2019 & 2032
- Table 156: Indonesia CGM Market Volume (K Unit) Forecast, by Application 2019 & 2032
- Table 157: Philippines CGM Market Revenue (Million) Forecast, by Application 2019 & 2032
- Table 158: Philippines CGM Market Volume (K Unit) Forecast, by Application 2019 & 2032
- Table 159: Thailand CGM Market Revenue (Million) Forecast, by Application 2019 & 2032
- Table 160: Thailand CGM Market Volume (K Unit) Forecast, by Application 2019 & 2032
- Table 161: Rest of Asia Pacific CGM Market Revenue (Million) Forecast, by Application 2019 & 2032
- Table 162: Rest of Asia Pacific CGM Market Volume (K Unit) Forecast, by Application 2019 & 2032
- Table 163: Global CGM Market Revenue Million Forecast, by Component 2019 & 2032
- Table 164: Global CGM Market Volume K Unit Forecast, by Component 2019 & 2032
- Table 165: Global CGM Market Revenue Million Forecast, by End User 2019 & 2032
- Table 166: Global CGM Market Volume K Unit Forecast, by End User 2019 & 2032
- Table 167: Global CGM Market Revenue Million Forecast, by Country 2019 & 2032
- Table 168: Global CGM Market Volume K Unit Forecast, by Country 2019 & 2032
- Table 169: Saudi Arabia CGM Market Revenue (Million) Forecast, by Application 2019 & 2032
- Table 170: Saudi Arabia CGM Market Volume (K Unit) Forecast, by Application 2019 & 2032
- Table 171: Iran CGM Market Revenue (Million) Forecast, by Application 2019 & 2032
- Table 172: Iran CGM Market Volume (K Unit) Forecast, by Application 2019 & 2032
- Table 173: Egypt CGM Market Revenue (Million) Forecast, by Application 2019 & 2032
- Table 174: Egypt CGM Market Volume (K Unit) Forecast, by Application 2019 & 2032
- Table 175: Oman CGM Market Revenue (Million) Forecast, by Application 2019 & 2032
- Table 176: Oman CGM Market Volume (K Unit) Forecast, by Application 2019 & 2032
- Table 177: South Africa CGM Market Revenue (Million) Forecast, by Application 2019 & 2032
- Table 178: South Africa CGM Market Volume (K Unit) Forecast, by Application 2019 & 2032
- Table 179: Rest of Middle East and Africa CGM Market Revenue (Million) Forecast, by Application 2019 & 2032
- Table 180: Rest of Middle East and Africa CGM Market Volume (K Unit) Forecast, by Application 2019 & 2032
Frequently Asked Questions
1. What is the projected Compound Annual Growth Rate (CAGR) of the CGM Market?
The projected CAGR is approximately 12.89%.
2. Which companies are prominent players in the CGM Market?
Key companies in the market include Medtrum Technologies, Nemaura Medical Inc, A Menarini Diagnostics s r l, F Hoffmann-La Roche Ltd, Ypsomed Holding AG, Senseonics Holdings Inc, Dexcom Inc, Medtronic PLC, Abbott, i-Sens Inc .
3. What are the main segments of the CGM Market?
The market segments include Component, End User.
4. Can you provide details about the market size?
The market size is estimated to be USD 11.63 Million as of 2022.
5. What are some drivers contributing to market growth?
Growing Burden of Gastrointestinal Diseases; Rising Preference of Point of Care Test.
6. What are the notable trends driving market growth?
The Sensors Segment is Expected to Hold a Major Market Share Over the Forecast Period.
7. Are there any restraints impacting market growth?
High Cost of Instruments.
8. Can you provide examples of recent developments in the market?
March 2024: The Dexcom Stelo Glucose Biosensor System, an integrated CGM (iCGM), was granted marketing clearance by the US Food and Drug Administration. The device is designed for individuals aged 18 and above who do not require insulin, including those with diabetes managing their condition through oral medications and those without diabetes who wish to gain insights into the effects of diet and exercise on their blood sugar levels.
9. What pricing options are available for accessing the report?
Pricing options include single-user, multi-user, and enterprise licenses priced at USD 4750, USD 5250, and USD 8750 respectively.
10. Is the market size provided in terms of value or volume?
The market size is provided in terms of value, measured in Million and volume, measured in K Unit.
11. Are there any specific market keywords associated with the report?
Yes, the market keyword associated with the report is "CGM Market," which aids in identifying and referencing the specific market segment covered.
12. How do I determine which pricing option suits my needs best?
The pricing options vary based on user requirements and access needs. Individual users may opt for single-user licenses, while businesses requiring broader access may choose multi-user or enterprise licenses for cost-effective access to the report.
13. Are there any additional resources or data provided in the CGM Market report?
While the report offers comprehensive insights, it's advisable to review the specific contents or supplementary materials provided to ascertain if additional resources or data are available.
14. How can I stay updated on further developments or reports in the CGM Market?
To stay informed about further developments, trends, and reports in the CGM Market, consider subscribing to industry newsletters, following relevant companies and organizations, or regularly checking reputable industry news sources and publications.
Methodology
Step 1 - Identification of Relevant Samples Size from Population Database


Step 2 - Approaches for Defining Global Market Size (Value, Volume* & Price*)

Note*: In applicable scenarios
Step 3 - Data Sources
Primary Research
- Web Analytics
- Survey Reports
- Research Institute
- Latest Research Reports
- Opinion Leaders
Secondary Research
- Annual Reports
- White Paper
- Latest Press Release
- Industry Association
- Paid Database
- Investor Presentations

Step 4 - Data Triangulation
Involves using different sources of information in order to increase the validity of a study
These sources are likely to be stakeholders in a program - participants, other researchers, program staff, other community members, and so on.
Then we put all data in single framework & apply various statistical tools to find out the dynamic on the market.
During the analysis stage, feedback from the stakeholder groups would be compared to determine areas of agreement as well as areas of divergence


