
Key Insights
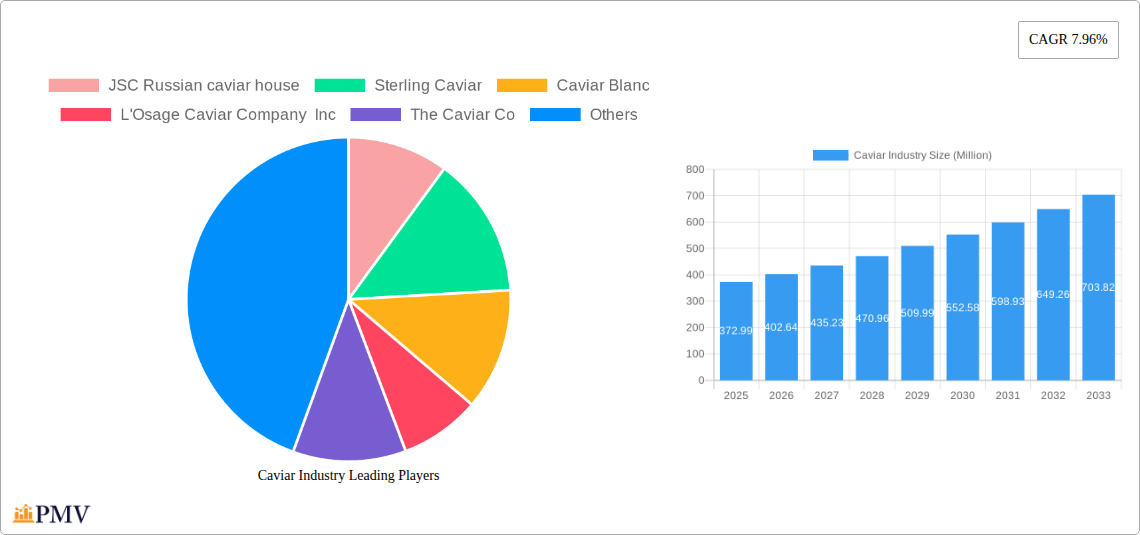
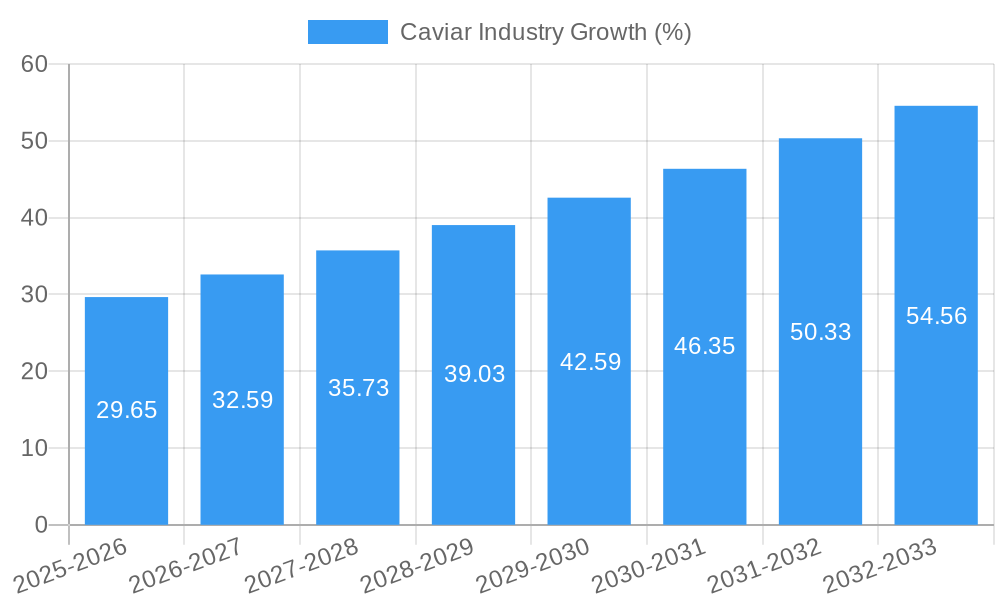
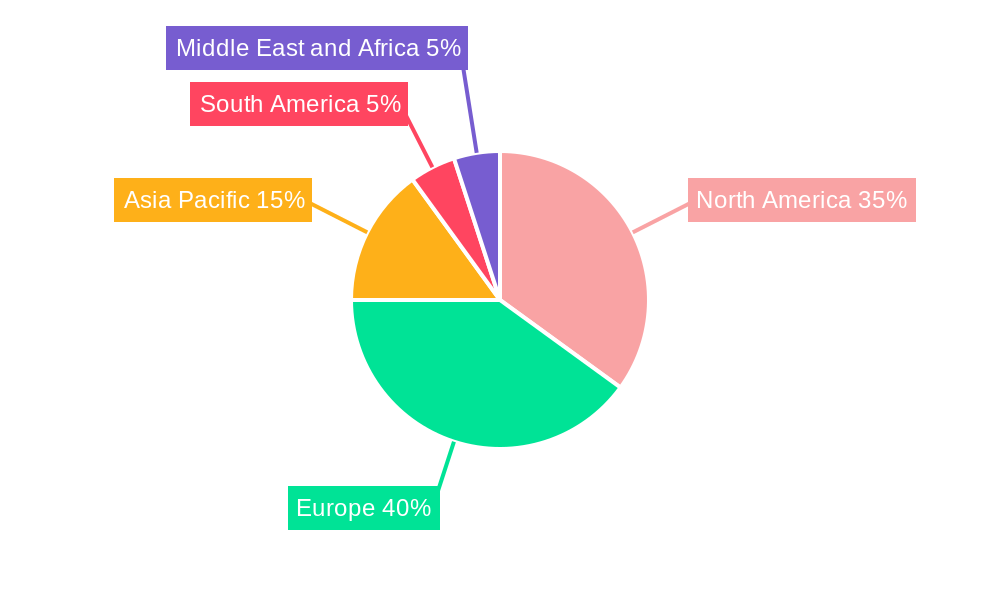
The global caviar market, valued at $372.99 million in 2025, is projected to experience robust growth, driven by increasing demand from affluent consumers seeking luxury food products. The compound annual growth rate (CAGR) of 7.96% from 2025 to 2033 indicates significant expansion opportunities. Key drivers include rising disposable incomes in emerging economies, expanding luxury food retail channels, and the growing popularity of caviar in gourmet cuisine and high-end dining experiences. Premium caviar types like Beluga and Osetra command higher prices, contributing significantly to market value, while the growing availability of sustainable and ethically sourced caviar is expected to mitigate some of the constraints related to supply chain complexities and environmental concerns. The fresh segment currently dominates the market, followed by frozen caviar, but the dried segment is expected to see increased demand due to its extended shelf life and convenience. The on-trade channel (restaurants, bars) currently holds a significant market share, but off-trade sales (retail) are anticipated to grow due to increased online accessibility and home delivery services. Regional analysis reveals that North America and Europe currently dominate the market, but Asia-Pacific is anticipated to exhibit the fastest growth due to rising affluence and changing consumption patterns. Competition is concentrated among several established players and newer entrants, indicating a market ripe for innovation and differentiation through sustainable practices, product diversification, and strategic branding.
The competitive landscape comprises both established international brands and regional players. Companies are focusing on strengthening their supply chains to meet the growing demand, while also investing in marketing and brand building to enhance product visibility and exclusivity. Product diversification, including introducing innovative caviar varieties and related luxury products, is a key strategy to capture a larger market share. The market's future growth hinges on effectively addressing environmental concerns related to sturgeon conservation and ensuring the sustainability of caviar production. Furthermore, maintaining price stability amidst fluctuating supply and demand dynamics is vital for sustaining the market's long-term growth trajectory. Strict quality control and authenticity certification will remain key factors driving consumer confidence and market growth. Technological advancements in caviar processing and preservation techniques are also expected to contribute to the overall market expansion.
Comprehensive Report: Caviar Industry Market Analysis, 2019-2033
This in-depth report provides a comprehensive analysis of the global caviar industry, offering invaluable insights into market dynamics, competitive landscapes, and future growth prospects. The study period covers 2019-2033, with 2025 serving as the base and estimated year. The forecast period spans 2025-2033, and the historical period encompasses 2019-2024. This report is essential for industry players, investors, and stakeholders seeking to navigate this lucrative yet complex market. The global caviar market size is estimated to reach xx Million by 2025, exhibiting a CAGR of xx% during the forecast period.
Caviar Industry Market Structure & Competitive Dynamics
The global caviar market exhibits a moderately concentrated structure, with a few key players commanding significant market share. The market share of the top five companies – estimated to be approximately xx% in 2025 – highlights the importance of understanding competitive dynamics. Innovation in sustainable aquaculture techniques and product diversification are key aspects of this competitive landscape. Regulatory frameworks surrounding caviar production and trade vary globally, influencing market access and pricing. Product substitutes, such as plant-based caviar alternatives, are gaining traction, yet the inherent luxury and exclusivity of genuine caviar maintain its appeal. End-user trends lean towards premiumization and experience-driven consumption, boosting demand for high-quality caviar and specialized products. M&A activity in the industry has seen a modest increase in recent years, with deal values totaling an estimated xx Million in 2024, reflecting efforts to consolidate market share and expand product portfolios. Key strategic partnerships and collaborative efforts are also observed, highlighting a trend toward vertical integration within the supply chain.
Caviar Industry Industry Trends & Insights
The global caviar market is experiencing robust growth fueled by increasing disposable incomes in key regions and a growing appreciation for luxury food items among affluent consumers. The market's high-end positioning is a key driver, with strong demand from upscale restaurants and hotels (On-Trade). Technological advancements in aquaculture have improved the quality and consistency of farmed caviar, boosting supply and affordability. However, challenges persist concerning consumer awareness of sustainable practices and the potential for mislabeling or fraud in the market. The market exhibits strong regional variations, with established markets like Europe and North America being complemented by emerging markets in Asia displaying significant growth potential. Consumer preference for specific caviar types (Beluga, Osetra, Sevruga) influences pricing and market segmentation. The forecast suggests that the market will continue to evolve, with further innovation in processing, packaging, and distribution shaping the landscape. The CAGR is predicted to be xx% during the forecast period, indicating substantial growth opportunities. Market penetration in key demographics remains relatively high, highlighting the segment's mature yet resilient nature. Competitive dynamics will remain a key aspect, driving innovation and influencing pricing strategies.
Dominant Markets & Segments in Caviar Industry
The global caviar market is predominantly driven by North America and Europe, followed by emerging markets in Asia. Within these regions, specific countries such as France, Russia, and the USA are particularly significant.
Key Drivers:
- High disposable incomes: fueling luxury food consumption.
- Established culinary culture: particularly in Europe and North America.
- Growing awareness of caviar as a premium product: leading to increased demand.
Dominant Segments:
- Type: Beluga caviar maintains its position as the most prestigious and expensive type, followed by Osetra and Sevruga. However, the 'Other Types' segment exhibits growth potential as consumers explore unique and diverse options.
- Form: Fresh caviar commands a premium price, but frozen and dried forms offer convenient and cost-effective alternatives, leading to segment-specific growth trajectories.
- Sales Channel: The On-Trade (restaurants, hotels) segment holds a substantial share, reflecting caviar's luxurious dining context. However, growth in e-commerce and online retail platforms is driving the Off-Trade (direct-to-consumer) segment.
Detailed dominance analysis reveals that the specific market shares for each segment vary based on regional preferences, economic conditions, and consumer awareness of different caviar types and forms. The report provides a detailed breakdown of these market share dynamics for a comprehensive understanding of market dominance factors.
Caviar Industry Product Innovations
Recent innovations focus on sustainable aquaculture practices, enhancing caviar quality and consistency. New packaging solutions ensure superior freshness and shelf life, catering to consumer demands. The market also witnesses the emergence of value-added products such as caviar-infused skincare products, reflecting wider consumer appeal and product diversification strategies. Technological advancements in processing and preservation techniques are key drivers for improvements in product quality and expansion into new market segments. These innovations aim to meet evolving consumer demands while ensuring environmental sustainability and cost-effectiveness.
Report Segmentation & Scope
This report segments the caviar market by type (Sevruga, Osetra, Beluga, Sterlet, Other Types), form (Fresh, Dried, Frozen), and sales channel (On-Trade, Off-Trade). Each segment's growth projections are detailed, accounting for factors such as consumer preference shifts, technological advancements, and pricing strategies. The market size for each segment is presented, along with detailed competitive analyses to understand market dynamics within each segment. For example, the fresh caviar segment is expected to remain dominant, although the frozen segment is projected to grow at a faster rate, driven by improvements in freezing technology.
Key Drivers of Caviar Industry Growth
The caviar industry's growth is fueled by several key factors. Rising disposable incomes in emerging economies create a greater demand for luxury food products. Advances in sustainable aquaculture technologies have increased the availability of high-quality caviar while reducing environmental impact. Favorable regulatory environments in certain regions promote investment and expansion within the industry. The growing popularity of caviar in diverse culinary applications also contributes to market expansion. Increased consumer awareness of the product's health benefits (Omega-3 fatty acids) further promotes market growth.
Challenges in the Caviar Industry Sector
The caviar industry faces challenges like stringent regulations concerning sustainable sourcing and trade, impacting production and distribution costs. Fluctuations in raw material prices and supply chain disruptions can significantly influence profitability. Intense competition from both established players and new entrants necessitates continuous innovation and differentiation. Counterfeit caviar products also pose a threat to market integrity, requiring robust quality control and authentication measures. These factors influence the overall market dynamics and present significant hurdles for industry players.
Leading Players in the Caviar Industry Market
- JSC Russian caviar house
- Sterling Caviar
- Caviar Blanc
- L'Osage Caviar Company Inc
- The Caviar Co
- Black River Caviar
- Labeyrie Fine Food
- Sepehr Dad Caviar GmbH
- Caviar Creator Inc
- Sasanian Caviar Inc
Key Developments in Caviar Industry Sector
- 2022 Q4: Labeyrie Fine Food launched a new sustainable caviar line.
- 2023 Q1: A major merger between two leading caviar producers resulted in a significant market share consolidation.
- 2023 Q3: Several companies introduced innovative packaging to extend the shelf life of caviar.
- 2024 Q2: Increased regulatory scrutiny of caviar sourcing practices.
Strategic Caviar Industry Market Outlook
The caviar market holds significant potential for growth, driven by continued advancements in aquaculture, improved supply chain management, and the expanding global demand for luxury food products. Strategic opportunities lie in sustainable sourcing practices, innovative product development, and targeted marketing campaigns aimed at capturing consumer interest in this premium delicacy. The industry's focus on authenticity, traceability, and premiumization will play a crucial role in shaping future market dynamics. Strategic partnerships and collaborations across the value chain will help companies capitalize on these opportunities and build resilience to the sector's inherent challenges.
Caviar Industry Segmentation
-
1. Type
- 1.1. Sevruga
- 1.2. Osetra
- 1.3. Beluga
- 1.4. Sterlet
- 1.5. Other Types
-
2. Form
- 2.1. Fresh
- 2.2. Dried
- 2.3. Frozen
-
3. Sales Channel
- 3.1. On-Trade
- 3.2. Off-Trade
Caviar Industry Segmentation By Geography
-
1. North America
- 1.1. United States
- 1.2. Canada
- 1.3. Mexico
- 1.4. Rest of North America
-
2. Europe
- 2.1. Spain
- 2.2. United Kingdom
- 2.3. Germany
- 2.4. France
- 2.5. Italy
- 2.6. Russia
- 2.7. Rest of Europe
-
3. Asia Pacific
- 3.1. China
- 3.2. Japan
- 3.3. India
- 3.4. Australia
- 3.5. Rest of Asia Pacific
-
4. South America
- 4.1. Brazil
- 4.2. Argentina
- 4.3. Rest of South America
-
5. Middle East and Africa
- 5.1. South Africa
- 5.2. Saudi Arabia
- 5.3. Rest of Middle East and Africa
Caviar Industry REPORT HIGHLIGHTS
| Aspects | Details |
|---|---|
| Study Period | 2019-2033 |
| Base Year | 2024 |
| Estimated Year | 2025 |
| Forecast Period | 2025-2033 |
| Historical Period | 2019-2024 |
| Growth Rate | CAGR of 7.96% from 2019-2033 |
| Segmentation |
|
Table of Contents
- 1. Introduction
- 1.1. Research Scope
- 1.2. Market Segmentation
- 1.3. Research Methodology
- 1.4. Definitions and Assumptions
- 2. Executive Summary
- 2.1. Introduction
- 3. Market Dynamics
- 3.1. Introduction
- 3.2. Market Drivers
- 3.2.1. Caviar's use in high-end cuisine and gourmet dining boosts its market presence
- 3.3. Market Restrains
- 3.3.1. High price of caviar limits its market to premium segment
- 3.4. Market Trends
- 3.4.1. Advances in aquaculture technology improve caviar quality and production efficiency
- 4. Market Factor Analysis
- 4.1. Porters Five Forces
- 4.2. Supply/Value Chain
- 4.3. PESTEL analysis
- 4.4. Market Entropy
- 4.5. Patent/Trademark Analysis
- 5. Global Caviar Industry Analysis, Insights and Forecast, 2019-2031
- 5.1. Market Analysis, Insights and Forecast - by Type
- 5.1.1. Sevruga
- 5.1.2. Osetra
- 5.1.3. Beluga
- 5.1.4. Sterlet
- 5.1.5. Other Types
- 5.2. Market Analysis, Insights and Forecast - by Form
- 5.2.1. Fresh
- 5.2.2. Dried
- 5.2.3. Frozen
- 5.3. Market Analysis, Insights and Forecast - by Sales Channel
- 5.3.1. On-Trade
- 5.3.2. Off-Trade
- 5.4. Market Analysis, Insights and Forecast - by Region
- 5.4.1. North America
- 5.4.2. Europe
- 5.4.3. Asia Pacific
- 5.4.4. South America
- 5.4.5. Middle East and Africa
- 5.1. Market Analysis, Insights and Forecast - by Type
- 6. North America Caviar Industry Analysis, Insights and Forecast, 2019-2031
- 6.1. Market Analysis, Insights and Forecast - by Type
- 6.1.1. Sevruga
- 6.1.2. Osetra
- 6.1.3. Beluga
- 6.1.4. Sterlet
- 6.1.5. Other Types
- 6.2. Market Analysis, Insights and Forecast - by Form
- 6.2.1. Fresh
- 6.2.2. Dried
- 6.2.3. Frozen
- 6.3. Market Analysis, Insights and Forecast - by Sales Channel
- 6.3.1. On-Trade
- 6.3.2. Off-Trade
- 6.1. Market Analysis, Insights and Forecast - by Type
- 7. Europe Caviar Industry Analysis, Insights and Forecast, 2019-2031
- 7.1. Market Analysis, Insights and Forecast - by Type
- 7.1.1. Sevruga
- 7.1.2. Osetra
- 7.1.3. Beluga
- 7.1.4. Sterlet
- 7.1.5. Other Types
- 7.2. Market Analysis, Insights and Forecast - by Form
- 7.2.1. Fresh
- 7.2.2. Dried
- 7.2.3. Frozen
- 7.3. Market Analysis, Insights and Forecast - by Sales Channel
- 7.3.1. On-Trade
- 7.3.2. Off-Trade
- 7.1. Market Analysis, Insights and Forecast - by Type
- 8. Asia Pacific Caviar Industry Analysis, Insights and Forecast, 2019-2031
- 8.1. Market Analysis, Insights and Forecast - by Type
- 8.1.1. Sevruga
- 8.1.2. Osetra
- 8.1.3. Beluga
- 8.1.4. Sterlet
- 8.1.5. Other Types
- 8.2. Market Analysis, Insights and Forecast - by Form
- 8.2.1. Fresh
- 8.2.2. Dried
- 8.2.3. Frozen
- 8.3. Market Analysis, Insights and Forecast - by Sales Channel
- 8.3.1. On-Trade
- 8.3.2. Off-Trade
- 8.1. Market Analysis, Insights and Forecast - by Type
- 9. South America Caviar Industry Analysis, Insights and Forecast, 2019-2031
- 9.1. Market Analysis, Insights and Forecast - by Type
- 9.1.1. Sevruga
- 9.1.2. Osetra
- 9.1.3. Beluga
- 9.1.4. Sterlet
- 9.1.5. Other Types
- 9.2. Market Analysis, Insights and Forecast - by Form
- 9.2.1. Fresh
- 9.2.2. Dried
- 9.2.3. Frozen
- 9.3. Market Analysis, Insights and Forecast - by Sales Channel
- 9.3.1. On-Trade
- 9.3.2. Off-Trade
- 9.1. Market Analysis, Insights and Forecast - by Type
- 10. Middle East and Africa Caviar Industry Analysis, Insights and Forecast, 2019-2031
- 10.1. Market Analysis, Insights and Forecast - by Type
- 10.1.1. Sevruga
- 10.1.2. Osetra
- 10.1.3. Beluga
- 10.1.4. Sterlet
- 10.1.5. Other Types
- 10.2. Market Analysis, Insights and Forecast - by Form
- 10.2.1. Fresh
- 10.2.2. Dried
- 10.2.3. Frozen
- 10.3. Market Analysis, Insights and Forecast - by Sales Channel
- 10.3.1. On-Trade
- 10.3.2. Off-Trade
- 10.1. Market Analysis, Insights and Forecast - by Type
- 11. North America Caviar Industry Analysis, Insights and Forecast, 2019-2031
- 11.1. Market Analysis, Insights and Forecast - By Country/Sub-region
- 11.1.1 United States
- 11.1.2 Canada
- 11.1.3 Mexico
- 11.1.4 Rest of North America
- 12. Europe Caviar Industry Analysis, Insights and Forecast, 2019-2031
- 12.1. Market Analysis, Insights and Forecast - By Country/Sub-region
- 12.1.1 Spain
- 12.1.2 United Kingdom
- 12.1.3 Germany
- 12.1.4 France
- 12.1.5 Italy
- 12.1.6 Russia
- 12.1.7 Rest of Europe
- 13. Asia Pacific Caviar Industry Analysis, Insights and Forecast, 2019-2031
- 13.1. Market Analysis, Insights and Forecast - By Country/Sub-region
- 13.1.1 China
- 13.1.2 Japan
- 13.1.3 India
- 13.1.4 Australia
- 13.1.5 Rest of Asia Pacific
- 14. South America Caviar Industry Analysis, Insights and Forecast, 2019-2031
- 14.1. Market Analysis, Insights and Forecast - By Country/Sub-region
- 14.1.1 Brazil
- 14.1.2 Argentina
- 14.1.3 Rest of South America
- 15. Middle East and Africa Caviar Industry Analysis, Insights and Forecast, 2019-2031
- 15.1. Market Analysis, Insights and Forecast - By Country/Sub-region
- 15.1.1 South Africa
- 15.1.2 Saudi Arabia
- 15.1.3 Rest of Middle East and Africa
- 16. Competitive Analysis
- 16.1. Global Market Share Analysis 2024
- 16.2. Company Profiles
- 16.2.1 JSC Russian caviar house
- 16.2.1.1. Overview
- 16.2.1.2. Products
- 16.2.1.3. SWOT Analysis
- 16.2.1.4. Recent Developments
- 16.2.1.5. Financials (Based on Availability)
- 16.2.2 Sterling Caviar
- 16.2.2.1. Overview
- 16.2.2.2. Products
- 16.2.2.3. SWOT Analysis
- 16.2.2.4. Recent Developments
- 16.2.2.5. Financials (Based on Availability)
- 16.2.3 Caviar Blanc
- 16.2.3.1. Overview
- 16.2.3.2. Products
- 16.2.3.3. SWOT Analysis
- 16.2.3.4. Recent Developments
- 16.2.3.5. Financials (Based on Availability)
- 16.2.4 L'Osage Caviar Company Inc
- 16.2.4.1. Overview
- 16.2.4.2. Products
- 16.2.4.3. SWOT Analysis
- 16.2.4.4. Recent Developments
- 16.2.4.5. Financials (Based on Availability)
- 16.2.5 The Caviar Co
- 16.2.5.1. Overview
- 16.2.5.2. Products
- 16.2.5.3. SWOT Analysis
- 16.2.5.4. Recent Developments
- 16.2.5.5. Financials (Based on Availability)
- 16.2.6 Black River Caviar
- 16.2.6.1. Overview
- 16.2.6.2. Products
- 16.2.6.3. SWOT Analysis
- 16.2.6.4. Recent Developments
- 16.2.6.5. Financials (Based on Availability)
- 16.2.7 Labeyrie Fine Food
- 16.2.7.1. Overview
- 16.2.7.2. Products
- 16.2.7.3. SWOT Analysis
- 16.2.7.4. Recent Developments
- 16.2.7.5. Financials (Based on Availability)
- 16.2.8 Sepehr Dad Caviar GmbH
- 16.2.8.1. Overview
- 16.2.8.2. Products
- 16.2.8.3. SWOT Analysis
- 16.2.8.4. Recent Developments
- 16.2.8.5. Financials (Based on Availability)
- 16.2.9 Caviar Creator Inc
- 16.2.9.1. Overview
- 16.2.9.2. Products
- 16.2.9.3. SWOT Analysis
- 16.2.9.4. Recent Developments
- 16.2.9.5. Financials (Based on Availability)
- 16.2.10 Sasanian Caviar Inc
- 16.2.10.1. Overview
- 16.2.10.2. Products
- 16.2.10.3. SWOT Analysis
- 16.2.10.4. Recent Developments
- 16.2.10.5. Financials (Based on Availability)
- 16.2.1 JSC Russian caviar house
List of Figures
- Figure 1: Global Caviar Industry Revenue Breakdown (Million, %) by Region 2024 & 2032
- Figure 2: North America Caviar Industry Revenue (Million), by Country 2024 & 2032
- Figure 3: North America Caviar Industry Revenue Share (%), by Country 2024 & 2032
- Figure 4: Europe Caviar Industry Revenue (Million), by Country 2024 & 2032
- Figure 5: Europe Caviar Industry Revenue Share (%), by Country 2024 & 2032
- Figure 6: Asia Pacific Caviar Industry Revenue (Million), by Country 2024 & 2032
- Figure 7: Asia Pacific Caviar Industry Revenue Share (%), by Country 2024 & 2032
- Figure 8: South America Caviar Industry Revenue (Million), by Country 2024 & 2032
- Figure 9: South America Caviar Industry Revenue Share (%), by Country 2024 & 2032
- Figure 10: Middle East and Africa Caviar Industry Revenue (Million), by Country 2024 & 2032
- Figure 11: Middle East and Africa Caviar Industry Revenue Share (%), by Country 2024 & 2032
- Figure 12: North America Caviar Industry Revenue (Million), by Type 2024 & 2032
- Figure 13: North America Caviar Industry Revenue Share (%), by Type 2024 & 2032
- Figure 14: North America Caviar Industry Revenue (Million), by Form 2024 & 2032
- Figure 15: North America Caviar Industry Revenue Share (%), by Form 2024 & 2032
- Figure 16: North America Caviar Industry Revenue (Million), by Sales Channel 2024 & 2032
- Figure 17: North America Caviar Industry Revenue Share (%), by Sales Channel 2024 & 2032
- Figure 18: North America Caviar Industry Revenue (Million), by Country 2024 & 2032
- Figure 19: North America Caviar Industry Revenue Share (%), by Country 2024 & 2032
- Figure 20: Europe Caviar Industry Revenue (Million), by Type 2024 & 2032
- Figure 21: Europe Caviar Industry Revenue Share (%), by Type 2024 & 2032
- Figure 22: Europe Caviar Industry Revenue (Million), by Form 2024 & 2032
- Figure 23: Europe Caviar Industry Revenue Share (%), by Form 2024 & 2032
- Figure 24: Europe Caviar Industry Revenue (Million), by Sales Channel 2024 & 2032
- Figure 25: Europe Caviar Industry Revenue Share (%), by Sales Channel 2024 & 2032
- Figure 26: Europe Caviar Industry Revenue (Million), by Country 2024 & 2032
- Figure 27: Europe Caviar Industry Revenue Share (%), by Country 2024 & 2032
- Figure 28: Asia Pacific Caviar Industry Revenue (Million), by Type 2024 & 2032
- Figure 29: Asia Pacific Caviar Industry Revenue Share (%), by Type 2024 & 2032
- Figure 30: Asia Pacific Caviar Industry Revenue (Million), by Form 2024 & 2032
- Figure 31: Asia Pacific Caviar Industry Revenue Share (%), by Form 2024 & 2032
- Figure 32: Asia Pacific Caviar Industry Revenue (Million), by Sales Channel 2024 & 2032
- Figure 33: Asia Pacific Caviar Industry Revenue Share (%), by Sales Channel 2024 & 2032
- Figure 34: Asia Pacific Caviar Industry Revenue (Million), by Country 2024 & 2032
- Figure 35: Asia Pacific Caviar Industry Revenue Share (%), by Country 2024 & 2032
- Figure 36: South America Caviar Industry Revenue (Million), by Type 2024 & 2032
- Figure 37: South America Caviar Industry Revenue Share (%), by Type 2024 & 2032
- Figure 38: South America Caviar Industry Revenue (Million), by Form 2024 & 2032
- Figure 39: South America Caviar Industry Revenue Share (%), by Form 2024 & 2032
- Figure 40: South America Caviar Industry Revenue (Million), by Sales Channel 2024 & 2032
- Figure 41: South America Caviar Industry Revenue Share (%), by Sales Channel 2024 & 2032
- Figure 42: South America Caviar Industry Revenue (Million), by Country 2024 & 2032
- Figure 43: South America Caviar Industry Revenue Share (%), by Country 2024 & 2032
- Figure 44: Middle East and Africa Caviar Industry Revenue (Million), by Type 2024 & 2032
- Figure 45: Middle East and Africa Caviar Industry Revenue Share (%), by Type 2024 & 2032
- Figure 46: Middle East and Africa Caviar Industry Revenue (Million), by Form 2024 & 2032
- Figure 47: Middle East and Africa Caviar Industry Revenue Share (%), by Form 2024 & 2032
- Figure 48: Middle East and Africa Caviar Industry Revenue (Million), by Sales Channel 2024 & 2032
- Figure 49: Middle East and Africa Caviar Industry Revenue Share (%), by Sales Channel 2024 & 2032
- Figure 50: Middle East and Africa Caviar Industry Revenue (Million), by Country 2024 & 2032
- Figure 51: Middle East and Africa Caviar Industry Revenue Share (%), by Country 2024 & 2032
List of Tables
- Table 1: Global Caviar Industry Revenue Million Forecast, by Region 2019 & 2032
- Table 2: Global Caviar Industry Revenue Million Forecast, by Type 2019 & 2032
- Table 3: Global Caviar Industry Revenue Million Forecast, by Form 2019 & 2032
- Table 4: Global Caviar Industry Revenue Million Forecast, by Sales Channel 2019 & 2032
- Table 5: Global Caviar Industry Revenue Million Forecast, by Region 2019 & 2032
- Table 6: Global Caviar Industry Revenue Million Forecast, by Country 2019 & 2032
- Table 7: United States Caviar Industry Revenue (Million) Forecast, by Application 2019 & 2032
- Table 8: Canada Caviar Industry Revenue (Million) Forecast, by Application 2019 & 2032
- Table 9: Mexico Caviar Industry Revenue (Million) Forecast, by Application 2019 & 2032
- Table 10: Rest of North America Caviar Industry Revenue (Million) Forecast, by Application 2019 & 2032
- Table 11: Global Caviar Industry Revenue Million Forecast, by Country 2019 & 2032
- Table 12: Spain Caviar Industry Revenue (Million) Forecast, by Application 2019 & 2032
- Table 13: United Kingdom Caviar Industry Revenue (Million) Forecast, by Application 2019 & 2032
- Table 14: Germany Caviar Industry Revenue (Million) Forecast, by Application 2019 & 2032
- Table 15: France Caviar Industry Revenue (Million) Forecast, by Application 2019 & 2032
- Table 16: Italy Caviar Industry Revenue (Million) Forecast, by Application 2019 & 2032
- Table 17: Russia Caviar Industry Revenue (Million) Forecast, by Application 2019 & 2032
- Table 18: Rest of Europe Caviar Industry Revenue (Million) Forecast, by Application 2019 & 2032
- Table 19: Global Caviar Industry Revenue Million Forecast, by Country 2019 & 2032
- Table 20: China Caviar Industry Revenue (Million) Forecast, by Application 2019 & 2032
- Table 21: Japan Caviar Industry Revenue (Million) Forecast, by Application 2019 & 2032
- Table 22: India Caviar Industry Revenue (Million) Forecast, by Application 2019 & 2032
- Table 23: Australia Caviar Industry Revenue (Million) Forecast, by Application 2019 & 2032
- Table 24: Rest of Asia Pacific Caviar Industry Revenue (Million) Forecast, by Application 2019 & 2032
- Table 25: Global Caviar Industry Revenue Million Forecast, by Country 2019 & 2032
- Table 26: Brazil Caviar Industry Revenue (Million) Forecast, by Application 2019 & 2032
- Table 27: Argentina Caviar Industry Revenue (Million) Forecast, by Application 2019 & 2032
- Table 28: Rest of South America Caviar Industry Revenue (Million) Forecast, by Application 2019 & 2032
- Table 29: Global Caviar Industry Revenue Million Forecast, by Country 2019 & 2032
- Table 30: South Africa Caviar Industry Revenue (Million) Forecast, by Application 2019 & 2032
- Table 31: Saudi Arabia Caviar Industry Revenue (Million) Forecast, by Application 2019 & 2032
- Table 32: Rest of Middle East and Africa Caviar Industry Revenue (Million) Forecast, by Application 2019 & 2032
- Table 33: Global Caviar Industry Revenue Million Forecast, by Type 2019 & 2032
- Table 34: Global Caviar Industry Revenue Million Forecast, by Form 2019 & 2032
- Table 35: Global Caviar Industry Revenue Million Forecast, by Sales Channel 2019 & 2032
- Table 36: Global Caviar Industry Revenue Million Forecast, by Country 2019 & 2032
- Table 37: United States Caviar Industry Revenue (Million) Forecast, by Application 2019 & 2032
- Table 38: Canada Caviar Industry Revenue (Million) Forecast, by Application 2019 & 2032
- Table 39: Mexico Caviar Industry Revenue (Million) Forecast, by Application 2019 & 2032
- Table 40: Rest of North America Caviar Industry Revenue (Million) Forecast, by Application 2019 & 2032
- Table 41: Global Caviar Industry Revenue Million Forecast, by Type 2019 & 2032
- Table 42: Global Caviar Industry Revenue Million Forecast, by Form 2019 & 2032
- Table 43: Global Caviar Industry Revenue Million Forecast, by Sales Channel 2019 & 2032
- Table 44: Global Caviar Industry Revenue Million Forecast, by Country 2019 & 2032
- Table 45: Spain Caviar Industry Revenue (Million) Forecast, by Application 2019 & 2032
- Table 46: United Kingdom Caviar Industry Revenue (Million) Forecast, by Application 2019 & 2032
- Table 47: Germany Caviar Industry Revenue (Million) Forecast, by Application 2019 & 2032
- Table 48: France Caviar Industry Revenue (Million) Forecast, by Application 2019 & 2032
- Table 49: Italy Caviar Industry Revenue (Million) Forecast, by Application 2019 & 2032
- Table 50: Russia Caviar Industry Revenue (Million) Forecast, by Application 2019 & 2032
- Table 51: Rest of Europe Caviar Industry Revenue (Million) Forecast, by Application 2019 & 2032
- Table 52: Global Caviar Industry Revenue Million Forecast, by Type 2019 & 2032
- Table 53: Global Caviar Industry Revenue Million Forecast, by Form 2019 & 2032
- Table 54: Global Caviar Industry Revenue Million Forecast, by Sales Channel 2019 & 2032
- Table 55: Global Caviar Industry Revenue Million Forecast, by Country 2019 & 2032
- Table 56: China Caviar Industry Revenue (Million) Forecast, by Application 2019 & 2032
- Table 57: Japan Caviar Industry Revenue (Million) Forecast, by Application 2019 & 2032
- Table 58: India Caviar Industry Revenue (Million) Forecast, by Application 2019 & 2032
- Table 59: Australia Caviar Industry Revenue (Million) Forecast, by Application 2019 & 2032
- Table 60: Rest of Asia Pacific Caviar Industry Revenue (Million) Forecast, by Application 2019 & 2032
- Table 61: Global Caviar Industry Revenue Million Forecast, by Type 2019 & 2032
- Table 62: Global Caviar Industry Revenue Million Forecast, by Form 2019 & 2032
- Table 63: Global Caviar Industry Revenue Million Forecast, by Sales Channel 2019 & 2032
- Table 64: Global Caviar Industry Revenue Million Forecast, by Country 2019 & 2032
- Table 65: Brazil Caviar Industry Revenue (Million) Forecast, by Application 2019 & 2032
- Table 66: Argentina Caviar Industry Revenue (Million) Forecast, by Application 2019 & 2032
- Table 67: Rest of South America Caviar Industry Revenue (Million) Forecast, by Application 2019 & 2032
- Table 68: Global Caviar Industry Revenue Million Forecast, by Type 2019 & 2032
- Table 69: Global Caviar Industry Revenue Million Forecast, by Form 2019 & 2032
- Table 70: Global Caviar Industry Revenue Million Forecast, by Sales Channel 2019 & 2032
- Table 71: Global Caviar Industry Revenue Million Forecast, by Country 2019 & 2032
- Table 72: South Africa Caviar Industry Revenue (Million) Forecast, by Application 2019 & 2032
- Table 73: Saudi Arabia Caviar Industry Revenue (Million) Forecast, by Application 2019 & 2032
- Table 74: Rest of Middle East and Africa Caviar Industry Revenue (Million) Forecast, by Application 2019 & 2032
Frequently Asked Questions
1. What is the projected Compound Annual Growth Rate (CAGR) of the Caviar Industry?
The projected CAGR is approximately 7.96%.
2. Which companies are prominent players in the Caviar Industry?
Key companies in the market include JSC Russian caviar house, Sterling Caviar, Caviar Blanc, L'Osage Caviar Company Inc, The Caviar Co, Black River Caviar, Labeyrie Fine Food, Sepehr Dad Caviar GmbH, Caviar Creator Inc, Sasanian Caviar Inc.
3. What are the main segments of the Caviar Industry?
The market segments include Type, Form, Sales Channel.
4. Can you provide details about the market size?
The market size is estimated to be USD 372.99 Million as of 2022.
5. What are some drivers contributing to market growth?
Caviar's use in high-end cuisine and gourmet dining boosts its market presence.
6. What are the notable trends driving market growth?
Advances in aquaculture technology improve caviar quality and production efficiency.
7. Are there any restraints impacting market growth?
High price of caviar limits its market to premium segment.
8. Can you provide examples of recent developments in the market?
N/A
9. What pricing options are available for accessing the report?
Pricing options include single-user, multi-user, and enterprise licenses priced at USD 4750, USD 5250, and USD 8750 respectively.
10. Is the market size provided in terms of value or volume?
The market size is provided in terms of value, measured in Million.
11. Are there any specific market keywords associated with the report?
Yes, the market keyword associated with the report is "Caviar Industry," which aids in identifying and referencing the specific market segment covered.
12. How do I determine which pricing option suits my needs best?
The pricing options vary based on user requirements and access needs. Individual users may opt for single-user licenses, while businesses requiring broader access may choose multi-user or enterprise licenses for cost-effective access to the report.
13. Are there any additional resources or data provided in the Caviar Industry report?
While the report offers comprehensive insights, it's advisable to review the specific contents or supplementary materials provided to ascertain if additional resources or data are available.
14. How can I stay updated on further developments or reports in the Caviar Industry?
To stay informed about further developments, trends, and reports in the Caviar Industry, consider subscribing to industry newsletters, following relevant companies and organizations, or regularly checking reputable industry news sources and publications.
Methodology
Step 1 - Identification of Relevant Samples Size from Population Database


Step 2 - Approaches for Defining Global Market Size (Value, Volume* & Price*)

Note*: In applicable scenarios
Step 3 - Data Sources
Primary Research
- Web Analytics
- Survey Reports
- Research Institute
- Latest Research Reports
- Opinion Leaders
Secondary Research
- Annual Reports
- White Paper
- Latest Press Release
- Industry Association
- Paid Database
- Investor Presentations

Step 4 - Data Triangulation
Involves using different sources of information in order to increase the validity of a study
These sources are likely to be stakeholders in a program - participants, other researchers, program staff, other community members, and so on.
Then we put all data in single framework & apply various statistical tools to find out the dynamic on the market.
During the analysis stage, feedback from the stakeholder groups would be compared to determine areas of agreement as well as areas of divergence


