
Key Insights
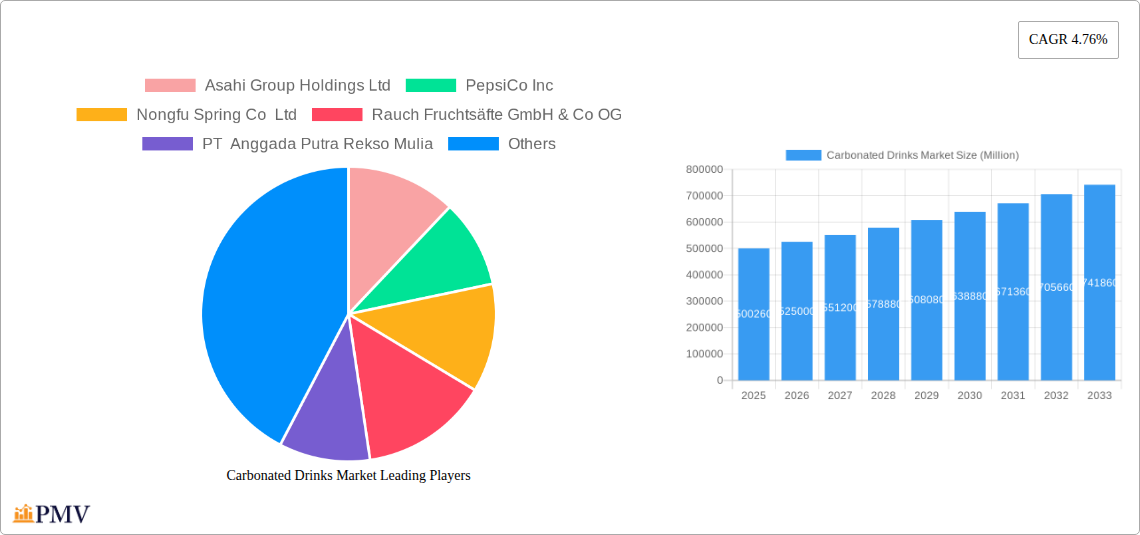
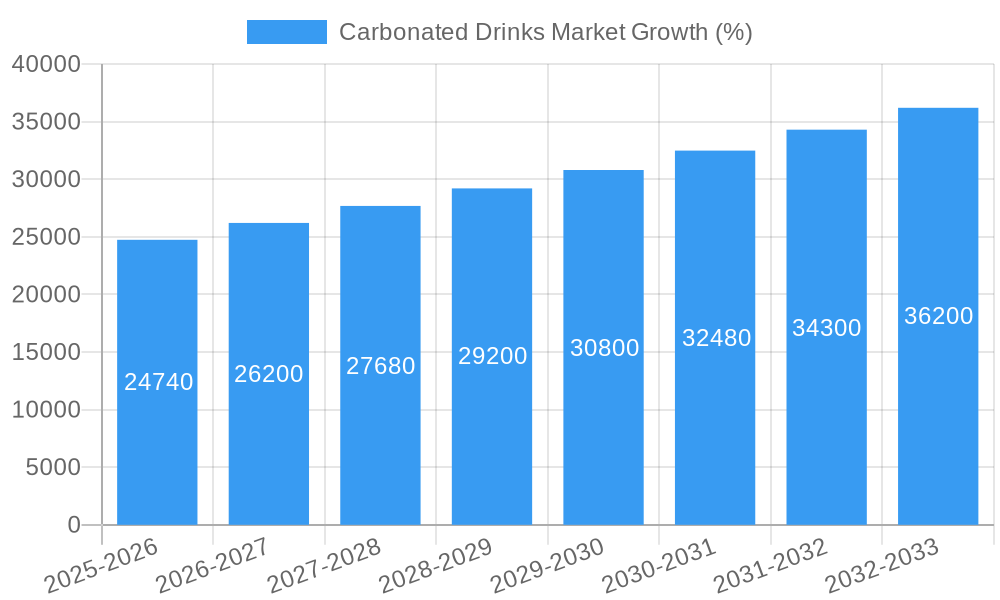
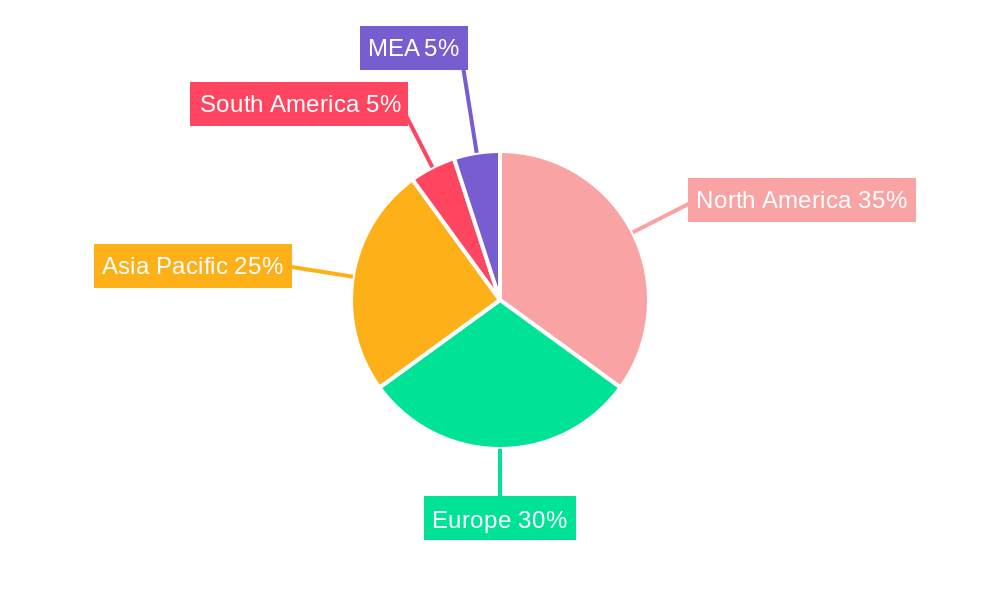
The global carbonated drinks market, valued at $500,260 million in 2025, is projected to experience robust growth, driven by a compound annual growth rate (CAGR) of 4.76% from 2025 to 2033. This expansion is fueled by several key factors. The increasing demand for convenient and refreshing beverages, particularly among younger demographics, continues to propel market growth. Furthermore, the diversification of product offerings, including the rise of fruit-flavored carbonates and diet colas catering to health-conscious consumers, is significantly impacting market dynamics. Effective marketing campaigns emphasizing brand image and lifestyle associations also contribute to sustained demand. However, growing health concerns surrounding sugar consumption and the increasing popularity of healthier alternatives, such as sparkling water and juices, pose significant challenges to market expansion. The market is segmented by type (diet cola, fruit-flavored carbonates, standard cola, and others), packaging (disposable cups, glass bottles, metal cans, PET bottles), and distribution channels (on-trade and off-trade). Regional variations exist, with North America and Europe currently holding significant market shares, while the Asia-Pacific region is expected to witness substantial growth in the coming years driven by rising disposable incomes and changing consumer preferences. Competitive landscape analysis reveals a market dominated by major players like Coca-Cola, PepsiCo, and Asahi, alongside regional and emerging brands. The success of individual companies hinges on innovation, branding, and adapting to evolving consumer preferences.
The forecast period (2025-2033) promises continued growth, albeit at a potentially moderated pace due to the aforementioned health concerns. Strategic initiatives by manufacturers will be crucial in navigating this landscape. This includes focusing on healthier formulations, innovative packaging, sustainable sourcing, and targeted marketing campaigns to maintain market share and appeal to diverse consumer segments. Expansion into emerging markets and leveraging e-commerce channels will also be key strategies for growth. Overall, the carbonated drinks market presents a complex but potentially lucrative arena for established players and emerging businesses alike, requiring a strategic approach that balances market trends, consumer demands, and evolving regulatory landscapes.
Carbonated Drinks Market: A Comprehensive Analysis (2019-2033)
This detailed report provides a comprehensive analysis of the global carbonated drinks market, encompassing market size, growth drivers, competitive landscape, and future outlook. The study period covers 2019-2033, with 2025 as the base and estimated year, and a forecast period of 2025-2033. This in-depth analysis is crucial for businesses seeking to understand the dynamics of this multi-billion-dollar industry. With actionable insights and detailed segmentation, this report is an invaluable resource for strategic decision-making. The report examines major players such as Coca-Cola, PepsiCo, and Asahi, offering a granular view of their market share and strategies.
Carbonated Drinks Market Market Structure & Competitive Dynamics
The global carbonated drinks market is characterized by high concentration, with a few major players dominating the landscape. Key players such as The Coca-Cola Company, PepsiCo Inc., and Asahi Group Holdings Ltd. hold significant market shares, often exceeding xx%. This high concentration is attributed to strong brand recognition, extensive distribution networks, and substantial marketing budgets. However, regional players and smaller beverage companies are also gaining traction, introducing innovative products and tapping into niche segments.
Market innovation is driven by consumer demand for healthier options, leading to increased development of low-sugar, zero-sugar, and functional carbonated drinks. Regulatory frameworks, particularly those related to sugar taxes and labeling requirements, significantly impact market dynamics and product formulation. Product substitutes, such as bottled water, fruit juices, and energy drinks, pose a considerable competitive challenge, requiring producers of carbonated drinks to consistently innovate and differentiate their offerings.
The market has also witnessed several mergers and acquisitions (M&A) activities, with deal values reaching into the xx Million range in recent years. These M&A activities often aim to expand market reach, access new technologies, or acquire complementary product lines.
- Market Concentration: High, with top 3 players controlling xx% of the market.
- Innovation Ecosystem: Focus on healthier alternatives, functional ingredients, and sustainable packaging.
- Regulatory Frameworks: Significant impact from sugar taxes and labeling regulations.
- Product Substitutes: Bottled water, fruit juices, energy drinks pose considerable competition.
- M&A Activities: Significant activity, with deal values in the xx Million range.
- End-user trends: Shift towards healthier options and sustainability.
Carbonated Drinks Market Industry Trends & Insights
The global carbonated drinks market is exhibiting a compound annual growth rate (CAGR) of approximately xx% during the forecast period (2025-2033). Several factors contribute to this growth, including increasing disposable incomes in emerging economies, changing consumer lifestyles, and rising demand for convenient beverages. However, growing health concerns about sugar consumption and the rising popularity of healthier alternatives are moderating market growth.
Technological disruptions, such as the introduction of innovative packaging materials and advanced production technologies, are shaping the industry. Consumer preferences are also shifting, with a notable increase in demand for natural flavors, functional ingredients, and reduced-sugar options. Competitive dynamics are intensifying, with established players focusing on brand building and product diversification, while smaller players leverage innovation and niche marketing strategies. Market penetration of diet cola and fruit-flavored carbonated drinks is increasing, driven by growing health consciousness.
Dominant Markets & Segments in Carbonated Drinks Market
The North American region is currently the dominant market for carbonated drinks, driven by high consumption levels, strong brand presence, and established distribution networks. Within this region, the United States holds the largest market share. Other significant markets include Europe, Asia-Pacific, and Latin America.
- Leading Region: North America
- Leading Segment (Soft Drink Type): Standard Cola maintains the largest segment share, followed by Fruit Flavored Carbonates. The Diet Cola segment shows promising growth.
- Leading Segment (Packaging Type): PET Bottles dominate the packaging market due to their cost-effectiveness and convenience.
- Leading Segment (Distribution Channel): Off-trade channels, such as supermarkets and convenience stores, represent a larger market share compared to on-trade channels (restaurants and bars).
Key Drivers in Dominant Markets:
- North America: High per capita consumption, established distribution networks, strong brand loyalty.
- Europe: Diverse consumer preferences, presence of established and regional players, evolving regulatory landscape.
- Asia-Pacific: Growing disposable incomes, urbanization, and increasing demand for Western-style beverages.
Carbonated Drinks Market Product Innovations
Recent product developments in the carbonated drinks market are focused on healthier options, innovative flavors, and sustainable packaging. Companies are increasingly incorporating natural ingredients, functional additives, and reduced sugar content to appeal to health-conscious consumers. The use of artificial intelligence in flavor development and personalized beverage experiences is emerging as a significant technological trend. These innovations aim to enhance consumer appeal, create competitive advantages, and cater to evolving market preferences.
Report Segmentation & Scope
This report segments the carbonated drinks market by soft drink type (Diet Cola, Fruit Flavored Carbonates, Standard Cola, Other Types), packaging type (Disposable Cups, Glass Bottles, Metal Can, PET Bottles), and distribution channel (Off-trade, Others: On-trade). Each segment’s growth projection, market size, and competitive dynamics are analyzed. The "Other Types" segment includes functional beverages and niche offerings. Growth projections vary across segments, with healthier options showing significant growth potential. Competitive dynamics differ, with established brands dominating standard cola and new entrants challenging in niche categories.
Key Drivers of Carbonated Drinks Market Growth
Several factors drive growth in the carbonated drinks market: rising disposable incomes, particularly in emerging markets, fuel increased spending on beverages. Changing lifestyles and urbanization are boosting demand for convenient and ready-to-consume drinks. Product innovation, such as the introduction of healthier options and exciting new flavors, is a key growth driver. Finally, effective marketing and brand building play a crucial role in market expansion.
Challenges in the Carbonated Drinks Market Sector
The carbonated drinks market faces several challenges: increasing health concerns regarding sugar consumption are leading to declining sales of traditional high-sugar sodas. Stringent government regulations on sugar content and labeling requirements are impacting product formulation and marketing strategies. The rise of substitute beverages, such as bottled water and healthier alternatives, is also creating pressure on market share. Supply chain disruptions and increasing raw material costs can impact profitability.
Leading Players in the Carbonated Drinks Market Market
- Asahi Group Holdings Ltd
- PepsiCo Inc
- Nongfu Spring Co Ltd
- Rauch Fruchtsäfte GmbH & Co OG
- PT Anggada Putra Rekso Mulia
- Suntory Holdings Limited
- Keurig Dr Pepper Inc
- National Beverage Corp
- Refresco Group BV
- The Coca-Cola Company
- Hangzhou Wahaha Group Co Ltd
- Kirin Holdings Company Limited
- Britvic PLC
- Tingyi (Cayman Islands) Holding Corporation
- Thai Beverages PCL
Key Developments in Carbonated Drinks Market Sector
- January 2023: PepsiCo Inc. launched Starry, a lemon-lime flavored soda available in regular and zero-sugar versions. This launch responds to consumer demand for healthier options.
- October 2023: Coca-Cola launched Coca-Cola Y3000, an AI-created limited-edition flavor under its Coca-Cola Creations platform, highlighting innovative flavor development.
- December 2023: Kirin launched its Tokusei Ginger Ale Sour and sugar-free tea products in Japan, reflecting the growing health consciousness and demand for sugar-free alternatives in the Japanese market.
Strategic Carbonated Drinks Market Market Outlook
The carbonated drinks market presents substantial opportunities for growth. The focus on healthier alternatives, innovative flavors, and sustainable packaging will drive future market expansion. Companies that successfully adapt to changing consumer preferences and leverage technological advancements will be best positioned for success. Strategic investments in research and development, sustainable practices, and targeted marketing campaigns will be crucial for securing market share and maximizing profitability in the years to come.
Carbonated Drinks Market Segmentation
-
1. Soft Drink Type
- 1.1. Diet Cola
- 1.2. Fruit Flavored Carbonates
- 1.3. Standard Cola
- 1.4. Other Types
-
2. Packaging Type
- 2.1. Disposable Cups
- 2.2. Glass Bottles
- 2.3. Metal Can
- 2.4. PET Bottles
-
3. Distribution Channel
-
3.1. Off-trade
- 3.1.1. Convenience Stores
- 3.1.2. Online Retail
- 3.1.3. Supermarket/Hypermarket
- 3.1.4. Others
- 3.2. On-trade
-
3.1. Off-trade
Carbonated Drinks Market Segmentation By Geography
-
1. North America
- 1.1. United States
- 1.2. Canada
- 1.3. Mexico
-
2. South America
- 2.1. Brazil
- 2.2. Argentina
- 2.3. Rest of South America
-
3. Europe
- 3.1. United Kingdom
- 3.2. Germany
- 3.3. France
- 3.4. Italy
- 3.5. Spain
- 3.6. Russia
- 3.7. Benelux
- 3.8. Nordics
- 3.9. Rest of Europe
-
4. Middle East & Africa
- 4.1. Turkey
- 4.2. Israel
- 4.3. GCC
- 4.4. North Africa
- 4.5. South Africa
- 4.6. Rest of Middle East & Africa
-
5. Asia Pacific
- 5.1. China
- 5.2. India
- 5.3. Japan
- 5.4. South Korea
- 5.5. ASEAN
- 5.6. Oceania
- 5.7. Rest of Asia Pacific
Carbonated Drinks Market REPORT HIGHLIGHTS
| Aspects | Details |
|---|---|
| Study Period | 2019-2033 |
| Base Year | 2024 |
| Estimated Year | 2025 |
| Forecast Period | 2025-2033 |
| Historical Period | 2019-2024 |
| Growth Rate | CAGR of 4.76% from 2019-2033 |
| Segmentation |
|
Table of Contents
- 1. Introduction
- 1.1. Research Scope
- 1.2. Market Segmentation
- 1.3. Research Methodology
- 1.4. Definitions and Assumptions
- 2. Executive Summary
- 2.1. Introduction
- 3. Market Dynamics
- 3.1. Introduction
- 3.2. Market Drivers
- 3.2.1. Growing preference for low alcoholic beer by volume (abv) or non-alcoholic beers; Rising number of breweries leading to high prominence of craft beer
- 3.3. Market Restrains
- 3.3.1. Demand for other alcoholic beverages
- 3.4. Market Trends
- 3.4.1. OTHER KEY INDUSTRY TRENDS COVERED IN THE REPORT
- 4. Market Factor Analysis
- 4.1. Porters Five Forces
- 4.2. Supply/Value Chain
- 4.3. PESTEL analysis
- 4.4. Market Entropy
- 4.5. Patent/Trademark Analysis
- 5. Global Carbonated Drinks Market Analysis, Insights and Forecast, 2019-2031
- 5.1. Market Analysis, Insights and Forecast - by Soft Drink Type
- 5.1.1. Diet Cola
- 5.1.2. Fruit Flavored Carbonates
- 5.1.3. Standard Cola
- 5.1.4. Other Types
- 5.2. Market Analysis, Insights and Forecast - by Packaging Type
- 5.2.1. Disposable Cups
- 5.2.2. Glass Bottles
- 5.2.3. Metal Can
- 5.2.4. PET Bottles
- 5.3. Market Analysis, Insights and Forecast - by Distribution Channel
- 5.3.1. Off-trade
- 5.3.1.1. Convenience Stores
- 5.3.1.2. Online Retail
- 5.3.1.3. Supermarket/Hypermarket
- 5.3.1.4. Others
- 5.3.2. On-trade
- 5.3.1. Off-trade
- 5.4. Market Analysis, Insights and Forecast - by Region
- 5.4.1. North America
- 5.4.2. South America
- 5.4.3. Europe
- 5.4.4. Middle East & Africa
- 5.4.5. Asia Pacific
- 5.1. Market Analysis, Insights and Forecast - by Soft Drink Type
- 6. North America Carbonated Drinks Market Analysis, Insights and Forecast, 2019-2031
- 6.1. Market Analysis, Insights and Forecast - by Soft Drink Type
- 6.1.1. Diet Cola
- 6.1.2. Fruit Flavored Carbonates
- 6.1.3. Standard Cola
- 6.1.4. Other Types
- 6.2. Market Analysis, Insights and Forecast - by Packaging Type
- 6.2.1. Disposable Cups
- 6.2.2. Glass Bottles
- 6.2.3. Metal Can
- 6.2.4. PET Bottles
- 6.3. Market Analysis, Insights and Forecast - by Distribution Channel
- 6.3.1. Off-trade
- 6.3.1.1. Convenience Stores
- 6.3.1.2. Online Retail
- 6.3.1.3. Supermarket/Hypermarket
- 6.3.1.4. Others
- 6.3.2. On-trade
- 6.3.1. Off-trade
- 6.1. Market Analysis, Insights and Forecast - by Soft Drink Type
- 7. South America Carbonated Drinks Market Analysis, Insights and Forecast, 2019-2031
- 7.1. Market Analysis, Insights and Forecast - by Soft Drink Type
- 7.1.1. Diet Cola
- 7.1.2. Fruit Flavored Carbonates
- 7.1.3. Standard Cola
- 7.1.4. Other Types
- 7.2. Market Analysis, Insights and Forecast - by Packaging Type
- 7.2.1. Disposable Cups
- 7.2.2. Glass Bottles
- 7.2.3. Metal Can
- 7.2.4. PET Bottles
- 7.3. Market Analysis, Insights and Forecast - by Distribution Channel
- 7.3.1. Off-trade
- 7.3.1.1. Convenience Stores
- 7.3.1.2. Online Retail
- 7.3.1.3. Supermarket/Hypermarket
- 7.3.1.4. Others
- 7.3.2. On-trade
- 7.3.1. Off-trade
- 7.1. Market Analysis, Insights and Forecast - by Soft Drink Type
- 8. Europe Carbonated Drinks Market Analysis, Insights and Forecast, 2019-2031
- 8.1. Market Analysis, Insights and Forecast - by Soft Drink Type
- 8.1.1. Diet Cola
- 8.1.2. Fruit Flavored Carbonates
- 8.1.3. Standard Cola
- 8.1.4. Other Types
- 8.2. Market Analysis, Insights and Forecast - by Packaging Type
- 8.2.1. Disposable Cups
- 8.2.2. Glass Bottles
- 8.2.3. Metal Can
- 8.2.4. PET Bottles
- 8.3. Market Analysis, Insights and Forecast - by Distribution Channel
- 8.3.1. Off-trade
- 8.3.1.1. Convenience Stores
- 8.3.1.2. Online Retail
- 8.3.1.3. Supermarket/Hypermarket
- 8.3.1.4. Others
- 8.3.2. On-trade
- 8.3.1. Off-trade
- 8.1. Market Analysis, Insights and Forecast - by Soft Drink Type
- 9. Middle East & Africa Carbonated Drinks Market Analysis, Insights and Forecast, 2019-2031
- 9.1. Market Analysis, Insights and Forecast - by Soft Drink Type
- 9.1.1. Diet Cola
- 9.1.2. Fruit Flavored Carbonates
- 9.1.3. Standard Cola
- 9.1.4. Other Types
- 9.2. Market Analysis, Insights and Forecast - by Packaging Type
- 9.2.1. Disposable Cups
- 9.2.2. Glass Bottles
- 9.2.3. Metal Can
- 9.2.4. PET Bottles
- 9.3. Market Analysis, Insights and Forecast - by Distribution Channel
- 9.3.1. Off-trade
- 9.3.1.1. Convenience Stores
- 9.3.1.2. Online Retail
- 9.3.1.3. Supermarket/Hypermarket
- 9.3.1.4. Others
- 9.3.2. On-trade
- 9.3.1. Off-trade
- 9.1. Market Analysis, Insights and Forecast - by Soft Drink Type
- 10. Asia Pacific Carbonated Drinks Market Analysis, Insights and Forecast, 2019-2031
- 10.1. Market Analysis, Insights and Forecast - by Soft Drink Type
- 10.1.1. Diet Cola
- 10.1.2. Fruit Flavored Carbonates
- 10.1.3. Standard Cola
- 10.1.4. Other Types
- 10.2. Market Analysis, Insights and Forecast - by Packaging Type
- 10.2.1. Disposable Cups
- 10.2.2. Glass Bottles
- 10.2.3. Metal Can
- 10.2.4. PET Bottles
- 10.3. Market Analysis, Insights and Forecast - by Distribution Channel
- 10.3.1. Off-trade
- 10.3.1.1. Convenience Stores
- 10.3.1.2. Online Retail
- 10.3.1.3. Supermarket/Hypermarket
- 10.3.1.4. Others
- 10.3.2. On-trade
- 10.3.1. Off-trade
- 10.1. Market Analysis, Insights and Forecast - by Soft Drink Type
- 11. North America Carbonated Drinks Market Analysis, Insights and Forecast, 2019-2031
- 11.1. Market Analysis, Insights and Forecast - By Country/Sub-region
- 11.1.1 United States
- 11.1.2 Canada
- 11.1.3 Mexico
- 11.1.4 Rest of North America
- 12. Europe Carbonated Drinks Market Analysis, Insights and Forecast, 2019-2031
- 12.1. Market Analysis, Insights and Forecast - By Country/Sub-region
- 12.1.1. Germany
- 13. Asia Pacific Carbonated Drinks Market Analysis, Insights and Forecast, 2019-2031
- 13.1. Market Analysis, Insights and Forecast - By Country/Sub-region
- 13.1.1 China
- 13.1.2 India
- 13.1.3 Japan
- 13.1.4 South Korea
- 13.1.5 Rest of Asia Pacific
- 14. South America Carbonated Drinks Market Analysis, Insights and Forecast, 2019-2031
- 14.1. Market Analysis, Insights and Forecast - By Country/Sub-region
- 14.1.1 Brazil
- 14.1.2 Argentina
- 14.1.3 Rest of South America
- 15. MEA Carbonated Drinks Market Analysis, Insights and Forecast, 2019-2031
- 15.1. Market Analysis, Insights and Forecast - By Country/Sub-region
- 15.1.1 Middle East
- 15.1.2 Africa
- 16. Competitive Analysis
- 16.1. Global Market Share Analysis 2024
- 16.2. Company Profiles
- 16.2.1 Asahi Group Holdings Ltd
- 16.2.1.1. Overview
- 16.2.1.2. Products
- 16.2.1.3. SWOT Analysis
- 16.2.1.4. Recent Developments
- 16.2.1.5. Financials (Based on Availability)
- 16.2.2 PepsiCo Inc
- 16.2.2.1. Overview
- 16.2.2.2. Products
- 16.2.2.3. SWOT Analysis
- 16.2.2.4. Recent Developments
- 16.2.2.5. Financials (Based on Availability)
- 16.2.3 Nongfu Spring Co Ltd
- 16.2.3.1. Overview
- 16.2.3.2. Products
- 16.2.3.3. SWOT Analysis
- 16.2.3.4. Recent Developments
- 16.2.3.5. Financials (Based on Availability)
- 16.2.4 Rauch Fruchtsäfte GmbH & Co OG
- 16.2.4.1. Overview
- 16.2.4.2. Products
- 16.2.4.3. SWOT Analysis
- 16.2.4.4. Recent Developments
- 16.2.4.5. Financials (Based on Availability)
- 16.2.5 PT Anggada Putra Rekso Mulia
- 16.2.5.1. Overview
- 16.2.5.2. Products
- 16.2.5.3. SWOT Analysis
- 16.2.5.4. Recent Developments
- 16.2.5.5. Financials (Based on Availability)
- 16.2.6 Suntory Holdings Limited
- 16.2.6.1. Overview
- 16.2.6.2. Products
- 16.2.6.3. SWOT Analysis
- 16.2.6.4. Recent Developments
- 16.2.6.5. Financials (Based on Availability)
- 16.2.7 Keurig Dr Pepper Inc
- 16.2.7.1. Overview
- 16.2.7.2. Products
- 16.2.7.3. SWOT Analysis
- 16.2.7.4. Recent Developments
- 16.2.7.5. Financials (Based on Availability)
- 16.2.8 National Beverage Corp
- 16.2.8.1. Overview
- 16.2.8.2. Products
- 16.2.8.3. SWOT Analysis
- 16.2.8.4. Recent Developments
- 16.2.8.5. Financials (Based on Availability)
- 16.2.9 Refresco Group BV
- 16.2.9.1. Overview
- 16.2.9.2. Products
- 16.2.9.3. SWOT Analysis
- 16.2.9.4. Recent Developments
- 16.2.9.5. Financials (Based on Availability)
- 16.2.10 The Coca-Cola Company
- 16.2.10.1. Overview
- 16.2.10.2. Products
- 16.2.10.3. SWOT Analysis
- 16.2.10.4. Recent Developments
- 16.2.10.5. Financials (Based on Availability)
- 16.2.11 Hangzhou Wahaha Group Co Ltd
- 16.2.11.1. Overview
- 16.2.11.2. Products
- 16.2.11.3. SWOT Analysis
- 16.2.11.4. Recent Developments
- 16.2.11.5. Financials (Based on Availability)
- 16.2.12 Kirin Holdings Company Limited
- 16.2.12.1. Overview
- 16.2.12.2. Products
- 16.2.12.3. SWOT Analysis
- 16.2.12.4. Recent Developments
- 16.2.12.5. Financials (Based on Availability)
- 16.2.13 Britvic PLC
- 16.2.13.1. Overview
- 16.2.13.2. Products
- 16.2.13.3. SWOT Analysis
- 16.2.13.4. Recent Developments
- 16.2.13.5. Financials (Based on Availability)
- 16.2.14 Tingyi (Cayman Islands) Holding Corporatio
- 16.2.14.1. Overview
- 16.2.14.2. Products
- 16.2.14.3. SWOT Analysis
- 16.2.14.4. Recent Developments
- 16.2.14.5. Financials (Based on Availability)
- 16.2.15 Thai Beverages PCL
- 16.2.15.1. Overview
- 16.2.15.2. Products
- 16.2.15.3. SWOT Analysis
- 16.2.15.4. Recent Developments
- 16.2.15.5. Financials (Based on Availability)
- 16.2.1 Asahi Group Holdings Ltd
List of Figures
- Figure 1: Global Carbonated Drinks Market Revenue Breakdown (Million, %) by Region 2024 & 2032
- Figure 2: Global Carbonated Drinks Market Volume Breakdown (liter , %) by Region 2024 & 2032
- Figure 3: North America Carbonated Drinks Market Revenue (Million), by Country 2024 & 2032
- Figure 4: North America Carbonated Drinks Market Volume (liter ), by Country 2024 & 2032
- Figure 5: North America Carbonated Drinks Market Revenue Share (%), by Country 2024 & 2032
- Figure 6: North America Carbonated Drinks Market Volume Share (%), by Country 2024 & 2032
- Figure 7: Europe Carbonated Drinks Market Revenue (Million), by Country 2024 & 2032
- Figure 8: Europe Carbonated Drinks Market Volume (liter ), by Country 2024 & 2032
- Figure 9: Europe Carbonated Drinks Market Revenue Share (%), by Country 2024 & 2032
- Figure 10: Europe Carbonated Drinks Market Volume Share (%), by Country 2024 & 2032
- Figure 11: Asia Pacific Carbonated Drinks Market Revenue (Million), by Country 2024 & 2032
- Figure 12: Asia Pacific Carbonated Drinks Market Volume (liter ), by Country 2024 & 2032
- Figure 13: Asia Pacific Carbonated Drinks Market Revenue Share (%), by Country 2024 & 2032
- Figure 14: Asia Pacific Carbonated Drinks Market Volume Share (%), by Country 2024 & 2032
- Figure 15: South America Carbonated Drinks Market Revenue (Million), by Country 2024 & 2032
- Figure 16: South America Carbonated Drinks Market Volume (liter ), by Country 2024 & 2032
- Figure 17: South America Carbonated Drinks Market Revenue Share (%), by Country 2024 & 2032
- Figure 18: South America Carbonated Drinks Market Volume Share (%), by Country 2024 & 2032
- Figure 19: MEA Carbonated Drinks Market Revenue (Million), by Country 2024 & 2032
- Figure 20: MEA Carbonated Drinks Market Volume (liter ), by Country 2024 & 2032
- Figure 21: MEA Carbonated Drinks Market Revenue Share (%), by Country 2024 & 2032
- Figure 22: MEA Carbonated Drinks Market Volume Share (%), by Country 2024 & 2032
- Figure 23: North America Carbonated Drinks Market Revenue (Million), by Soft Drink Type 2024 & 2032
- Figure 24: North America Carbonated Drinks Market Volume (liter ), by Soft Drink Type 2024 & 2032
- Figure 25: North America Carbonated Drinks Market Revenue Share (%), by Soft Drink Type 2024 & 2032
- Figure 26: North America Carbonated Drinks Market Volume Share (%), by Soft Drink Type 2024 & 2032
- Figure 27: North America Carbonated Drinks Market Revenue (Million), by Packaging Type 2024 & 2032
- Figure 28: North America Carbonated Drinks Market Volume (liter ), by Packaging Type 2024 & 2032
- Figure 29: North America Carbonated Drinks Market Revenue Share (%), by Packaging Type 2024 & 2032
- Figure 30: North America Carbonated Drinks Market Volume Share (%), by Packaging Type 2024 & 2032
- Figure 31: North America Carbonated Drinks Market Revenue (Million), by Distribution Channel 2024 & 2032
- Figure 32: North America Carbonated Drinks Market Volume (liter ), by Distribution Channel 2024 & 2032
- Figure 33: North America Carbonated Drinks Market Revenue Share (%), by Distribution Channel 2024 & 2032
- Figure 34: North America Carbonated Drinks Market Volume Share (%), by Distribution Channel 2024 & 2032
- Figure 35: North America Carbonated Drinks Market Revenue (Million), by Country 2024 & 2032
- Figure 36: North America Carbonated Drinks Market Volume (liter ), by Country 2024 & 2032
- Figure 37: North America Carbonated Drinks Market Revenue Share (%), by Country 2024 & 2032
- Figure 38: North America Carbonated Drinks Market Volume Share (%), by Country 2024 & 2032
- Figure 39: South America Carbonated Drinks Market Revenue (Million), by Soft Drink Type 2024 & 2032
- Figure 40: South America Carbonated Drinks Market Volume (liter ), by Soft Drink Type 2024 & 2032
- Figure 41: South America Carbonated Drinks Market Revenue Share (%), by Soft Drink Type 2024 & 2032
- Figure 42: South America Carbonated Drinks Market Volume Share (%), by Soft Drink Type 2024 & 2032
- Figure 43: South America Carbonated Drinks Market Revenue (Million), by Packaging Type 2024 & 2032
- Figure 44: South America Carbonated Drinks Market Volume (liter ), by Packaging Type 2024 & 2032
- Figure 45: South America Carbonated Drinks Market Revenue Share (%), by Packaging Type 2024 & 2032
- Figure 46: South America Carbonated Drinks Market Volume Share (%), by Packaging Type 2024 & 2032
- Figure 47: South America Carbonated Drinks Market Revenue (Million), by Distribution Channel 2024 & 2032
- Figure 48: South America Carbonated Drinks Market Volume (liter ), by Distribution Channel 2024 & 2032
- Figure 49: South America Carbonated Drinks Market Revenue Share (%), by Distribution Channel 2024 & 2032
- Figure 50: South America Carbonated Drinks Market Volume Share (%), by Distribution Channel 2024 & 2032
- Figure 51: South America Carbonated Drinks Market Revenue (Million), by Country 2024 & 2032
- Figure 52: South America Carbonated Drinks Market Volume (liter ), by Country 2024 & 2032
- Figure 53: South America Carbonated Drinks Market Revenue Share (%), by Country 2024 & 2032
- Figure 54: South America Carbonated Drinks Market Volume Share (%), by Country 2024 & 2032
- Figure 55: Europe Carbonated Drinks Market Revenue (Million), by Soft Drink Type 2024 & 2032
- Figure 56: Europe Carbonated Drinks Market Volume (liter ), by Soft Drink Type 2024 & 2032
- Figure 57: Europe Carbonated Drinks Market Revenue Share (%), by Soft Drink Type 2024 & 2032
- Figure 58: Europe Carbonated Drinks Market Volume Share (%), by Soft Drink Type 2024 & 2032
- Figure 59: Europe Carbonated Drinks Market Revenue (Million), by Packaging Type 2024 & 2032
- Figure 60: Europe Carbonated Drinks Market Volume (liter ), by Packaging Type 2024 & 2032
- Figure 61: Europe Carbonated Drinks Market Revenue Share (%), by Packaging Type 2024 & 2032
- Figure 62: Europe Carbonated Drinks Market Volume Share (%), by Packaging Type 2024 & 2032
- Figure 63: Europe Carbonated Drinks Market Revenue (Million), by Distribution Channel 2024 & 2032
- Figure 64: Europe Carbonated Drinks Market Volume (liter ), by Distribution Channel 2024 & 2032
- Figure 65: Europe Carbonated Drinks Market Revenue Share (%), by Distribution Channel 2024 & 2032
- Figure 66: Europe Carbonated Drinks Market Volume Share (%), by Distribution Channel 2024 & 2032
- Figure 67: Europe Carbonated Drinks Market Revenue (Million), by Country 2024 & 2032
- Figure 68: Europe Carbonated Drinks Market Volume (liter ), by Country 2024 & 2032
- Figure 69: Europe Carbonated Drinks Market Revenue Share (%), by Country 2024 & 2032
- Figure 70: Europe Carbonated Drinks Market Volume Share (%), by Country 2024 & 2032
- Figure 71: Middle East & Africa Carbonated Drinks Market Revenue (Million), by Soft Drink Type 2024 & 2032
- Figure 72: Middle East & Africa Carbonated Drinks Market Volume (liter ), by Soft Drink Type 2024 & 2032
- Figure 73: Middle East & Africa Carbonated Drinks Market Revenue Share (%), by Soft Drink Type 2024 & 2032
- Figure 74: Middle East & Africa Carbonated Drinks Market Volume Share (%), by Soft Drink Type 2024 & 2032
- Figure 75: Middle East & Africa Carbonated Drinks Market Revenue (Million), by Packaging Type 2024 & 2032
- Figure 76: Middle East & Africa Carbonated Drinks Market Volume (liter ), by Packaging Type 2024 & 2032
- Figure 77: Middle East & Africa Carbonated Drinks Market Revenue Share (%), by Packaging Type 2024 & 2032
- Figure 78: Middle East & Africa Carbonated Drinks Market Volume Share (%), by Packaging Type 2024 & 2032
- Figure 79: Middle East & Africa Carbonated Drinks Market Revenue (Million), by Distribution Channel 2024 & 2032
- Figure 80: Middle East & Africa Carbonated Drinks Market Volume (liter ), by Distribution Channel 2024 & 2032
- Figure 81: Middle East & Africa Carbonated Drinks Market Revenue Share (%), by Distribution Channel 2024 & 2032
- Figure 82: Middle East & Africa Carbonated Drinks Market Volume Share (%), by Distribution Channel 2024 & 2032
- Figure 83: Middle East & Africa Carbonated Drinks Market Revenue (Million), by Country 2024 & 2032
- Figure 84: Middle East & Africa Carbonated Drinks Market Volume (liter ), by Country 2024 & 2032
- Figure 85: Middle East & Africa Carbonated Drinks Market Revenue Share (%), by Country 2024 & 2032
- Figure 86: Middle East & Africa Carbonated Drinks Market Volume Share (%), by Country 2024 & 2032
- Figure 87: Asia Pacific Carbonated Drinks Market Revenue (Million), by Soft Drink Type 2024 & 2032
- Figure 88: Asia Pacific Carbonated Drinks Market Volume (liter ), by Soft Drink Type 2024 & 2032
- Figure 89: Asia Pacific Carbonated Drinks Market Revenue Share (%), by Soft Drink Type 2024 & 2032
- Figure 90: Asia Pacific Carbonated Drinks Market Volume Share (%), by Soft Drink Type 2024 & 2032
- Figure 91: Asia Pacific Carbonated Drinks Market Revenue (Million), by Packaging Type 2024 & 2032
- Figure 92: Asia Pacific Carbonated Drinks Market Volume (liter ), by Packaging Type 2024 & 2032
- Figure 93: Asia Pacific Carbonated Drinks Market Revenue Share (%), by Packaging Type 2024 & 2032
- Figure 94: Asia Pacific Carbonated Drinks Market Volume Share (%), by Packaging Type 2024 & 2032
- Figure 95: Asia Pacific Carbonated Drinks Market Revenue (Million), by Distribution Channel 2024 & 2032
- Figure 96: Asia Pacific Carbonated Drinks Market Volume (liter ), by Distribution Channel 2024 & 2032
- Figure 97: Asia Pacific Carbonated Drinks Market Revenue Share (%), by Distribution Channel 2024 & 2032
- Figure 98: Asia Pacific Carbonated Drinks Market Volume Share (%), by Distribution Channel 2024 & 2032
- Figure 99: Asia Pacific Carbonated Drinks Market Revenue (Million), by Country 2024 & 2032
- Figure 100: Asia Pacific Carbonated Drinks Market Volume (liter ), by Country 2024 & 2032
- Figure 101: Asia Pacific Carbonated Drinks Market Revenue Share (%), by Country 2024 & 2032
- Figure 102: Asia Pacific Carbonated Drinks Market Volume Share (%), by Country 2024 & 2032
List of Tables
- Table 1: Global Carbonated Drinks Market Revenue Million Forecast, by Region 2019 & 2032
- Table 2: Global Carbonated Drinks Market Volume liter Forecast, by Region 2019 & 2032
- Table 3: Global Carbonated Drinks Market Revenue Million Forecast, by Soft Drink Type 2019 & 2032
- Table 4: Global Carbonated Drinks Market Volume liter Forecast, by Soft Drink Type 2019 & 2032
- Table 5: Global Carbonated Drinks Market Revenue Million Forecast, by Packaging Type 2019 & 2032
- Table 6: Global Carbonated Drinks Market Volume liter Forecast, by Packaging Type 2019 & 2032
- Table 7: Global Carbonated Drinks Market Revenue Million Forecast, by Distribution Channel 2019 & 2032
- Table 8: Global Carbonated Drinks Market Volume liter Forecast, by Distribution Channel 2019 & 2032
- Table 9: Global Carbonated Drinks Market Revenue Million Forecast, by Region 2019 & 2032
- Table 10: Global Carbonated Drinks Market Volume liter Forecast, by Region 2019 & 2032
- Table 11: Global Carbonated Drinks Market Revenue Million Forecast, by Country 2019 & 2032
- Table 12: Global Carbonated Drinks Market Volume liter Forecast, by Country 2019 & 2032
- Table 13: United States Carbonated Drinks Market Revenue (Million) Forecast, by Application 2019 & 2032
- Table 14: United States Carbonated Drinks Market Volume (liter ) Forecast, by Application 2019 & 2032
- Table 15: Canada Carbonated Drinks Market Revenue (Million) Forecast, by Application 2019 & 2032
- Table 16: Canada Carbonated Drinks Market Volume (liter ) Forecast, by Application 2019 & 2032
- Table 17: Mexico Carbonated Drinks Market Revenue (Million) Forecast, by Application 2019 & 2032
- Table 18: Mexico Carbonated Drinks Market Volume (liter ) Forecast, by Application 2019 & 2032
- Table 19: Rest of North America Carbonated Drinks Market Revenue (Million) Forecast, by Application 2019 & 2032
- Table 20: Rest of North America Carbonated Drinks Market Volume (liter ) Forecast, by Application 2019 & 2032
- Table 21: Global Carbonated Drinks Market Revenue Million Forecast, by Country 2019 & 2032
- Table 22: Global Carbonated Drinks Market Volume liter Forecast, by Country 2019 & 2032
- Table 23: Germany Carbonated Drinks Market Revenue (Million) Forecast, by Application 2019 & 2032
- Table 24: Germany Carbonated Drinks Market Volume (liter ) Forecast, by Application 2019 & 2032
- Table 25: Global Carbonated Drinks Market Revenue Million Forecast, by Country 2019 & 2032
- Table 26: Global Carbonated Drinks Market Volume liter Forecast, by Country 2019 & 2032
- Table 27: China Carbonated Drinks Market Revenue (Million) Forecast, by Application 2019 & 2032
- Table 28: China Carbonated Drinks Market Volume (liter ) Forecast, by Application 2019 & 2032
- Table 29: India Carbonated Drinks Market Revenue (Million) Forecast, by Application 2019 & 2032
- Table 30: India Carbonated Drinks Market Volume (liter ) Forecast, by Application 2019 & 2032
- Table 31: Japan Carbonated Drinks Market Revenue (Million) Forecast, by Application 2019 & 2032
- Table 32: Japan Carbonated Drinks Market Volume (liter ) Forecast, by Application 2019 & 2032
- Table 33: South Korea Carbonated Drinks Market Revenue (Million) Forecast, by Application 2019 & 2032
- Table 34: South Korea Carbonated Drinks Market Volume (liter ) Forecast, by Application 2019 & 2032
- Table 35: Rest of Asia Pacific Carbonated Drinks Market Revenue (Million) Forecast, by Application 2019 & 2032
- Table 36: Rest of Asia Pacific Carbonated Drinks Market Volume (liter ) Forecast, by Application 2019 & 2032
- Table 37: Global Carbonated Drinks Market Revenue Million Forecast, by Country 2019 & 2032
- Table 38: Global Carbonated Drinks Market Volume liter Forecast, by Country 2019 & 2032
- Table 39: Brazil Carbonated Drinks Market Revenue (Million) Forecast, by Application 2019 & 2032
- Table 40: Brazil Carbonated Drinks Market Volume (liter ) Forecast, by Application 2019 & 2032
- Table 41: Argentina Carbonated Drinks Market Revenue (Million) Forecast, by Application 2019 & 2032
- Table 42: Argentina Carbonated Drinks Market Volume (liter ) Forecast, by Application 2019 & 2032
- Table 43: Rest of South America Carbonated Drinks Market Revenue (Million) Forecast, by Application 2019 & 2032
- Table 44: Rest of South America Carbonated Drinks Market Volume (liter ) Forecast, by Application 2019 & 2032
- Table 45: Global Carbonated Drinks Market Revenue Million Forecast, by Country 2019 & 2032
- Table 46: Global Carbonated Drinks Market Volume liter Forecast, by Country 2019 & 2032
- Table 47: Middle East Carbonated Drinks Market Revenue (Million) Forecast, by Application 2019 & 2032
- Table 48: Middle East Carbonated Drinks Market Volume (liter ) Forecast, by Application 2019 & 2032
- Table 49: Africa Carbonated Drinks Market Revenue (Million) Forecast, by Application 2019 & 2032
- Table 50: Africa Carbonated Drinks Market Volume (liter ) Forecast, by Application 2019 & 2032
- Table 51: Global Carbonated Drinks Market Revenue Million Forecast, by Soft Drink Type 2019 & 2032
- Table 52: Global Carbonated Drinks Market Volume liter Forecast, by Soft Drink Type 2019 & 2032
- Table 53: Global Carbonated Drinks Market Revenue Million Forecast, by Packaging Type 2019 & 2032
- Table 54: Global Carbonated Drinks Market Volume liter Forecast, by Packaging Type 2019 & 2032
- Table 55: Global Carbonated Drinks Market Revenue Million Forecast, by Distribution Channel 2019 & 2032
- Table 56: Global Carbonated Drinks Market Volume liter Forecast, by Distribution Channel 2019 & 2032
- Table 57: Global Carbonated Drinks Market Revenue Million Forecast, by Country 2019 & 2032
- Table 58: Global Carbonated Drinks Market Volume liter Forecast, by Country 2019 & 2032
- Table 59: United States Carbonated Drinks Market Revenue (Million) Forecast, by Application 2019 & 2032
- Table 60: United States Carbonated Drinks Market Volume (liter ) Forecast, by Application 2019 & 2032
- Table 61: Canada Carbonated Drinks Market Revenue (Million) Forecast, by Application 2019 & 2032
- Table 62: Canada Carbonated Drinks Market Volume (liter ) Forecast, by Application 2019 & 2032
- Table 63: Mexico Carbonated Drinks Market Revenue (Million) Forecast, by Application 2019 & 2032
- Table 64: Mexico Carbonated Drinks Market Volume (liter ) Forecast, by Application 2019 & 2032
- Table 65: Global Carbonated Drinks Market Revenue Million Forecast, by Soft Drink Type 2019 & 2032
- Table 66: Global Carbonated Drinks Market Volume liter Forecast, by Soft Drink Type 2019 & 2032
- Table 67: Global Carbonated Drinks Market Revenue Million Forecast, by Packaging Type 2019 & 2032
- Table 68: Global Carbonated Drinks Market Volume liter Forecast, by Packaging Type 2019 & 2032
- Table 69: Global Carbonated Drinks Market Revenue Million Forecast, by Distribution Channel 2019 & 2032
- Table 70: Global Carbonated Drinks Market Volume liter Forecast, by Distribution Channel 2019 & 2032
- Table 71: Global Carbonated Drinks Market Revenue Million Forecast, by Country 2019 & 2032
- Table 72: Global Carbonated Drinks Market Volume liter Forecast, by Country 2019 & 2032
- Table 73: Brazil Carbonated Drinks Market Revenue (Million) Forecast, by Application 2019 & 2032
- Table 74: Brazil Carbonated Drinks Market Volume (liter ) Forecast, by Application 2019 & 2032
- Table 75: Argentina Carbonated Drinks Market Revenue (Million) Forecast, by Application 2019 & 2032
- Table 76: Argentina Carbonated Drinks Market Volume (liter ) Forecast, by Application 2019 & 2032
- Table 77: Rest of South America Carbonated Drinks Market Revenue (Million) Forecast, by Application 2019 & 2032
- Table 78: Rest of South America Carbonated Drinks Market Volume (liter ) Forecast, by Application 2019 & 2032
- Table 79: Global Carbonated Drinks Market Revenue Million Forecast, by Soft Drink Type 2019 & 2032
- Table 80: Global Carbonated Drinks Market Volume liter Forecast, by Soft Drink Type 2019 & 2032
- Table 81: Global Carbonated Drinks Market Revenue Million Forecast, by Packaging Type 2019 & 2032
- Table 82: Global Carbonated Drinks Market Volume liter Forecast, by Packaging Type 2019 & 2032
- Table 83: Global Carbonated Drinks Market Revenue Million Forecast, by Distribution Channel 2019 & 2032
- Table 84: Global Carbonated Drinks Market Volume liter Forecast, by Distribution Channel 2019 & 2032
- Table 85: Global Carbonated Drinks Market Revenue Million Forecast, by Country 2019 & 2032
- Table 86: Global Carbonated Drinks Market Volume liter Forecast, by Country 2019 & 2032
- Table 87: United Kingdom Carbonated Drinks Market Revenue (Million) Forecast, by Application 2019 & 2032
- Table 88: United Kingdom Carbonated Drinks Market Volume (liter ) Forecast, by Application 2019 & 2032
- Table 89: Germany Carbonated Drinks Market Revenue (Million) Forecast, by Application 2019 & 2032
- Table 90: Germany Carbonated Drinks Market Volume (liter ) Forecast, by Application 2019 & 2032
- Table 91: France Carbonated Drinks Market Revenue (Million) Forecast, by Application 2019 & 2032
- Table 92: France Carbonated Drinks Market Volume (liter ) Forecast, by Application 2019 & 2032
- Table 93: Italy Carbonated Drinks Market Revenue (Million) Forecast, by Application 2019 & 2032
- Table 94: Italy Carbonated Drinks Market Volume (liter ) Forecast, by Application 2019 & 2032
- Table 95: Spain Carbonated Drinks Market Revenue (Million) Forecast, by Application 2019 & 2032
- Table 96: Spain Carbonated Drinks Market Volume (liter ) Forecast, by Application 2019 & 2032
- Table 97: Russia Carbonated Drinks Market Revenue (Million) Forecast, by Application 2019 & 2032
- Table 98: Russia Carbonated Drinks Market Volume (liter ) Forecast, by Application 2019 & 2032
- Table 99: Benelux Carbonated Drinks Market Revenue (Million) Forecast, by Application 2019 & 2032
- Table 100: Benelux Carbonated Drinks Market Volume (liter ) Forecast, by Application 2019 & 2032
- Table 101: Nordics Carbonated Drinks Market Revenue (Million) Forecast, by Application 2019 & 2032
- Table 102: Nordics Carbonated Drinks Market Volume (liter ) Forecast, by Application 2019 & 2032
- Table 103: Rest of Europe Carbonated Drinks Market Revenue (Million) Forecast, by Application 2019 & 2032
- Table 104: Rest of Europe Carbonated Drinks Market Volume (liter ) Forecast, by Application 2019 & 2032
- Table 105: Global Carbonated Drinks Market Revenue Million Forecast, by Soft Drink Type 2019 & 2032
- Table 106: Global Carbonated Drinks Market Volume liter Forecast, by Soft Drink Type 2019 & 2032
- Table 107: Global Carbonated Drinks Market Revenue Million Forecast, by Packaging Type 2019 & 2032
- Table 108: Global Carbonated Drinks Market Volume liter Forecast, by Packaging Type 2019 & 2032
- Table 109: Global Carbonated Drinks Market Revenue Million Forecast, by Distribution Channel 2019 & 2032
- Table 110: Global Carbonated Drinks Market Volume liter Forecast, by Distribution Channel 2019 & 2032
- Table 111: Global Carbonated Drinks Market Revenue Million Forecast, by Country 2019 & 2032
- Table 112: Global Carbonated Drinks Market Volume liter Forecast, by Country 2019 & 2032
- Table 113: Turkey Carbonated Drinks Market Revenue (Million) Forecast, by Application 2019 & 2032
- Table 114: Turkey Carbonated Drinks Market Volume (liter ) Forecast, by Application 2019 & 2032
- Table 115: Israel Carbonated Drinks Market Revenue (Million) Forecast, by Application 2019 & 2032
- Table 116: Israel Carbonated Drinks Market Volume (liter ) Forecast, by Application 2019 & 2032
- Table 117: GCC Carbonated Drinks Market Revenue (Million) Forecast, by Application 2019 & 2032
- Table 118: GCC Carbonated Drinks Market Volume (liter ) Forecast, by Application 2019 & 2032
- Table 119: North Africa Carbonated Drinks Market Revenue (Million) Forecast, by Application 2019 & 2032
- Table 120: North Africa Carbonated Drinks Market Volume (liter ) Forecast, by Application 2019 & 2032
- Table 121: South Africa Carbonated Drinks Market Revenue (Million) Forecast, by Application 2019 & 2032
- Table 122: South Africa Carbonated Drinks Market Volume (liter ) Forecast, by Application 2019 & 2032
- Table 123: Rest of Middle East & Africa Carbonated Drinks Market Revenue (Million) Forecast, by Application 2019 & 2032
- Table 124: Rest of Middle East & Africa Carbonated Drinks Market Volume (liter ) Forecast, by Application 2019 & 2032
- Table 125: Global Carbonated Drinks Market Revenue Million Forecast, by Soft Drink Type 2019 & 2032
- Table 126: Global Carbonated Drinks Market Volume liter Forecast, by Soft Drink Type 2019 & 2032
- Table 127: Global Carbonated Drinks Market Revenue Million Forecast, by Packaging Type 2019 & 2032
- Table 128: Global Carbonated Drinks Market Volume liter Forecast, by Packaging Type 2019 & 2032
- Table 129: Global Carbonated Drinks Market Revenue Million Forecast, by Distribution Channel 2019 & 2032
- Table 130: Global Carbonated Drinks Market Volume liter Forecast, by Distribution Channel 2019 & 2032
- Table 131: Global Carbonated Drinks Market Revenue Million Forecast, by Country 2019 & 2032
- Table 132: Global Carbonated Drinks Market Volume liter Forecast, by Country 2019 & 2032
- Table 133: China Carbonated Drinks Market Revenue (Million) Forecast, by Application 2019 & 2032
- Table 134: China Carbonated Drinks Market Volume (liter ) Forecast, by Application 2019 & 2032
- Table 135: India Carbonated Drinks Market Revenue (Million) Forecast, by Application 2019 & 2032
- Table 136: India Carbonated Drinks Market Volume (liter ) Forecast, by Application 2019 & 2032
- Table 137: Japan Carbonated Drinks Market Revenue (Million) Forecast, by Application 2019 & 2032
- Table 138: Japan Carbonated Drinks Market Volume (liter ) Forecast, by Application 2019 & 2032
- Table 139: South Korea Carbonated Drinks Market Revenue (Million) Forecast, by Application 2019 & 2032
- Table 140: South Korea Carbonated Drinks Market Volume (liter ) Forecast, by Application 2019 & 2032
- Table 141: ASEAN Carbonated Drinks Market Revenue (Million) Forecast, by Application 2019 & 2032
- Table 142: ASEAN Carbonated Drinks Market Volume (liter ) Forecast, by Application 2019 & 2032
- Table 143: Oceania Carbonated Drinks Market Revenue (Million) Forecast, by Application 2019 & 2032
- Table 144: Oceania Carbonated Drinks Market Volume (liter ) Forecast, by Application 2019 & 2032
- Table 145: Rest of Asia Pacific Carbonated Drinks Market Revenue (Million) Forecast, by Application 2019 & 2032
- Table 146: Rest of Asia Pacific Carbonated Drinks Market Volume (liter ) Forecast, by Application 2019 & 2032
Frequently Asked Questions
1. What is the projected Compound Annual Growth Rate (CAGR) of the Carbonated Drinks Market?
The projected CAGR is approximately 4.76%.
2. Which companies are prominent players in the Carbonated Drinks Market?
Key companies in the market include Asahi Group Holdings Ltd, PepsiCo Inc, Nongfu Spring Co Ltd, Rauch Fruchtsäfte GmbH & Co OG, PT Anggada Putra Rekso Mulia, Suntory Holdings Limited, Keurig Dr Pepper Inc, National Beverage Corp, Refresco Group BV, The Coca-Cola Company, Hangzhou Wahaha Group Co Ltd, Kirin Holdings Company Limited, Britvic PLC, Tingyi (Cayman Islands) Holding Corporatio, Thai Beverages PCL.
3. What are the main segments of the Carbonated Drinks Market?
The market segments include Soft Drink Type, Packaging Type, Distribution Channel.
4. Can you provide details about the market size?
The market size is estimated to be USD 500260 Million as of 2022.
5. What are some drivers contributing to market growth?
Growing preference for low alcoholic beer by volume (abv) or non-alcoholic beers; Rising number of breweries leading to high prominence of craft beer.
6. What are the notable trends driving market growth?
OTHER KEY INDUSTRY TRENDS COVERED IN THE REPORT.
7. Are there any restraints impacting market growth?
Demand for other alcoholic beverages.
8. Can you provide examples of recent developments in the market?
December 2023: Kirin launched its Tokusei Ginger Ale Sour and sugar-free tea products, including black tea and Hojicha, in response to the growing demand for sugar-free beverages due to heightened health awareness in Japan. Kirin limited the availability of the Kirin Tokusei Ginger Ale Sour and sugar-free tea products to the local Japanese market as of 2023.October 2023: Coca-Cola launched Coca-Cola Y3000, the beverage is created with the help of artificial intelligence. Coca-Cola Y3000 is the latest limited-edition flavor to launch under its Coca-Cola Creations platform.January 2023: PepsiCo Inc. launched Starry, a tasting soda with a Lemon-Lime flavor. This drink is available in regular and zero-sugar versions.
9. What pricing options are available for accessing the report?
Pricing options include single-user, multi-user, and enterprise licenses priced at USD 3800, USD 4500, and USD 5800 respectively.
10. Is the market size provided in terms of value or volume?
The market size is provided in terms of value, measured in Million and volume, measured in liter .
11. Are there any specific market keywords associated with the report?
Yes, the market keyword associated with the report is "Carbonated Drinks Market," which aids in identifying and referencing the specific market segment covered.
12. How do I determine which pricing option suits my needs best?
The pricing options vary based on user requirements and access needs. Individual users may opt for single-user licenses, while businesses requiring broader access may choose multi-user or enterprise licenses for cost-effective access to the report.
13. Are there any additional resources or data provided in the Carbonated Drinks Market report?
While the report offers comprehensive insights, it's advisable to review the specific contents or supplementary materials provided to ascertain if additional resources or data are available.
14. How can I stay updated on further developments or reports in the Carbonated Drinks Market?
To stay informed about further developments, trends, and reports in the Carbonated Drinks Market, consider subscribing to industry newsletters, following relevant companies and organizations, or regularly checking reputable industry news sources and publications.
Methodology
Step 1 - Identification of Relevant Samples Size from Population Database


Step 2 - Approaches for Defining Global Market Size (Value, Volume* & Price*)

Note*: In applicable scenarios
Step 3 - Data Sources
Primary Research
- Web Analytics
- Survey Reports
- Research Institute
- Latest Research Reports
- Opinion Leaders
Secondary Research
- Annual Reports
- White Paper
- Latest Press Release
- Industry Association
- Paid Database
- Investor Presentations

Step 4 - Data Triangulation
Involves using different sources of information in order to increase the validity of a study
These sources are likely to be stakeholders in a program - participants, other researchers, program staff, other community members, and so on.
Then we put all data in single framework & apply various statistical tools to find out the dynamic on the market.
During the analysis stage, feedback from the stakeholder groups would be compared to determine areas of agreement as well as areas of divergence


