
Key Insights
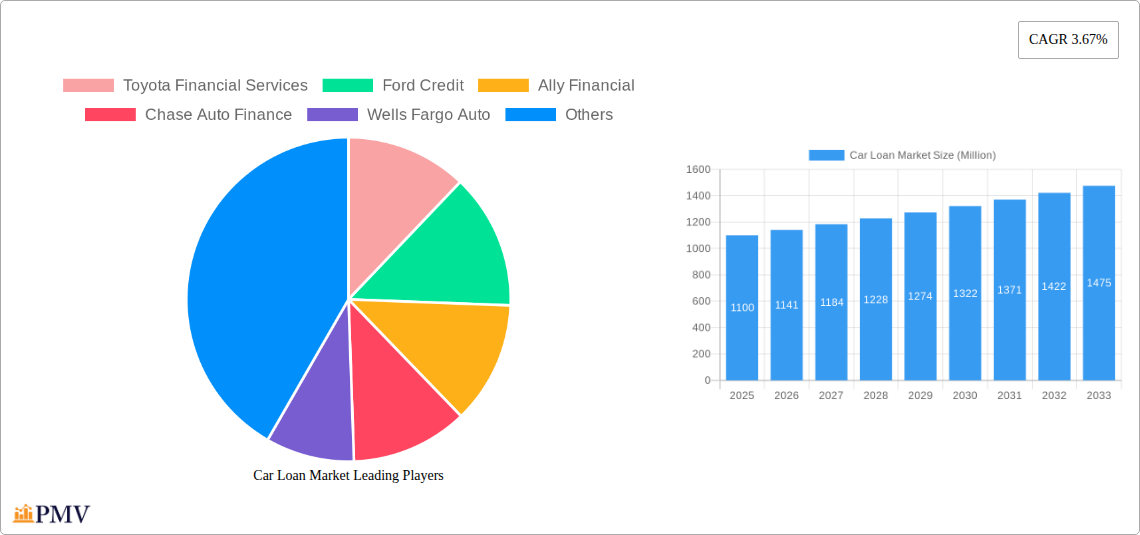
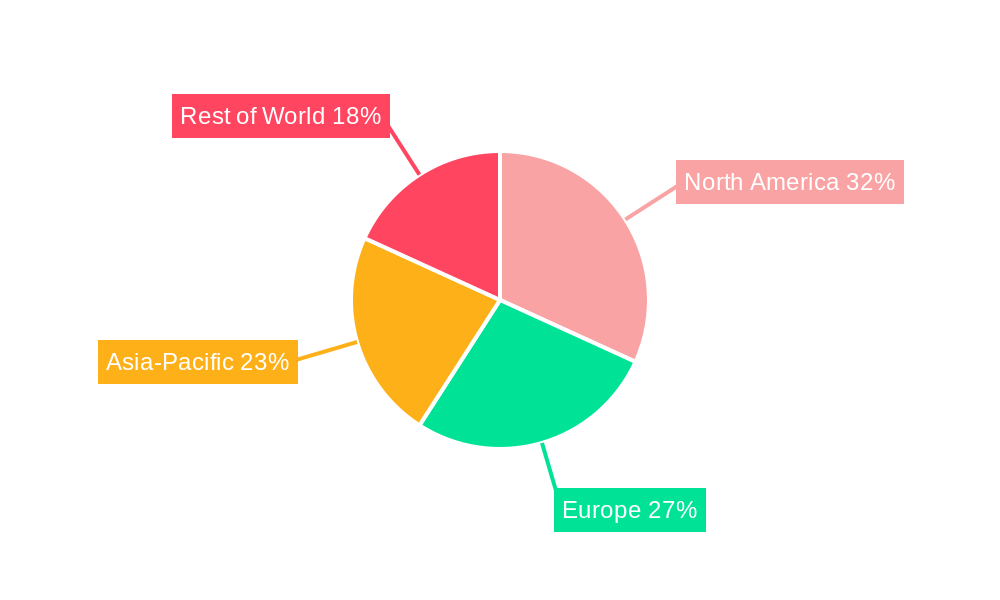
The global car loan market, valued at $1.10 trillion in 2025, is projected to experience steady growth, driven by several key factors. Rising vehicle sales, particularly in developing economies with expanding middle classes, fuel demand for financing options. Furthermore, the increasing availability of online lending platforms simplifies the borrowing process and broadens access to credit, contributing to market expansion. Favorable interest rates and competitive lending packages offered by both traditional banks (like Bank of America, Wells Fargo Auto, and Chase Auto Finance) and captive finance companies (such as Toyota Financial Services and Honda Financial Services) also stimulate market growth. However, economic downturns and fluctuating interest rates pose significant challenges. Stricter lending regulations aimed at mitigating risk and potential increases in default rates could act as restraints on market expansion. The market is segmented by loan type (new vs. used vehicles), loan term, and geographical region, with North America and Europe currently holding substantial market share. The competitive landscape features a mix of large financial institutions and captive finance arms of major auto manufacturers, constantly vying for market share through innovative product offerings and targeted marketing strategies.
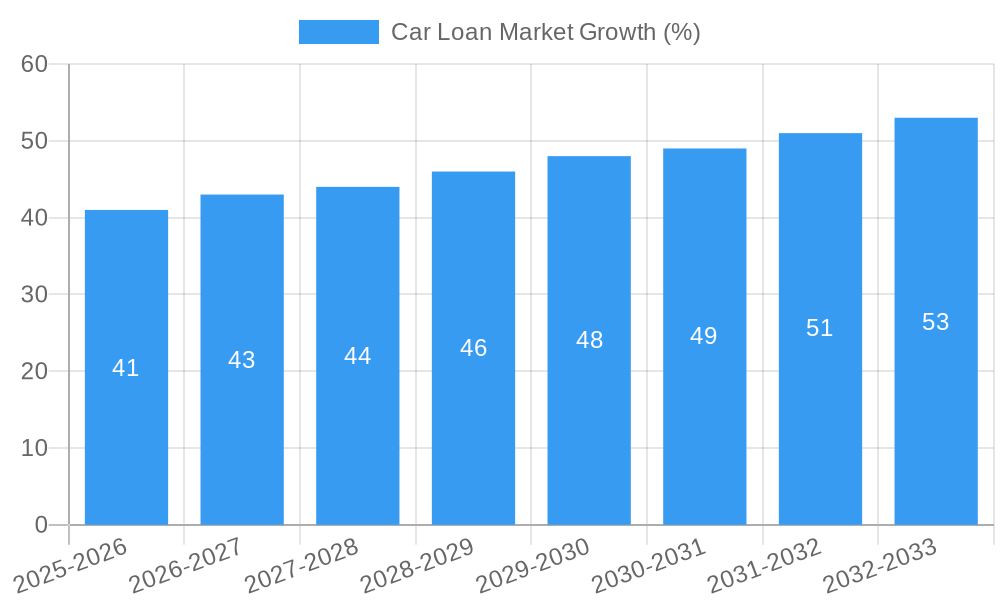
The projected Compound Annual Growth Rate (CAGR) of 3.67% from 2025 to 2033 indicates a consistent, albeit moderate, expansion of the market. This growth is expected to be somewhat uneven, influenced by macroeconomic conditions and regional economic performance. While regions like Asia-Pacific could exhibit higher growth due to increased vehicle sales, mature markets in North America and Europe might see more moderate growth rates. Technological advancements such as AI-powered credit scoring and digital loan applications continue to streamline operations and improve efficiency within the industry. However, the increasing adoption of electric vehicles (EVs) and alternative financing models specific to EVs presents both opportunities and challenges for traditional car loan providers as they adapt their products and services to meet evolving consumer demands.
Deep Dive into the Car Loan Market: A Comprehensive Report (2019-2033)
This comprehensive report provides an in-depth analysis of the global Car Loan Market, offering invaluable insights for industry stakeholders, investors, and strategic decision-makers. Covering the period from 2019 to 2033, with a base year of 2025 and a forecast period spanning 2025-2033, this report unveils the market's intricate dynamics, growth drivers, and future trajectory. The report incorporates detailed financial projections, reaching into the billions, and explores the competitive landscape dominated by key players such as Toyota Financial Services, Ford Credit, Ally Financial, Chase Auto Finance, Wells Fargo Auto, Bank of America, Capital One Auto Finance, Santander Consumer, BMW Financial Services, and Honda Financial Services (list not exhaustive).
Car Loan Market Market Structure & Competitive Dynamics
This section dissects the Car Loan Market's competitive structure, examining market concentration, innovation ecosystems, regulatory frameworks, product substitutes, end-user trends, and M&A activities. We analyze market share dynamics amongst key players, revealing the dominance of specific firms and the overall level of market fragmentation. The report also quantifies M&A activity within the sector, providing estimates of deal values in Millions. For instance, the acquisition of Volkswagen's Russian assets by Art-Finance LLC in May 2023 signifies a significant shift in the market's geopolitical landscape. Furthermore, we analyze the impact of regulatory changes on market access and competitive behavior. The evolving technological landscape, with the rise of fintech solutions, also influences the market structure and forces incumbent players to innovate and adapt. We estimate the market share of the top 5 players to be approximately 60% in 2025, with a projected decline to 55% by 2033 due to increased competition from fintech companies. The total M&A deal value in the sector during the historical period (2019-2024) is estimated at $XX Million.
- Market Concentration Analysis (2019-2033)
- Competitive Landscape Mapping (key player market share)
- Regulatory Framework Analysis
- M&A Activity Overview (deal values in Millions)
- Innovation Ecosystem Analysis
- Product Substitution Trends
Car Loan Market Industry Trends & Insights
This section delves into the overarching trends shaping the Car Loan Market, analyzing market growth drivers, technological disruptions, consumer preferences, and competitive dynamics from 2019 to 2033. We project a Compound Annual Growth Rate (CAGR) of XX% from 2025 to 2033, driven by factors such as rising vehicle sales, favorable lending conditions in specific regions, and increasing penetration of online lending platforms. The market penetration rate is estimated at XX% in 2025, projected to reach XX% by 2033. Technological advancements, like AI-driven credit scoring and automated loan processing, are revolutionizing the lending process, improving efficiency, and reducing costs. Shifting consumer preferences towards electric vehicles and subscription models also significantly influence market dynamics. The report also factors in the impact of macroeconomic conditions, such as interest rate fluctuations and consumer confidence, on loan demand.
Dominant Markets & Segments in Car Loan Market
This section identifies the leading regions, countries, and market segments within the Car Loan Market. We pinpoint the key drivers of dominance in each region, analyzing economic policies, infrastructure development, and consumer purchasing power. For example, the strong economic growth and favorable regulatory environment in [specific region] have fueled significant growth in the car loan market there, resulting in a market size of $XX Million in 2025. We provide a detailed analysis of market size and growth projections for each identified dominant market and segment.
- Key Drivers of Market Dominance:
- Economic Growth
- Infrastructure Development
- Government Policies and Regulations
- Consumer Preferences
- Detailed Dominance Analysis for leading regions and segments.
Car Loan Market Product Innovations
This section summarizes recent product developments, applications, and competitive advantages within the car loan market. The increasing adoption of digital lending platforms, mobile apps for loan applications and management, and the integration of AI and machine learning for risk assessment represent key technological trends. These innovations improve efficiency, enhance customer experience, and create competitive advantages for lenders. The market is witnessing a shift toward personalized loan offerings and flexible repayment options, further enhancing customer satisfaction.
Report Segmentation & Scope
This report segments the car loan market by various factors, providing detailed analysis and growth projections for each segment. These segments include, but are not limited to: loan type (new car loans, used car loans), vehicle type (passenger cars, commercial vehicles), loan term, interest rate, and borrower demographics (age, credit score). Each segment's market size, growth rate, and competitive landscape are thoroughly analyzed.
Key Drivers of Car Loan Market Growth
Several factors drive the growth of the Car Loan Market. These include increasing demand for personal vehicles, especially in developing economies; supportive government policies promoting vehicle ownership; attractive financing options offered by lenders, including low-interest rates and flexible repayment plans; and the increasing penetration of online lending platforms and fintech solutions, which enhance accessibility and convenience for borrowers. Technological advancements that improve efficiency, reduce processing time, and enhance risk assessment contribute significantly to market expansion.
Challenges in the Car Loan Market Sector
Despite the market's growth potential, several challenges impede progress. Stringent regulatory compliance requirements and changing lending policies present hurdles for lenders. Economic downturns and fluctuating interest rates negatively impact loan demand and lender profitability. Intense competition among established lenders and the emergence of new fintech players put pressure on profit margins. Moreover, the rising cost of vehicles and the increasing prevalence of non-performing loans (NPLs) pose significant challenges. The estimated impact of these challenges on market growth in 2025 is projected to be a reduction of XX% in the overall market value.
Leading Players in the Car Loan Market Market
- Toyota Financial Services
- Ford Credit
- Ally Financial
- Chase Auto Finance
- Wells Fargo Auto
- Bank of America
- Capital One Auto Finance
- Santander Consumer
- BMW Financial Services
- Honda Financial Services (List Not Exhaustive)
Key Developments in Car Loan Market Sector
- May 2023: Art-Finance LLC's acquisition of Volkswagen's Russian assets signifies a major shift in the global automotive landscape and influences the car loan market in Russia and potentially beyond.
- April 2022: The Faurecia and Mercedes-Benz partnership highlights the increasing integration of technology in the automotive sector, impacting the car loan market through innovative financing models linked to in-car services and applications.
Strategic Car Loan Market Market Outlook
The Car Loan Market exhibits substantial growth potential in the coming years, driven by continued expansion in emerging markets, technological innovations, and the evolving preferences of vehicle buyers. Strategic opportunities exist for lenders to leverage technological advancements to improve operational efficiency, enhance customer experience, and expand into new market segments. Furthermore, partnerships and collaborations between traditional lenders and fintech companies can unlock significant synergies and drive innovation. The report concludes with strategic recommendations for lenders seeking to capitalize on the market's growth potential and navigate the evolving competitive landscape.
Car Loan Market Segmentation
-
1. Product Type
- 1.1. Passenger Vehicle
- 1.2. Commercial Vehicle
-
2. Ownership
- 2.1. New Vehicles
- 2.2. Used Vehicles
-
3. Provider Type
- 3.1. Banks
- 3.2. Non-Banking Financial Services
- 3.3. Original Equipment Manufacturers
- 3.4. Other Provider Types (Fintech Companies)
-
4. Tenure
- 4.1. Less Than Three Years
- 4.2. 3-5 Years
- 4.3. More Than 5 Years
Car Loan Market Segmentation By Geography
-
1. North America
- 1.1. United States
- 1.2. Canada
- 1.3. Rest of North America
-
2. Europe
- 2.1. United Kingdom
- 2.2. Germany
- 2.3. Rest of Europe
-
3. Asia Pacific
- 3.1. China
- 3.2. South Korea
- 3.3. Rest of Asia Pacific
-
4. Latin America
- 4.1. Brazil
- 4.2. Chile
- 4.3. Rest of Latin America
- 5. Middle East and Africa
- 6. UAE
- 7. Saudi Arabia
- 8. Rest of Middle East and Africa
Car Loan Market REPORT HIGHLIGHTS
| Aspects | Details |
|---|---|
| Study Period | 2019-2033 |
| Base Year | 2024 |
| Estimated Year | 2025 |
| Forecast Period | 2025-2033 |
| Historical Period | 2019-2024 |
| Growth Rate | CAGR of 3.67% from 2019-2033 |
| Segmentation |
|
Table of Contents
- 1. Introduction
- 1.1. Research Scope
- 1.2. Market Segmentation
- 1.3. Research Methodology
- 1.4. Definitions and Assumptions
- 2. Executive Summary
- 2.1. Introduction
- 3. Market Dynamics
- 3.1. Introduction
- 3.2. Market Drivers
- 3.2.1. Rise in Demand for Luxury Cars Fueling the Market Growth
- 3.3. Market Restrains
- 3.3.1. Rise in Demand for Luxury Cars Fueling the Market Growth
- 3.4. Market Trends
- 3.4.1. Increasing Sales of Passenger Cars in Asia
- 4. Market Factor Analysis
- 4.1. Porters Five Forces
- 4.2. Supply/Value Chain
- 4.3. PESTEL analysis
- 4.4. Market Entropy
- 4.5. Patent/Trademark Analysis
- 5. Global Car Loan Market Analysis, Insights and Forecast, 2019-2031
- 5.1. Market Analysis, Insights and Forecast - by Product Type
- 5.1.1. Passenger Vehicle
- 5.1.2. Commercial Vehicle
- 5.2. Market Analysis, Insights and Forecast - by Ownership
- 5.2.1. New Vehicles
- 5.2.2. Used Vehicles
- 5.3. Market Analysis, Insights and Forecast - by Provider Type
- 5.3.1. Banks
- 5.3.2. Non-Banking Financial Services
- 5.3.3. Original Equipment Manufacturers
- 5.3.4. Other Provider Types (Fintech Companies)
- 5.4. Market Analysis, Insights and Forecast - by Tenure
- 5.4.1. Less Than Three Years
- 5.4.2. 3-5 Years
- 5.4.3. More Than 5 Years
- 5.5. Market Analysis, Insights and Forecast - by Region
- 5.5.1. North America
- 5.5.2. Europe
- 5.5.3. Asia Pacific
- 5.5.4. Latin America
- 5.5.5. Middle East and Africa
- 5.5.6. UAE
- 5.5.7. Saudi Arabia
- 5.5.8. Rest of Middle East and Africa
- 5.1. Market Analysis, Insights and Forecast - by Product Type
- 6. North America Car Loan Market Analysis, Insights and Forecast, 2019-2031
- 6.1. Market Analysis, Insights and Forecast - by Product Type
- 6.1.1. Passenger Vehicle
- 6.1.2. Commercial Vehicle
- 6.2. Market Analysis, Insights and Forecast - by Ownership
- 6.2.1. New Vehicles
- 6.2.2. Used Vehicles
- 6.3. Market Analysis, Insights and Forecast - by Provider Type
- 6.3.1. Banks
- 6.3.2. Non-Banking Financial Services
- 6.3.3. Original Equipment Manufacturers
- 6.3.4. Other Provider Types (Fintech Companies)
- 6.4. Market Analysis, Insights and Forecast - by Tenure
- 6.4.1. Less Than Three Years
- 6.4.2. 3-5 Years
- 6.4.3. More Than 5 Years
- 6.1. Market Analysis, Insights and Forecast - by Product Type
- 7. Europe Car Loan Market Analysis, Insights and Forecast, 2019-2031
- 7.1. Market Analysis, Insights and Forecast - by Product Type
- 7.1.1. Passenger Vehicle
- 7.1.2. Commercial Vehicle
- 7.2. Market Analysis, Insights and Forecast - by Ownership
- 7.2.1. New Vehicles
- 7.2.2. Used Vehicles
- 7.3. Market Analysis, Insights and Forecast - by Provider Type
- 7.3.1. Banks
- 7.3.2. Non-Banking Financial Services
- 7.3.3. Original Equipment Manufacturers
- 7.3.4. Other Provider Types (Fintech Companies)
- 7.4. Market Analysis, Insights and Forecast - by Tenure
- 7.4.1. Less Than Three Years
- 7.4.2. 3-5 Years
- 7.4.3. More Than 5 Years
- 7.1. Market Analysis, Insights and Forecast - by Product Type
- 8. Asia Pacific Car Loan Market Analysis, Insights and Forecast, 2019-2031
- 8.1. Market Analysis, Insights and Forecast - by Product Type
- 8.1.1. Passenger Vehicle
- 8.1.2. Commercial Vehicle
- 8.2. Market Analysis, Insights and Forecast - by Ownership
- 8.2.1. New Vehicles
- 8.2.2. Used Vehicles
- 8.3. Market Analysis, Insights and Forecast - by Provider Type
- 8.3.1. Banks
- 8.3.2. Non-Banking Financial Services
- 8.3.3. Original Equipment Manufacturers
- 8.3.4. Other Provider Types (Fintech Companies)
- 8.4. Market Analysis, Insights and Forecast - by Tenure
- 8.4.1. Less Than Three Years
- 8.4.2. 3-5 Years
- 8.4.3. More Than 5 Years
- 8.1. Market Analysis, Insights and Forecast - by Product Type
- 9. Latin America Car Loan Market Analysis, Insights and Forecast, 2019-2031
- 9.1. Market Analysis, Insights and Forecast - by Product Type
- 9.1.1. Passenger Vehicle
- 9.1.2. Commercial Vehicle
- 9.2. Market Analysis, Insights and Forecast - by Ownership
- 9.2.1. New Vehicles
- 9.2.2. Used Vehicles
- 9.3. Market Analysis, Insights and Forecast - by Provider Type
- 9.3.1. Banks
- 9.3.2. Non-Banking Financial Services
- 9.3.3. Original Equipment Manufacturers
- 9.3.4. Other Provider Types (Fintech Companies)
- 9.4. Market Analysis, Insights and Forecast - by Tenure
- 9.4.1. Less Than Three Years
- 9.4.2. 3-5 Years
- 9.4.3. More Than 5 Years
- 9.1. Market Analysis, Insights and Forecast - by Product Type
- 10. Middle East and Africa Car Loan Market Analysis, Insights and Forecast, 2019-2031
- 10.1. Market Analysis, Insights and Forecast - by Product Type
- 10.1.1. Passenger Vehicle
- 10.1.2. Commercial Vehicle
- 10.2. Market Analysis, Insights and Forecast - by Ownership
- 10.2.1. New Vehicles
- 10.2.2. Used Vehicles
- 10.3. Market Analysis, Insights and Forecast - by Provider Type
- 10.3.1. Banks
- 10.3.2. Non-Banking Financial Services
- 10.3.3. Original Equipment Manufacturers
- 10.3.4. Other Provider Types (Fintech Companies)
- 10.4. Market Analysis, Insights and Forecast - by Tenure
- 10.4.1. Less Than Three Years
- 10.4.2. 3-5 Years
- 10.4.3. More Than 5 Years
- 10.1. Market Analysis, Insights and Forecast - by Product Type
- 11. UAE Car Loan Market Analysis, Insights and Forecast, 2019-2031
- 11.1. Market Analysis, Insights and Forecast - by Product Type
- 11.1.1. Passenger Vehicle
- 11.1.2. Commercial Vehicle
- 11.2. Market Analysis, Insights and Forecast - by Ownership
- 11.2.1. New Vehicles
- 11.2.2. Used Vehicles
- 11.3. Market Analysis, Insights and Forecast - by Provider Type
- 11.3.1. Banks
- 11.3.2. Non-Banking Financial Services
- 11.3.3. Original Equipment Manufacturers
- 11.3.4. Other Provider Types (Fintech Companies)
- 11.4. Market Analysis, Insights and Forecast - by Tenure
- 11.4.1. Less Than Three Years
- 11.4.2. 3-5 Years
- 11.4.3. More Than 5 Years
- 11.1. Market Analysis, Insights and Forecast - by Product Type
- 12. Saudi Arabia Car Loan Market Analysis, Insights and Forecast, 2019-2031
- 12.1. Market Analysis, Insights and Forecast - by Product Type
- 12.1.1. Passenger Vehicle
- 12.1.2. Commercial Vehicle
- 12.2. Market Analysis, Insights and Forecast - by Ownership
- 12.2.1. New Vehicles
- 12.2.2. Used Vehicles
- 12.3. Market Analysis, Insights and Forecast - by Provider Type
- 12.3.1. Banks
- 12.3.2. Non-Banking Financial Services
- 12.3.3. Original Equipment Manufacturers
- 12.3.4. Other Provider Types (Fintech Companies)
- 12.4. Market Analysis, Insights and Forecast - by Tenure
- 12.4.1. Less Than Three Years
- 12.4.2. 3-5 Years
- 12.4.3. More Than 5 Years
- 12.1. Market Analysis, Insights and Forecast - by Product Type
- 13. Rest of Middle East and Africa Car Loan Market Analysis, Insights and Forecast, 2019-2031
- 13.1. Market Analysis, Insights and Forecast - by Product Type
- 13.1.1. Passenger Vehicle
- 13.1.2. Commercial Vehicle
- 13.2. Market Analysis, Insights and Forecast - by Ownership
- 13.2.1. New Vehicles
- 13.2.2. Used Vehicles
- 13.3. Market Analysis, Insights and Forecast - by Provider Type
- 13.3.1. Banks
- 13.3.2. Non-Banking Financial Services
- 13.3.3. Original Equipment Manufacturers
- 13.3.4. Other Provider Types (Fintech Companies)
- 13.4. Market Analysis, Insights and Forecast - by Tenure
- 13.4.1. Less Than Three Years
- 13.4.2. 3-5 Years
- 13.4.3. More Than 5 Years
- 13.1. Market Analysis, Insights and Forecast - by Product Type
- 14. Competitive Analysis
- 14.1. Global Market Share Analysis 2024
- 14.2. Company Profiles
- 14.2.1 Toyota Financial Services
- 14.2.1.1. Overview
- 14.2.1.2. Products
- 14.2.1.3. SWOT Analysis
- 14.2.1.4. Recent Developments
- 14.2.1.5. Financials (Based on Availability)
- 14.2.2 Ford Credit
- 14.2.2.1. Overview
- 14.2.2.2. Products
- 14.2.2.3. SWOT Analysis
- 14.2.2.4. Recent Developments
- 14.2.2.5. Financials (Based on Availability)
- 14.2.3 Ally Financial
- 14.2.3.1. Overview
- 14.2.3.2. Products
- 14.2.3.3. SWOT Analysis
- 14.2.3.4. Recent Developments
- 14.2.3.5. Financials (Based on Availability)
- 14.2.4 Chase Auto Finance
- 14.2.4.1. Overview
- 14.2.4.2. Products
- 14.2.4.3. SWOT Analysis
- 14.2.4.4. Recent Developments
- 14.2.4.5. Financials (Based on Availability)
- 14.2.5 Wells Fargo Auto
- 14.2.5.1. Overview
- 14.2.5.2. Products
- 14.2.5.3. SWOT Analysis
- 14.2.5.4. Recent Developments
- 14.2.5.5. Financials (Based on Availability)
- 14.2.6 Bank of America
- 14.2.6.1. Overview
- 14.2.6.2. Products
- 14.2.6.3. SWOT Analysis
- 14.2.6.4. Recent Developments
- 14.2.6.5. Financials (Based on Availability)
- 14.2.7 Capital One Auto Finance
- 14.2.7.1. Overview
- 14.2.7.2. Products
- 14.2.7.3. SWOT Analysis
- 14.2.7.4. Recent Developments
- 14.2.7.5. Financials (Based on Availability)
- 14.2.8 Santander Consumer
- 14.2.8.1. Overview
- 14.2.8.2. Products
- 14.2.8.3. SWOT Analysis
- 14.2.8.4. Recent Developments
- 14.2.8.5. Financials (Based on Availability)
- 14.2.9 BMW Financial Services
- 14.2.9.1. Overview
- 14.2.9.2. Products
- 14.2.9.3. SWOT Analysis
- 14.2.9.4. Recent Developments
- 14.2.9.5. Financials (Based on Availability)
- 14.2.10 Honda Financial Services**List Not Exhaustive
- 14.2.10.1. Overview
- 14.2.10.2. Products
- 14.2.10.3. SWOT Analysis
- 14.2.10.4. Recent Developments
- 14.2.10.5. Financials (Based on Availability)
- 14.2.1 Toyota Financial Services
List of Figures
- Figure 1: Global Car Loan Market Revenue Breakdown (Million, %) by Region 2024 & 2032
- Figure 2: Global Car Loan Market Volume Breakdown (Trillion, %) by Region 2024 & 2032
- Figure 3: North America Car Loan Market Revenue (Million), by Product Type 2024 & 2032
- Figure 4: North America Car Loan Market Volume (Trillion), by Product Type 2024 & 2032
- Figure 5: North America Car Loan Market Revenue Share (%), by Product Type 2024 & 2032
- Figure 6: North America Car Loan Market Volume Share (%), by Product Type 2024 & 2032
- Figure 7: North America Car Loan Market Revenue (Million), by Ownership 2024 & 2032
- Figure 8: North America Car Loan Market Volume (Trillion), by Ownership 2024 & 2032
- Figure 9: North America Car Loan Market Revenue Share (%), by Ownership 2024 & 2032
- Figure 10: North America Car Loan Market Volume Share (%), by Ownership 2024 & 2032
- Figure 11: North America Car Loan Market Revenue (Million), by Provider Type 2024 & 2032
- Figure 12: North America Car Loan Market Volume (Trillion), by Provider Type 2024 & 2032
- Figure 13: North America Car Loan Market Revenue Share (%), by Provider Type 2024 & 2032
- Figure 14: North America Car Loan Market Volume Share (%), by Provider Type 2024 & 2032
- Figure 15: North America Car Loan Market Revenue (Million), by Tenure 2024 & 2032
- Figure 16: North America Car Loan Market Volume (Trillion), by Tenure 2024 & 2032
- Figure 17: North America Car Loan Market Revenue Share (%), by Tenure 2024 & 2032
- Figure 18: North America Car Loan Market Volume Share (%), by Tenure 2024 & 2032
- Figure 19: North America Car Loan Market Revenue (Million), by Country 2024 & 2032
- Figure 20: North America Car Loan Market Volume (Trillion), by Country 2024 & 2032
- Figure 21: North America Car Loan Market Revenue Share (%), by Country 2024 & 2032
- Figure 22: North America Car Loan Market Volume Share (%), by Country 2024 & 2032
- Figure 23: Europe Car Loan Market Revenue (Million), by Product Type 2024 & 2032
- Figure 24: Europe Car Loan Market Volume (Trillion), by Product Type 2024 & 2032
- Figure 25: Europe Car Loan Market Revenue Share (%), by Product Type 2024 & 2032
- Figure 26: Europe Car Loan Market Volume Share (%), by Product Type 2024 & 2032
- Figure 27: Europe Car Loan Market Revenue (Million), by Ownership 2024 & 2032
- Figure 28: Europe Car Loan Market Volume (Trillion), by Ownership 2024 & 2032
- Figure 29: Europe Car Loan Market Revenue Share (%), by Ownership 2024 & 2032
- Figure 30: Europe Car Loan Market Volume Share (%), by Ownership 2024 & 2032
- Figure 31: Europe Car Loan Market Revenue (Million), by Provider Type 2024 & 2032
- Figure 32: Europe Car Loan Market Volume (Trillion), by Provider Type 2024 & 2032
- Figure 33: Europe Car Loan Market Revenue Share (%), by Provider Type 2024 & 2032
- Figure 34: Europe Car Loan Market Volume Share (%), by Provider Type 2024 & 2032
- Figure 35: Europe Car Loan Market Revenue (Million), by Tenure 2024 & 2032
- Figure 36: Europe Car Loan Market Volume (Trillion), by Tenure 2024 & 2032
- Figure 37: Europe Car Loan Market Revenue Share (%), by Tenure 2024 & 2032
- Figure 38: Europe Car Loan Market Volume Share (%), by Tenure 2024 & 2032
- Figure 39: Europe Car Loan Market Revenue (Million), by Country 2024 & 2032
- Figure 40: Europe Car Loan Market Volume (Trillion), by Country 2024 & 2032
- Figure 41: Europe Car Loan Market Revenue Share (%), by Country 2024 & 2032
- Figure 42: Europe Car Loan Market Volume Share (%), by Country 2024 & 2032
- Figure 43: Asia Pacific Car Loan Market Revenue (Million), by Product Type 2024 & 2032
- Figure 44: Asia Pacific Car Loan Market Volume (Trillion), by Product Type 2024 & 2032
- Figure 45: Asia Pacific Car Loan Market Revenue Share (%), by Product Type 2024 & 2032
- Figure 46: Asia Pacific Car Loan Market Volume Share (%), by Product Type 2024 & 2032
- Figure 47: Asia Pacific Car Loan Market Revenue (Million), by Ownership 2024 & 2032
- Figure 48: Asia Pacific Car Loan Market Volume (Trillion), by Ownership 2024 & 2032
- Figure 49: Asia Pacific Car Loan Market Revenue Share (%), by Ownership 2024 & 2032
- Figure 50: Asia Pacific Car Loan Market Volume Share (%), by Ownership 2024 & 2032
- Figure 51: Asia Pacific Car Loan Market Revenue (Million), by Provider Type 2024 & 2032
- Figure 52: Asia Pacific Car Loan Market Volume (Trillion), by Provider Type 2024 & 2032
- Figure 53: Asia Pacific Car Loan Market Revenue Share (%), by Provider Type 2024 & 2032
- Figure 54: Asia Pacific Car Loan Market Volume Share (%), by Provider Type 2024 & 2032
- Figure 55: Asia Pacific Car Loan Market Revenue (Million), by Tenure 2024 & 2032
- Figure 56: Asia Pacific Car Loan Market Volume (Trillion), by Tenure 2024 & 2032
- Figure 57: Asia Pacific Car Loan Market Revenue Share (%), by Tenure 2024 & 2032
- Figure 58: Asia Pacific Car Loan Market Volume Share (%), by Tenure 2024 & 2032
- Figure 59: Asia Pacific Car Loan Market Revenue (Million), by Country 2024 & 2032
- Figure 60: Asia Pacific Car Loan Market Volume (Trillion), by Country 2024 & 2032
- Figure 61: Asia Pacific Car Loan Market Revenue Share (%), by Country 2024 & 2032
- Figure 62: Asia Pacific Car Loan Market Volume Share (%), by Country 2024 & 2032
- Figure 63: Latin America Car Loan Market Revenue (Million), by Product Type 2024 & 2032
- Figure 64: Latin America Car Loan Market Volume (Trillion), by Product Type 2024 & 2032
- Figure 65: Latin America Car Loan Market Revenue Share (%), by Product Type 2024 & 2032
- Figure 66: Latin America Car Loan Market Volume Share (%), by Product Type 2024 & 2032
- Figure 67: Latin America Car Loan Market Revenue (Million), by Ownership 2024 & 2032
- Figure 68: Latin America Car Loan Market Volume (Trillion), by Ownership 2024 & 2032
- Figure 69: Latin America Car Loan Market Revenue Share (%), by Ownership 2024 & 2032
- Figure 70: Latin America Car Loan Market Volume Share (%), by Ownership 2024 & 2032
- Figure 71: Latin America Car Loan Market Revenue (Million), by Provider Type 2024 & 2032
- Figure 72: Latin America Car Loan Market Volume (Trillion), by Provider Type 2024 & 2032
- Figure 73: Latin America Car Loan Market Revenue Share (%), by Provider Type 2024 & 2032
- Figure 74: Latin America Car Loan Market Volume Share (%), by Provider Type 2024 & 2032
- Figure 75: Latin America Car Loan Market Revenue (Million), by Tenure 2024 & 2032
- Figure 76: Latin America Car Loan Market Volume (Trillion), by Tenure 2024 & 2032
- Figure 77: Latin America Car Loan Market Revenue Share (%), by Tenure 2024 & 2032
- Figure 78: Latin America Car Loan Market Volume Share (%), by Tenure 2024 & 2032
- Figure 79: Latin America Car Loan Market Revenue (Million), by Country 2024 & 2032
- Figure 80: Latin America Car Loan Market Volume (Trillion), by Country 2024 & 2032
- Figure 81: Latin America Car Loan Market Revenue Share (%), by Country 2024 & 2032
- Figure 82: Latin America Car Loan Market Volume Share (%), by Country 2024 & 2032
- Figure 83: Middle East and Africa Car Loan Market Revenue (Million), by Product Type 2024 & 2032
- Figure 84: Middle East and Africa Car Loan Market Volume (Trillion), by Product Type 2024 & 2032
- Figure 85: Middle East and Africa Car Loan Market Revenue Share (%), by Product Type 2024 & 2032
- Figure 86: Middle East and Africa Car Loan Market Volume Share (%), by Product Type 2024 & 2032
- Figure 87: Middle East and Africa Car Loan Market Revenue (Million), by Ownership 2024 & 2032
- Figure 88: Middle East and Africa Car Loan Market Volume (Trillion), by Ownership 2024 & 2032
- Figure 89: Middle East and Africa Car Loan Market Revenue Share (%), by Ownership 2024 & 2032
- Figure 90: Middle East and Africa Car Loan Market Volume Share (%), by Ownership 2024 & 2032
- Figure 91: Middle East and Africa Car Loan Market Revenue (Million), by Provider Type 2024 & 2032
- Figure 92: Middle East and Africa Car Loan Market Volume (Trillion), by Provider Type 2024 & 2032
- Figure 93: Middle East and Africa Car Loan Market Revenue Share (%), by Provider Type 2024 & 2032
- Figure 94: Middle East and Africa Car Loan Market Volume Share (%), by Provider Type 2024 & 2032
- Figure 95: Middle East and Africa Car Loan Market Revenue (Million), by Tenure 2024 & 2032
- Figure 96: Middle East and Africa Car Loan Market Volume (Trillion), by Tenure 2024 & 2032
- Figure 97: Middle East and Africa Car Loan Market Revenue Share (%), by Tenure 2024 & 2032
- Figure 98: Middle East and Africa Car Loan Market Volume Share (%), by Tenure 2024 & 2032
- Figure 99: Middle East and Africa Car Loan Market Revenue (Million), by Country 2024 & 2032
- Figure 100: Middle East and Africa Car Loan Market Volume (Trillion), by Country 2024 & 2032
- Figure 101: Middle East and Africa Car Loan Market Revenue Share (%), by Country 2024 & 2032
- Figure 102: Middle East and Africa Car Loan Market Volume Share (%), by Country 2024 & 2032
- Figure 103: UAE Car Loan Market Revenue (Million), by Product Type 2024 & 2032
- Figure 104: UAE Car Loan Market Volume (Trillion), by Product Type 2024 & 2032
- Figure 105: UAE Car Loan Market Revenue Share (%), by Product Type 2024 & 2032
- Figure 106: UAE Car Loan Market Volume Share (%), by Product Type 2024 & 2032
- Figure 107: UAE Car Loan Market Revenue (Million), by Ownership 2024 & 2032
- Figure 108: UAE Car Loan Market Volume (Trillion), by Ownership 2024 & 2032
- Figure 109: UAE Car Loan Market Revenue Share (%), by Ownership 2024 & 2032
- Figure 110: UAE Car Loan Market Volume Share (%), by Ownership 2024 & 2032
- Figure 111: UAE Car Loan Market Revenue (Million), by Provider Type 2024 & 2032
- Figure 112: UAE Car Loan Market Volume (Trillion), by Provider Type 2024 & 2032
- Figure 113: UAE Car Loan Market Revenue Share (%), by Provider Type 2024 & 2032
- Figure 114: UAE Car Loan Market Volume Share (%), by Provider Type 2024 & 2032
- Figure 115: UAE Car Loan Market Revenue (Million), by Tenure 2024 & 2032
- Figure 116: UAE Car Loan Market Volume (Trillion), by Tenure 2024 & 2032
- Figure 117: UAE Car Loan Market Revenue Share (%), by Tenure 2024 & 2032
- Figure 118: UAE Car Loan Market Volume Share (%), by Tenure 2024 & 2032
- Figure 119: UAE Car Loan Market Revenue (Million), by Country 2024 & 2032
- Figure 120: UAE Car Loan Market Volume (Trillion), by Country 2024 & 2032
- Figure 121: UAE Car Loan Market Revenue Share (%), by Country 2024 & 2032
- Figure 122: UAE Car Loan Market Volume Share (%), by Country 2024 & 2032
- Figure 123: Saudi Arabia Car Loan Market Revenue (Million), by Product Type 2024 & 2032
- Figure 124: Saudi Arabia Car Loan Market Volume (Trillion), by Product Type 2024 & 2032
- Figure 125: Saudi Arabia Car Loan Market Revenue Share (%), by Product Type 2024 & 2032
- Figure 126: Saudi Arabia Car Loan Market Volume Share (%), by Product Type 2024 & 2032
- Figure 127: Saudi Arabia Car Loan Market Revenue (Million), by Ownership 2024 & 2032
- Figure 128: Saudi Arabia Car Loan Market Volume (Trillion), by Ownership 2024 & 2032
- Figure 129: Saudi Arabia Car Loan Market Revenue Share (%), by Ownership 2024 & 2032
- Figure 130: Saudi Arabia Car Loan Market Volume Share (%), by Ownership 2024 & 2032
- Figure 131: Saudi Arabia Car Loan Market Revenue (Million), by Provider Type 2024 & 2032
- Figure 132: Saudi Arabia Car Loan Market Volume (Trillion), by Provider Type 2024 & 2032
- Figure 133: Saudi Arabia Car Loan Market Revenue Share (%), by Provider Type 2024 & 2032
- Figure 134: Saudi Arabia Car Loan Market Volume Share (%), by Provider Type 2024 & 2032
- Figure 135: Saudi Arabia Car Loan Market Revenue (Million), by Tenure 2024 & 2032
- Figure 136: Saudi Arabia Car Loan Market Volume (Trillion), by Tenure 2024 & 2032
- Figure 137: Saudi Arabia Car Loan Market Revenue Share (%), by Tenure 2024 & 2032
- Figure 138: Saudi Arabia Car Loan Market Volume Share (%), by Tenure 2024 & 2032
- Figure 139: Saudi Arabia Car Loan Market Revenue (Million), by Country 2024 & 2032
- Figure 140: Saudi Arabia Car Loan Market Volume (Trillion), by Country 2024 & 2032
- Figure 141: Saudi Arabia Car Loan Market Revenue Share (%), by Country 2024 & 2032
- Figure 142: Saudi Arabia Car Loan Market Volume Share (%), by Country 2024 & 2032
- Figure 143: Rest of Middle East and Africa Car Loan Market Revenue (Million), by Product Type 2024 & 2032
- Figure 144: Rest of Middle East and Africa Car Loan Market Volume (Trillion), by Product Type 2024 & 2032
- Figure 145: Rest of Middle East and Africa Car Loan Market Revenue Share (%), by Product Type 2024 & 2032
- Figure 146: Rest of Middle East and Africa Car Loan Market Volume Share (%), by Product Type 2024 & 2032
- Figure 147: Rest of Middle East and Africa Car Loan Market Revenue (Million), by Ownership 2024 & 2032
- Figure 148: Rest of Middle East and Africa Car Loan Market Volume (Trillion), by Ownership 2024 & 2032
- Figure 149: Rest of Middle East and Africa Car Loan Market Revenue Share (%), by Ownership 2024 & 2032
- Figure 150: Rest of Middle East and Africa Car Loan Market Volume Share (%), by Ownership 2024 & 2032
- Figure 151: Rest of Middle East and Africa Car Loan Market Revenue (Million), by Provider Type 2024 & 2032
- Figure 152: Rest of Middle East and Africa Car Loan Market Volume (Trillion), by Provider Type 2024 & 2032
- Figure 153: Rest of Middle East and Africa Car Loan Market Revenue Share (%), by Provider Type 2024 & 2032
- Figure 154: Rest of Middle East and Africa Car Loan Market Volume Share (%), by Provider Type 2024 & 2032
- Figure 155: Rest of Middle East and Africa Car Loan Market Revenue (Million), by Tenure 2024 & 2032
- Figure 156: Rest of Middle East and Africa Car Loan Market Volume (Trillion), by Tenure 2024 & 2032
- Figure 157: Rest of Middle East and Africa Car Loan Market Revenue Share (%), by Tenure 2024 & 2032
- Figure 158: Rest of Middle East and Africa Car Loan Market Volume Share (%), by Tenure 2024 & 2032
- Figure 159: Rest of Middle East and Africa Car Loan Market Revenue (Million), by Country 2024 & 2032
- Figure 160: Rest of Middle East and Africa Car Loan Market Volume (Trillion), by Country 2024 & 2032
- Figure 161: Rest of Middle East and Africa Car Loan Market Revenue Share (%), by Country 2024 & 2032
- Figure 162: Rest of Middle East and Africa Car Loan Market Volume Share (%), by Country 2024 & 2032
List of Tables
- Table 1: Global Car Loan Market Revenue Million Forecast, by Region 2019 & 2032
- Table 2: Global Car Loan Market Volume Trillion Forecast, by Region 2019 & 2032
- Table 3: Global Car Loan Market Revenue Million Forecast, by Product Type 2019 & 2032
- Table 4: Global Car Loan Market Volume Trillion Forecast, by Product Type 2019 & 2032
- Table 5: Global Car Loan Market Revenue Million Forecast, by Ownership 2019 & 2032
- Table 6: Global Car Loan Market Volume Trillion Forecast, by Ownership 2019 & 2032
- Table 7: Global Car Loan Market Revenue Million Forecast, by Provider Type 2019 & 2032
- Table 8: Global Car Loan Market Volume Trillion Forecast, by Provider Type 2019 & 2032
- Table 9: Global Car Loan Market Revenue Million Forecast, by Tenure 2019 & 2032
- Table 10: Global Car Loan Market Volume Trillion Forecast, by Tenure 2019 & 2032
- Table 11: Global Car Loan Market Revenue Million Forecast, by Region 2019 & 2032
- Table 12: Global Car Loan Market Volume Trillion Forecast, by Region 2019 & 2032
- Table 13: Global Car Loan Market Revenue Million Forecast, by Product Type 2019 & 2032
- Table 14: Global Car Loan Market Volume Trillion Forecast, by Product Type 2019 & 2032
- Table 15: Global Car Loan Market Revenue Million Forecast, by Ownership 2019 & 2032
- Table 16: Global Car Loan Market Volume Trillion Forecast, by Ownership 2019 & 2032
- Table 17: Global Car Loan Market Revenue Million Forecast, by Provider Type 2019 & 2032
- Table 18: Global Car Loan Market Volume Trillion Forecast, by Provider Type 2019 & 2032
- Table 19: Global Car Loan Market Revenue Million Forecast, by Tenure 2019 & 2032
- Table 20: Global Car Loan Market Volume Trillion Forecast, by Tenure 2019 & 2032
- Table 21: Global Car Loan Market Revenue Million Forecast, by Country 2019 & 2032
- Table 22: Global Car Loan Market Volume Trillion Forecast, by Country 2019 & 2032
- Table 23: United States Car Loan Market Revenue (Million) Forecast, by Application 2019 & 2032
- Table 24: United States Car Loan Market Volume (Trillion) Forecast, by Application 2019 & 2032
- Table 25: Canada Car Loan Market Revenue (Million) Forecast, by Application 2019 & 2032
- Table 26: Canada Car Loan Market Volume (Trillion) Forecast, by Application 2019 & 2032
- Table 27: Rest of North America Car Loan Market Revenue (Million) Forecast, by Application 2019 & 2032
- Table 28: Rest of North America Car Loan Market Volume (Trillion) Forecast, by Application 2019 & 2032
- Table 29: Global Car Loan Market Revenue Million Forecast, by Product Type 2019 & 2032
- Table 30: Global Car Loan Market Volume Trillion Forecast, by Product Type 2019 & 2032
- Table 31: Global Car Loan Market Revenue Million Forecast, by Ownership 2019 & 2032
- Table 32: Global Car Loan Market Volume Trillion Forecast, by Ownership 2019 & 2032
- Table 33: Global Car Loan Market Revenue Million Forecast, by Provider Type 2019 & 2032
- Table 34: Global Car Loan Market Volume Trillion Forecast, by Provider Type 2019 & 2032
- Table 35: Global Car Loan Market Revenue Million Forecast, by Tenure 2019 & 2032
- Table 36: Global Car Loan Market Volume Trillion Forecast, by Tenure 2019 & 2032
- Table 37: Global Car Loan Market Revenue Million Forecast, by Country 2019 & 2032
- Table 38: Global Car Loan Market Volume Trillion Forecast, by Country 2019 & 2032
- Table 39: United Kingdom Car Loan Market Revenue (Million) Forecast, by Application 2019 & 2032
- Table 40: United Kingdom Car Loan Market Volume (Trillion) Forecast, by Application 2019 & 2032
- Table 41: Germany Car Loan Market Revenue (Million) Forecast, by Application 2019 & 2032
- Table 42: Germany Car Loan Market Volume (Trillion) Forecast, by Application 2019 & 2032
- Table 43: Rest of Europe Car Loan Market Revenue (Million) Forecast, by Application 2019 & 2032
- Table 44: Rest of Europe Car Loan Market Volume (Trillion) Forecast, by Application 2019 & 2032
- Table 45: Global Car Loan Market Revenue Million Forecast, by Product Type 2019 & 2032
- Table 46: Global Car Loan Market Volume Trillion Forecast, by Product Type 2019 & 2032
- Table 47: Global Car Loan Market Revenue Million Forecast, by Ownership 2019 & 2032
- Table 48: Global Car Loan Market Volume Trillion Forecast, by Ownership 2019 & 2032
- Table 49: Global Car Loan Market Revenue Million Forecast, by Provider Type 2019 & 2032
- Table 50: Global Car Loan Market Volume Trillion Forecast, by Provider Type 2019 & 2032
- Table 51: Global Car Loan Market Revenue Million Forecast, by Tenure 2019 & 2032
- Table 52: Global Car Loan Market Volume Trillion Forecast, by Tenure 2019 & 2032
- Table 53: Global Car Loan Market Revenue Million Forecast, by Country 2019 & 2032
- Table 54: Global Car Loan Market Volume Trillion Forecast, by Country 2019 & 2032
- Table 55: China Car Loan Market Revenue (Million) Forecast, by Application 2019 & 2032
- Table 56: China Car Loan Market Volume (Trillion) Forecast, by Application 2019 & 2032
- Table 57: South Korea Car Loan Market Revenue (Million) Forecast, by Application 2019 & 2032
- Table 58: South Korea Car Loan Market Volume (Trillion) Forecast, by Application 2019 & 2032
- Table 59: Rest of Asia Pacific Car Loan Market Revenue (Million) Forecast, by Application 2019 & 2032
- Table 60: Rest of Asia Pacific Car Loan Market Volume (Trillion) Forecast, by Application 2019 & 2032
- Table 61: Global Car Loan Market Revenue Million Forecast, by Product Type 2019 & 2032
- Table 62: Global Car Loan Market Volume Trillion Forecast, by Product Type 2019 & 2032
- Table 63: Global Car Loan Market Revenue Million Forecast, by Ownership 2019 & 2032
- Table 64: Global Car Loan Market Volume Trillion Forecast, by Ownership 2019 & 2032
- Table 65: Global Car Loan Market Revenue Million Forecast, by Provider Type 2019 & 2032
- Table 66: Global Car Loan Market Volume Trillion Forecast, by Provider Type 2019 & 2032
- Table 67: Global Car Loan Market Revenue Million Forecast, by Tenure 2019 & 2032
- Table 68: Global Car Loan Market Volume Trillion Forecast, by Tenure 2019 & 2032
- Table 69: Global Car Loan Market Revenue Million Forecast, by Country 2019 & 2032
- Table 70: Global Car Loan Market Volume Trillion Forecast, by Country 2019 & 2032
- Table 71: Brazil Car Loan Market Revenue (Million) Forecast, by Application 2019 & 2032
- Table 72: Brazil Car Loan Market Volume (Trillion) Forecast, by Application 2019 & 2032
- Table 73: Chile Car Loan Market Revenue (Million) Forecast, by Application 2019 & 2032
- Table 74: Chile Car Loan Market Volume (Trillion) Forecast, by Application 2019 & 2032
- Table 75: Rest of Latin America Car Loan Market Revenue (Million) Forecast, by Application 2019 & 2032
- Table 76: Rest of Latin America Car Loan Market Volume (Trillion) Forecast, by Application 2019 & 2032
- Table 77: Global Car Loan Market Revenue Million Forecast, by Product Type 2019 & 2032
- Table 78: Global Car Loan Market Volume Trillion Forecast, by Product Type 2019 & 2032
- Table 79: Global Car Loan Market Revenue Million Forecast, by Ownership 2019 & 2032
- Table 80: Global Car Loan Market Volume Trillion Forecast, by Ownership 2019 & 2032
- Table 81: Global Car Loan Market Revenue Million Forecast, by Provider Type 2019 & 2032
- Table 82: Global Car Loan Market Volume Trillion Forecast, by Provider Type 2019 & 2032
- Table 83: Global Car Loan Market Revenue Million Forecast, by Tenure 2019 & 2032
- Table 84: Global Car Loan Market Volume Trillion Forecast, by Tenure 2019 & 2032
- Table 85: Global Car Loan Market Revenue Million Forecast, by Country 2019 & 2032
- Table 86: Global Car Loan Market Volume Trillion Forecast, by Country 2019 & 2032
- Table 87: Global Car Loan Market Revenue Million Forecast, by Product Type 2019 & 2032
- Table 88: Global Car Loan Market Volume Trillion Forecast, by Product Type 2019 & 2032
- Table 89: Global Car Loan Market Revenue Million Forecast, by Ownership 2019 & 2032
- Table 90: Global Car Loan Market Volume Trillion Forecast, by Ownership 2019 & 2032
- Table 91: Global Car Loan Market Revenue Million Forecast, by Provider Type 2019 & 2032
- Table 92: Global Car Loan Market Volume Trillion Forecast, by Provider Type 2019 & 2032
- Table 93: Global Car Loan Market Revenue Million Forecast, by Tenure 2019 & 2032
- Table 94: Global Car Loan Market Volume Trillion Forecast, by Tenure 2019 & 2032
- Table 95: Global Car Loan Market Revenue Million Forecast, by Country 2019 & 2032
- Table 96: Global Car Loan Market Volume Trillion Forecast, by Country 2019 & 2032
- Table 97: Global Car Loan Market Revenue Million Forecast, by Product Type 2019 & 2032
- Table 98: Global Car Loan Market Volume Trillion Forecast, by Product Type 2019 & 2032
- Table 99: Global Car Loan Market Revenue Million Forecast, by Ownership 2019 & 2032
- Table 100: Global Car Loan Market Volume Trillion Forecast, by Ownership 2019 & 2032
- Table 101: Global Car Loan Market Revenue Million Forecast, by Provider Type 2019 & 2032
- Table 102: Global Car Loan Market Volume Trillion Forecast, by Provider Type 2019 & 2032
- Table 103: Global Car Loan Market Revenue Million Forecast, by Tenure 2019 & 2032
- Table 104: Global Car Loan Market Volume Trillion Forecast, by Tenure 2019 & 2032
- Table 105: Global Car Loan Market Revenue Million Forecast, by Country 2019 & 2032
- Table 106: Global Car Loan Market Volume Trillion Forecast, by Country 2019 & 2032
- Table 107: Global Car Loan Market Revenue Million Forecast, by Product Type 2019 & 2032
- Table 108: Global Car Loan Market Volume Trillion Forecast, by Product Type 2019 & 2032
- Table 109: Global Car Loan Market Revenue Million Forecast, by Ownership 2019 & 2032
- Table 110: Global Car Loan Market Volume Trillion Forecast, by Ownership 2019 & 2032
- Table 111: Global Car Loan Market Revenue Million Forecast, by Provider Type 2019 & 2032
- Table 112: Global Car Loan Market Volume Trillion Forecast, by Provider Type 2019 & 2032
- Table 113: Global Car Loan Market Revenue Million Forecast, by Tenure 2019 & 2032
- Table 114: Global Car Loan Market Volume Trillion Forecast, by Tenure 2019 & 2032
- Table 115: Global Car Loan Market Revenue Million Forecast, by Country 2019 & 2032
- Table 116: Global Car Loan Market Volume Trillion Forecast, by Country 2019 & 2032
Frequently Asked Questions
1. What is the projected Compound Annual Growth Rate (CAGR) of the Car Loan Market?
The projected CAGR is approximately 3.67%.
2. Which companies are prominent players in the Car Loan Market?
Key companies in the market include Toyota Financial Services, Ford Credit, Ally Financial, Chase Auto Finance, Wells Fargo Auto, Bank of America, Capital One Auto Finance, Santander Consumer, BMW Financial Services, Honda Financial Services**List Not Exhaustive.
3. What are the main segments of the Car Loan Market?
The market segments include Product Type, Ownership, Provider Type, Tenure.
4. Can you provide details about the market size?
The market size is estimated to be USD 1.10 Million as of 2022.
5. What are some drivers contributing to market growth?
Rise in Demand for Luxury Cars Fueling the Market Growth.
6. What are the notable trends driving market growth?
Increasing Sales of Passenger Cars in Asia.
7. Are there any restraints impacting market growth?
Rise in Demand for Luxury Cars Fueling the Market Growth.
8. Can you provide examples of recent developments in the market?
May 2023: A subsidiary of Russian auto dealer Avilon, Art-Finance LLC, completed the acquisition of German automaker Volkswagen's Russian assets.
9. What pricing options are available for accessing the report?
Pricing options include single-user, multi-user, and enterprise licenses priced at USD 4750, USD 5250, and USD 8750 respectively.
10. Is the market size provided in terms of value or volume?
The market size is provided in terms of value, measured in Million and volume, measured in Trillion.
11. Are there any specific market keywords associated with the report?
Yes, the market keyword associated with the report is "Car Loan Market," which aids in identifying and referencing the specific market segment covered.
12. How do I determine which pricing option suits my needs best?
The pricing options vary based on user requirements and access needs. Individual users may opt for single-user licenses, while businesses requiring broader access may choose multi-user or enterprise licenses for cost-effective access to the report.
13. Are there any additional resources or data provided in the Car Loan Market report?
While the report offers comprehensive insights, it's advisable to review the specific contents or supplementary materials provided to ascertain if additional resources or data are available.
14. How can I stay updated on further developments or reports in the Car Loan Market?
To stay informed about further developments, trends, and reports in the Car Loan Market, consider subscribing to industry newsletters, following relevant companies and organizations, or regularly checking reputable industry news sources and publications.
Methodology
Step 1 - Identification of Relevant Samples Size from Population Database


Step 2 - Approaches for Defining Global Market Size (Value, Volume* & Price*)

Note*: In applicable scenarios
Step 3 - Data Sources
Primary Research
- Web Analytics
- Survey Reports
- Research Institute
- Latest Research Reports
- Opinion Leaders
Secondary Research
- Annual Reports
- White Paper
- Latest Press Release
- Industry Association
- Paid Database
- Investor Presentations

Step 4 - Data Triangulation
Involves using different sources of information in order to increase the validity of a study
These sources are likely to be stakeholders in a program - participants, other researchers, program staff, other community members, and so on.
Then we put all data in single framework & apply various statistical tools to find out the dynamic on the market.
During the analysis stage, feedback from the stakeholder groups would be compared to determine areas of agreement as well as areas of divergence


