
Key Insights
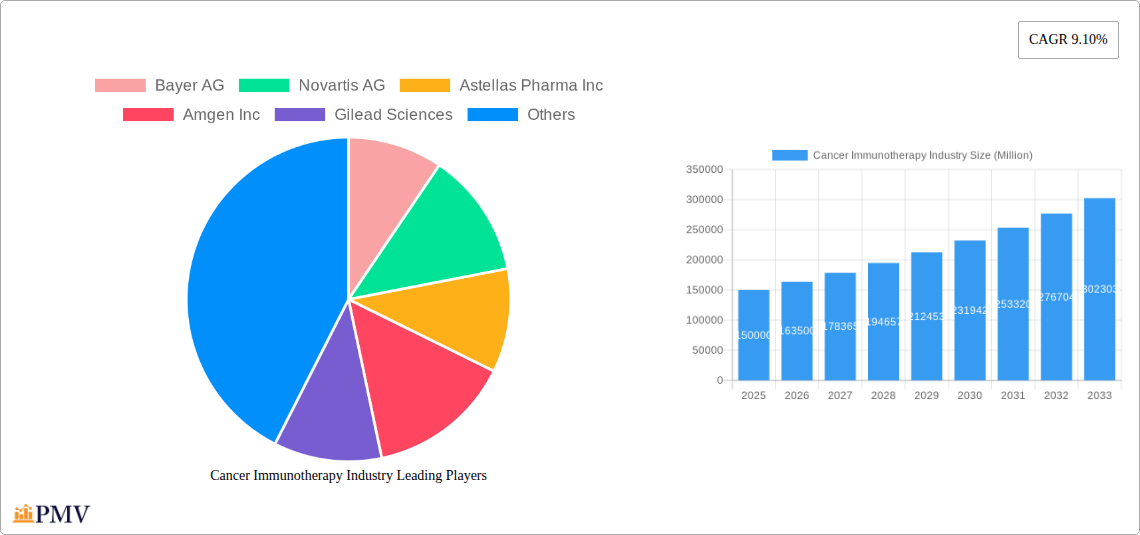
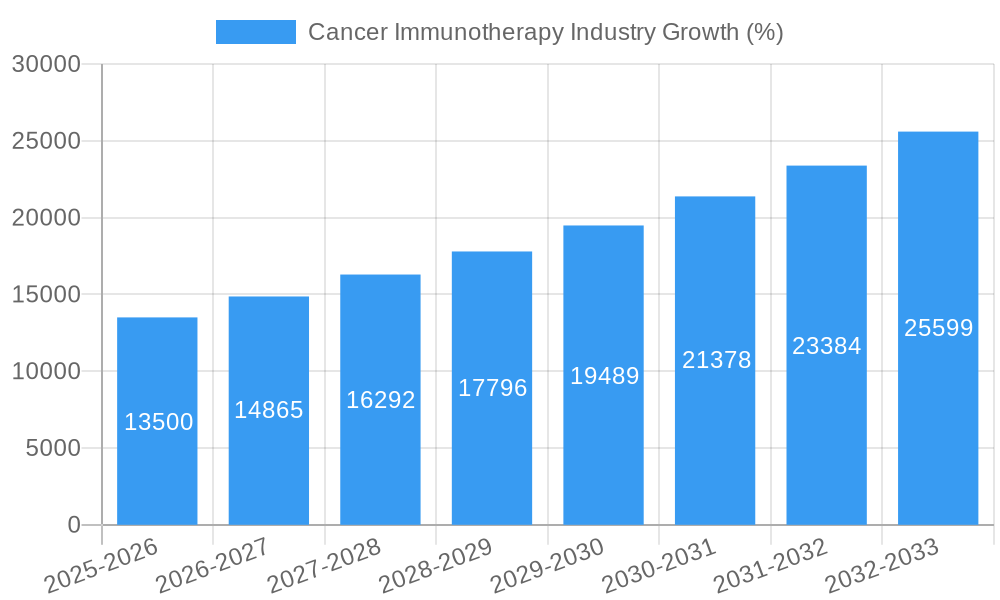
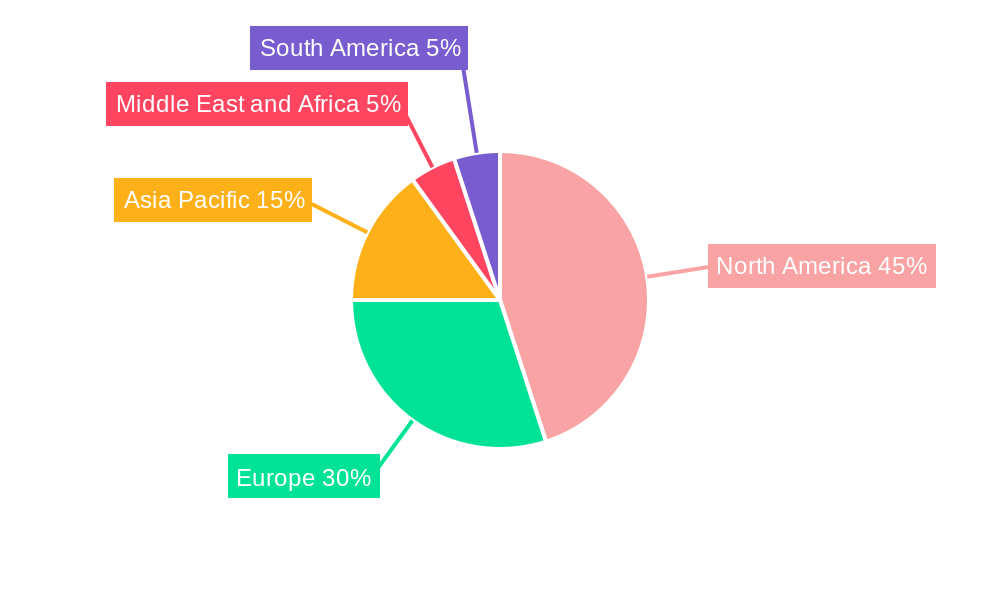
The global cancer immunotherapy market is experiencing robust growth, driven by a rising incidence of cancer, increasing prevalence of immunotherapeutic approaches, and the approval of novel therapies. The market's Compound Annual Growth Rate (CAGR) of 9.10% from 2019 to 2024 suggests a significant expansion, and this momentum is expected to continue through 2033. Key drivers include advancements in understanding the human immune system's interaction with cancer cells, leading to the development of more effective and targeted therapies. Monoclonal antibodies dominate the therapy type segment, owing to their widespread use and proven efficacy across various cancer types. Prostate, breast, lung, and skin cancers represent major application areas, reflecting high prevalence rates and the suitability of immunotherapy for these cancers. The market is segmented by end-users, with hospitals and clinics being the largest segment due to their essential role in cancer treatment and the administration of these advanced therapies. While the high cost of immunotherapy and potential side effects pose challenges, ongoing research and development efforts are focused on improving efficacy, reducing toxicity, and developing more personalized treatment approaches, mitigating these restraints. Major pharmaceutical companies, including Bayer AG, Novartis AG, and Amgen Inc., are heavily invested in R&D and are driving market growth through strategic partnerships, acquisitions, and the launch of innovative products. The geographical distribution shows a significant market share for North America, followed by Europe and Asia Pacific, reflecting these regions' advanced healthcare infrastructure and higher cancer incidence rates. The market is expected to expand significantly across all regions, propelled by rising awareness, improving healthcare access, and increased investment in oncology research.
The future growth of the cancer immunotherapy market hinges on several factors. Continued research into immune checkpoint inhibitors, cancer vaccines, and immunomodulators will significantly influence market dynamics. Personalized medicine approaches, tailoring immunotherapy treatments based on individual patient characteristics, are expected to gain momentum, further enhancing efficacy and reducing side effects. The expansion of access to advanced therapies in emerging economies will also contribute to market expansion. Regulatory approvals for novel therapies will play a vital role in shaping market growth, and the successful development of combination therapies, leveraging the synergistic effects of different immunotherapies, will significantly impact the market landscape. Pricing strategies and reimbursement policies will also influence the market's trajectory, balancing the need for profitability with ensuring access for patients. The competitive landscape is characterized by intense R&D, fierce competition among established players, and the emergence of innovative biotech companies, indicating a dynamic and rapidly evolving market.
Cancer Immunotherapy Market Report: 2019-2033
This comprehensive report provides an in-depth analysis of the global cancer immunotherapy market, offering invaluable insights for industry stakeholders, investors, and researchers. The report covers the period from 2019 to 2033, with 2025 serving as the base and estimated year. The forecast period spans from 2025 to 2033, while the historical period encompasses 2019-2024. The market is segmented by therapy type, application, and end-user, providing a granular view of its structure and dynamics. The report features a detailed competitive landscape, including analysis of key players such as Bayer AG, Novartis AG, Astellas Pharma Inc, Amgen Inc, Gilead Sciences, OSE Immunotherapeutics, Seattle Genetics Inc, AstraZeneca PLC, Eli Lilly and Company, Bristol-Myers Squibb, Merck and Co Inc, GlaxoSmithKline PLC, F Hoffman La Roche Ltd, and Pfizer Inc. The total market value is projected to reach xx Million by 2033.
Cancer Immunotherapy Industry Market Structure & Competitive Dynamics
This section analyzes the competitive landscape of the cancer immunotherapy market, focusing on market concentration, innovation ecosystems, regulatory frameworks, product substitutes, end-user trends, and mergers & acquisitions (M&A) activities. The market is characterized by a high degree of concentration, with a few large pharmaceutical companies holding significant market share. The top five players, including Bristol-Myers Squibb, Merck & Co., Roche, Pfizer, and others, collectively control approximately xx% of the market. Innovation ecosystems are thriving, with significant investments in research and development driving the emergence of novel therapies. The regulatory environment is constantly evolving, impacting the approval and commercialization of new immunotherapies. The market faces competition from other cancer treatments such as chemotherapy and radiation therapy. End-user trends show a preference for targeted therapies with fewer side effects. M&A activity is robust, with numerous deals valued at over xx Million annually during the forecast period, indicating a consolidation trend within the industry. For example, the acquisition of [Company A] by [Company B] in 2022 for xx Million significantly reshaped the competitive landscape. The average deal size is estimated to be xx Million, indicative of the significant investment in this sector.
Cancer Immunotherapy Industry Industry Trends & Insights
The global cancer immunotherapy market is experiencing robust growth, driven by several key factors. The rising prevalence of cancer globally is a primary driver, as is the increasing demand for effective and less toxic cancer treatments. Technological advancements, particularly in the development of novel immunotherapies such as CAR T-cell therapies and immune checkpoint inhibitors, are significantly boosting market growth. The compound annual growth rate (CAGR) for the period 2025-2033 is projected to be xx%, exceeding the historical CAGR of xx% (2019-2024). Market penetration of cancer immunotherapies is steadily increasing, with xx% of cancer patients receiving these treatments in 2025. Consumer preferences are shifting towards personalized medicine, with a focus on targeted therapies and improved quality of life. Competitive dynamics are intense, with companies continuously innovating to gain a competitive edge. The market is also witnessing increased collaboration among pharmaceutical companies, research institutions, and healthcare providers to accelerate the development and commercialization of novel immunotherapies. The market is also influenced by pricing strategies, reimbursement policies, and the overall healthcare landscape.
Dominant Markets & Segments in Cancer Immunotherapy Industry
The North American region is currently the dominant market for cancer immunotherapy, driven by high healthcare expenditure, advanced healthcare infrastructure, and a large patient population. Within North America, the United States holds the largest market share. Key drivers include robust funding for research and development, supportive regulatory frameworks, and high adoption rates for novel therapies.
Therapy Type: Immune checkpoint inhibitors dominate the therapy type segment, accounting for xx% of the market in 2025, due to their proven efficacy across multiple cancer types. Monoclonal antibodies also hold a significant share, projected to reach xx Million by 2033. The growth of other therapy types such as cancer vaccines and immunomodulators is projected to be moderate, but with high growth potential in the future.
Application: Lung cancer is the leading application segment, contributing to xx% of the market revenue in 2025, due to its high prevalence and responsiveness to immunotherapy. Prostate and breast cancers also represent large market segments. The market for other applications is expected to grow significantly during the forecast period, driven by the emergence of new immunotherapies.
End Users: Hospitals and clinics constitute the largest end-user segment, owing to their extensive capabilities for administering complex cancer treatments and providing comprehensive patient care. Cancer research centers play a crucial role in the development and evaluation of new immunotherapies.
Cancer Immunotherapy Industry Product Innovations
Recent years have witnessed significant advancements in cancer immunotherapy, including the development of novel immune checkpoint inhibitors, CAR T-cell therapies, and bispecific antibodies. These innovative therapies offer improved efficacy, reduced side effects, and personalized treatment options. The ongoing research into novel targets, combination therapies, and bioinformatics is poised to deliver further significant progress in cancer treatment, shaping the competitive landscape. The market success of these innovations depends on their clinical efficacy, safety profile, and cost-effectiveness, alongside regulatory approvals.
Report Segmentation & Scope
This report segments the cancer immunotherapy market across several key parameters:
Therapy Type: Monoclonal antibodies, cancer vaccines, immunomodulators, immune checkpoint inhibitors, and other therapy types. Each segment's growth trajectory and competitive dynamics are analyzed individually, projecting market sizes and shares. Immune checkpoint inhibitors are expected to maintain dominance, while other therapy types are poised for growth.
Application: Prostate cancer, breast cancer, skin cancer, lung cancer, and other applications are assessed in terms of their specific market size, growth rate, and leading players. The market is expected to experience substantial growth due to the rising prevalence of cancer and the effectiveness of immunotherapy.
End Users: Hospitals and clinics, cancer research centers, and other end users are examined, highlighting each segment’s unique characteristics and contribution to the overall market. Hospitals and clinics dominate the segment due to their expertise and infrastructure.
Key Drivers of Cancer Immunotherapy Industry Growth
The growth of the cancer immunotherapy market is fueled by several key drivers:
- The increasing prevalence of cancer globally.
- The rising demand for effective and less toxic cancer treatments.
- Technological advancements leading to the development of novel immunotherapies.
- Favorable regulatory policies supporting the approval and commercialization of new therapies.
- Increased investment in research and development by pharmaceutical companies.
Challenges in the Cancer Immunotherapy Industry Sector
Despite the significant growth potential, the cancer immunotherapy market faces several challenges:
- High cost of treatment and limited affordability in many regions.
- Potential side effects and immune-related adverse events.
- The complexity of manufacturing and supply chain management for certain therapies.
- Intense competition among pharmaceutical companies, and potential delays and uncertainties in the regulatory approval process, leading to slower market penetration.
Leading Players in the Cancer Immunotherapy Industry Market
- Bayer AG
- Novartis AG
- Astellas Pharma Inc
- Amgen Inc
- Gilead Sciences
- OSE Immunotherapeutics
- Seattle Genetics Inc
- AstraZeneca PLC
- Eli Lilly and Company
- Bristol-Myers Squibb
- Merck and Co Inc
- GlaxoSmithKline PLC
- F Hoffman La Roche Ltd
- Pfizer Inc
Key Developments in Cancer Immunotherapy Industry Sector
- January 2023: FDA approves new immune checkpoint inhibitor for advanced melanoma.
- June 2022: Major pharmaceutical company announces a strategic partnership to develop a novel CAR T-cell therapy.
- October 2021: Successful completion of Phase 3 clinical trial for a new immunomodulator.
- March 2020: Acquisition of a biotech company specializing in cancer vaccines by a large pharmaceutical company for xx Million.
Strategic Cancer Immunotherapy Industry Market Outlook
The cancer immunotherapy market is poised for substantial growth in the coming years, driven by continuous innovation, increasing demand, and favorable regulatory environments. Strategic opportunities exist in developing novel combination therapies, expanding into emerging markets, and focusing on personalized medicine approaches. Further research into biomarkers and predictive tools will enhance the effectiveness and safety of immunotherapies, while collaborations among pharmaceutical companies, research institutions, and healthcare providers are key to driving market expansion. Investment in research and development remains crucial for sustaining growth and delivering innovative solutions to meet the unmet needs of cancer patients.
Cancer Immunotherapy Industry Segmentation
-
1. Therapy Type
- 1.1. Monoclonal Antibodies
- 1.2. Cancer Vaccines
- 1.3. Immunomodulators
- 1.4. Immune Check Point Inhibitors
- 1.5. Other Therapy Types
-
2. Application
- 2.1. Prostate Cancer
- 2.2. Breast Cancer
- 2.3. Skin Cancer
- 2.4. Lung Cancer
- 2.5. Other Applications
-
3. End Users
- 3.1. Hospitals and Clinics
- 3.2. Cancer Research Centers
- 3.3. Other End Users
Cancer Immunotherapy Industry Segmentation By Geography
-
1. North America
- 1.1. United States
- 1.2. Canada
- 1.3. Mexico
-
2. Europe
- 2.1. Germany
- 2.2. United Kingdom
- 2.3. France
- 2.4. Italy
- 2.5. Spain
- 2.6. Rest of Europe
-
3. Asia Pacific
- 3.1. China
- 3.2. Japan
- 3.3. India
- 3.4. Australia
- 3.5. South Korea
- 3.6. Rest of Asia Pacific
-
4. Middle East and Africa
- 4.1. GCC
- 4.2. South Africa
- 4.3. Rest of Middle East and Africa
-
5. South America
- 5.1. Brazil
- 5.2. Argentina
- 5.3. Rest of South America
Cancer Immunotherapy Industry REPORT HIGHLIGHTS
| Aspects | Details |
|---|---|
| Study Period | 2019-2033 |
| Base Year | 2024 |
| Estimated Year | 2025 |
| Forecast Period | 2025-2033 |
| Historical Period | 2019-2024 |
| Growth Rate | CAGR of 9.10% from 2019-2033 |
| Segmentation |
|
Table of Contents
- 1. Introduction
- 1.1. Research Scope
- 1.2. Market Segmentation
- 1.3. Research Methodology
- 1.4. Definitions and Assumptions
- 2. Executive Summary
- 2.1. Introduction
- 3. Market Dynamics
- 3.1. Introduction
- 3.2. Market Drivers
- 3.2.1. Rising R&D Activities; Increasing Effectivity and Accuracy Of Newer Therapies; Growing Prevalence of Cancer
- 3.3. Market Restrains
- 3.3.1. High Cost Coupled with Expensive Development; Stringent Regulatory Factors
- 3.4. Market Trends
- 3.4.1. Breast Cancer Segment Expected to Hold a Major Share in the Cancer Immunotherapy Market
- 4. Market Factor Analysis
- 4.1. Porters Five Forces
- 4.2. Supply/Value Chain
- 4.3. PESTEL analysis
- 4.4. Market Entropy
- 4.5. Patent/Trademark Analysis
- 5. Global Cancer Immunotherapy Industry Analysis, Insights and Forecast, 2019-2031
- 5.1. Market Analysis, Insights and Forecast - by Therapy Type
- 5.1.1. Monoclonal Antibodies
- 5.1.2. Cancer Vaccines
- 5.1.3. Immunomodulators
- 5.1.4. Immune Check Point Inhibitors
- 5.1.5. Other Therapy Types
- 5.2. Market Analysis, Insights and Forecast - by Application
- 5.2.1. Prostate Cancer
- 5.2.2. Breast Cancer
- 5.2.3. Skin Cancer
- 5.2.4. Lung Cancer
- 5.2.5. Other Applications
- 5.3. Market Analysis, Insights and Forecast - by End Users
- 5.3.1. Hospitals and Clinics
- 5.3.2. Cancer Research Centers
- 5.3.3. Other End Users
- 5.4. Market Analysis, Insights and Forecast - by Region
- 5.4.1. North America
- 5.4.2. Europe
- 5.4.3. Asia Pacific
- 5.4.4. Middle East and Africa
- 5.4.5. South America
- 5.1. Market Analysis, Insights and Forecast - by Therapy Type
- 6. North America Cancer Immunotherapy Industry Analysis, Insights and Forecast, 2019-2031
- 6.1. Market Analysis, Insights and Forecast - by Therapy Type
- 6.1.1. Monoclonal Antibodies
- 6.1.2. Cancer Vaccines
- 6.1.3. Immunomodulators
- 6.1.4. Immune Check Point Inhibitors
- 6.1.5. Other Therapy Types
- 6.2. Market Analysis, Insights and Forecast - by Application
- 6.2.1. Prostate Cancer
- 6.2.2. Breast Cancer
- 6.2.3. Skin Cancer
- 6.2.4. Lung Cancer
- 6.2.5. Other Applications
- 6.3. Market Analysis, Insights and Forecast - by End Users
- 6.3.1. Hospitals and Clinics
- 6.3.2. Cancer Research Centers
- 6.3.3. Other End Users
- 6.1. Market Analysis, Insights and Forecast - by Therapy Type
- 7. Europe Cancer Immunotherapy Industry Analysis, Insights and Forecast, 2019-2031
- 7.1. Market Analysis, Insights and Forecast - by Therapy Type
- 7.1.1. Monoclonal Antibodies
- 7.1.2. Cancer Vaccines
- 7.1.3. Immunomodulators
- 7.1.4. Immune Check Point Inhibitors
- 7.1.5. Other Therapy Types
- 7.2. Market Analysis, Insights and Forecast - by Application
- 7.2.1. Prostate Cancer
- 7.2.2. Breast Cancer
- 7.2.3. Skin Cancer
- 7.2.4. Lung Cancer
- 7.2.5. Other Applications
- 7.3. Market Analysis, Insights and Forecast - by End Users
- 7.3.1. Hospitals and Clinics
- 7.3.2. Cancer Research Centers
- 7.3.3. Other End Users
- 7.1. Market Analysis, Insights and Forecast - by Therapy Type
- 8. Asia Pacific Cancer Immunotherapy Industry Analysis, Insights and Forecast, 2019-2031
- 8.1. Market Analysis, Insights and Forecast - by Therapy Type
- 8.1.1. Monoclonal Antibodies
- 8.1.2. Cancer Vaccines
- 8.1.3. Immunomodulators
- 8.1.4. Immune Check Point Inhibitors
- 8.1.5. Other Therapy Types
- 8.2. Market Analysis, Insights and Forecast - by Application
- 8.2.1. Prostate Cancer
- 8.2.2. Breast Cancer
- 8.2.3. Skin Cancer
- 8.2.4. Lung Cancer
- 8.2.5. Other Applications
- 8.3. Market Analysis, Insights and Forecast - by End Users
- 8.3.1. Hospitals and Clinics
- 8.3.2. Cancer Research Centers
- 8.3.3. Other End Users
- 8.1. Market Analysis, Insights and Forecast - by Therapy Type
- 9. Middle East and Africa Cancer Immunotherapy Industry Analysis, Insights and Forecast, 2019-2031
- 9.1. Market Analysis, Insights and Forecast - by Therapy Type
- 9.1.1. Monoclonal Antibodies
- 9.1.2. Cancer Vaccines
- 9.1.3. Immunomodulators
- 9.1.4. Immune Check Point Inhibitors
- 9.1.5. Other Therapy Types
- 9.2. Market Analysis, Insights and Forecast - by Application
- 9.2.1. Prostate Cancer
- 9.2.2. Breast Cancer
- 9.2.3. Skin Cancer
- 9.2.4. Lung Cancer
- 9.2.5. Other Applications
- 9.3. Market Analysis, Insights and Forecast - by End Users
- 9.3.1. Hospitals and Clinics
- 9.3.2. Cancer Research Centers
- 9.3.3. Other End Users
- 9.1. Market Analysis, Insights and Forecast - by Therapy Type
- 10. South America Cancer Immunotherapy Industry Analysis, Insights and Forecast, 2019-2031
- 10.1. Market Analysis, Insights and Forecast - by Therapy Type
- 10.1.1. Monoclonal Antibodies
- 10.1.2. Cancer Vaccines
- 10.1.3. Immunomodulators
- 10.1.4. Immune Check Point Inhibitors
- 10.1.5. Other Therapy Types
- 10.2. Market Analysis, Insights and Forecast - by Application
- 10.2.1. Prostate Cancer
- 10.2.2. Breast Cancer
- 10.2.3. Skin Cancer
- 10.2.4. Lung Cancer
- 10.2.5. Other Applications
- 10.3. Market Analysis, Insights and Forecast - by End Users
- 10.3.1. Hospitals and Clinics
- 10.3.2. Cancer Research Centers
- 10.3.3. Other End Users
- 10.1. Market Analysis, Insights and Forecast - by Therapy Type
- 11. North America Cancer Immunotherapy Industry Analysis, Insights and Forecast, 2019-2031
- 11.1. Market Analysis, Insights and Forecast - By Country/Sub-region
- 11.1.1 United States
- 11.1.2 Canada
- 11.1.3 Mexico
- 12. Europe Cancer Immunotherapy Industry Analysis, Insights and Forecast, 2019-2031
- 12.1. Market Analysis, Insights and Forecast - By Country/Sub-region
- 12.1.1 Germany
- 12.1.2 United Kingdom
- 12.1.3 France
- 12.1.4 Italy
- 12.1.5 Spain
- 12.1.6 Rest of Europe
- 13. Asia Pacific Cancer Immunotherapy Industry Analysis, Insights and Forecast, 2019-2031
- 13.1. Market Analysis, Insights and Forecast - By Country/Sub-region
- 13.1.1 China
- 13.1.2 Japan
- 13.1.3 India
- 13.1.4 Australia
- 13.1.5 South Korea
- 13.1.6 Rest of Asia Pacific
- 14. Middle East and Africa Cancer Immunotherapy Industry Analysis, Insights and Forecast, 2019-2031
- 14.1. Market Analysis, Insights and Forecast - By Country/Sub-region
- 14.1.1 GCC
- 14.1.2 South Africa
- 14.1.3 Rest of Middle East and Africa
- 15. South America Cancer Immunotherapy Industry Analysis, Insights and Forecast, 2019-2031
- 15.1. Market Analysis, Insights and Forecast - By Country/Sub-region
- 15.1.1 Brazil
- 15.1.2 Argentina
- 15.1.3 Rest of South America
- 16. Competitive Analysis
- 16.1. Global Market Share Analysis 2024
- 16.2. Company Profiles
- 16.2.1 Bayer AG
- 16.2.1.1. Overview
- 16.2.1.2. Products
- 16.2.1.3. SWOT Analysis
- 16.2.1.4. Recent Developments
- 16.2.1.5. Financials (Based on Availability)
- 16.2.2 Novartis AG
- 16.2.2.1. Overview
- 16.2.2.2. Products
- 16.2.2.3. SWOT Analysis
- 16.2.2.4. Recent Developments
- 16.2.2.5. Financials (Based on Availability)
- 16.2.3 Astellas Pharma Inc
- 16.2.3.1. Overview
- 16.2.3.2. Products
- 16.2.3.3. SWOT Analysis
- 16.2.3.4. Recent Developments
- 16.2.3.5. Financials (Based on Availability)
- 16.2.4 Amgen Inc
- 16.2.4.1. Overview
- 16.2.4.2. Products
- 16.2.4.3. SWOT Analysis
- 16.2.4.4. Recent Developments
- 16.2.4.5. Financials (Based on Availability)
- 16.2.5 Gilead Sciences
- 16.2.5.1. Overview
- 16.2.5.2. Products
- 16.2.5.3. SWOT Analysis
- 16.2.5.4. Recent Developments
- 16.2.5.5. Financials (Based on Availability)
- 16.2.6 OSE Immunotherapeutics
- 16.2.6.1. Overview
- 16.2.6.2. Products
- 16.2.6.3. SWOT Analysis
- 16.2.6.4. Recent Developments
- 16.2.6.5. Financials (Based on Availability)
- 16.2.7 Seattle Genetics Inc
- 16.2.7.1. Overview
- 16.2.7.2. Products
- 16.2.7.3. SWOT Analysis
- 16.2.7.4. Recent Developments
- 16.2.7.5. Financials (Based on Availability)
- 16.2.8 AstraZeneca PLC
- 16.2.8.1. Overview
- 16.2.8.2. Products
- 16.2.8.3. SWOT Analysis
- 16.2.8.4. Recent Developments
- 16.2.8.5. Financials (Based on Availability)
- 16.2.9 Eli Lilly and Company
- 16.2.9.1. Overview
- 16.2.9.2. Products
- 16.2.9.3. SWOT Analysis
- 16.2.9.4. Recent Developments
- 16.2.9.5. Financials (Based on Availability)
- 16.2.10 Bristol-Myers Squibb
- 16.2.10.1. Overview
- 16.2.10.2. Products
- 16.2.10.3. SWOT Analysis
- 16.2.10.4. Recent Developments
- 16.2.10.5. Financials (Based on Availability)
- 16.2.11 Merck and Co Inc
- 16.2.11.1. Overview
- 16.2.11.2. Products
- 16.2.11.3. SWOT Analysis
- 16.2.11.4. Recent Developments
- 16.2.11.5. Financials (Based on Availability)
- 16.2.12 GlaxoSmithKline PLC
- 16.2.12.1. Overview
- 16.2.12.2. Products
- 16.2.12.3. SWOT Analysis
- 16.2.12.4. Recent Developments
- 16.2.12.5. Financials (Based on Availability)
- 16.2.13 F Hoffman La Roche Ltd
- 16.2.13.1. Overview
- 16.2.13.2. Products
- 16.2.13.3. SWOT Analysis
- 16.2.13.4. Recent Developments
- 16.2.13.5. Financials (Based on Availability)
- 16.2.14 Pfizer Inc
- 16.2.14.1. Overview
- 16.2.14.2. Products
- 16.2.14.3. SWOT Analysis
- 16.2.14.4. Recent Developments
- 16.2.14.5. Financials (Based on Availability)
- 16.2.1 Bayer AG
List of Figures
- Figure 1: Global Cancer Immunotherapy Industry Revenue Breakdown (Million, %) by Region 2024 & 2032
- Figure 2: Global Cancer Immunotherapy Industry Volume Breakdown (K Unit, %) by Region 2024 & 2032
- Figure 3: North America Cancer Immunotherapy Industry Revenue (Million), by Country 2024 & 2032
- Figure 4: North America Cancer Immunotherapy Industry Volume (K Unit), by Country 2024 & 2032
- Figure 5: North America Cancer Immunotherapy Industry Revenue Share (%), by Country 2024 & 2032
- Figure 6: North America Cancer Immunotherapy Industry Volume Share (%), by Country 2024 & 2032
- Figure 7: Europe Cancer Immunotherapy Industry Revenue (Million), by Country 2024 & 2032
- Figure 8: Europe Cancer Immunotherapy Industry Volume (K Unit), by Country 2024 & 2032
- Figure 9: Europe Cancer Immunotherapy Industry Revenue Share (%), by Country 2024 & 2032
- Figure 10: Europe Cancer Immunotherapy Industry Volume Share (%), by Country 2024 & 2032
- Figure 11: Asia Pacific Cancer Immunotherapy Industry Revenue (Million), by Country 2024 & 2032
- Figure 12: Asia Pacific Cancer Immunotherapy Industry Volume (K Unit), by Country 2024 & 2032
- Figure 13: Asia Pacific Cancer Immunotherapy Industry Revenue Share (%), by Country 2024 & 2032
- Figure 14: Asia Pacific Cancer Immunotherapy Industry Volume Share (%), by Country 2024 & 2032
- Figure 15: Middle East and Africa Cancer Immunotherapy Industry Revenue (Million), by Country 2024 & 2032
- Figure 16: Middle East and Africa Cancer Immunotherapy Industry Volume (K Unit), by Country 2024 & 2032
- Figure 17: Middle East and Africa Cancer Immunotherapy Industry Revenue Share (%), by Country 2024 & 2032
- Figure 18: Middle East and Africa Cancer Immunotherapy Industry Volume Share (%), by Country 2024 & 2032
- Figure 19: South America Cancer Immunotherapy Industry Revenue (Million), by Country 2024 & 2032
- Figure 20: South America Cancer Immunotherapy Industry Volume (K Unit), by Country 2024 & 2032
- Figure 21: South America Cancer Immunotherapy Industry Revenue Share (%), by Country 2024 & 2032
- Figure 22: South America Cancer Immunotherapy Industry Volume Share (%), by Country 2024 & 2032
- Figure 23: North America Cancer Immunotherapy Industry Revenue (Million), by Therapy Type 2024 & 2032
- Figure 24: North America Cancer Immunotherapy Industry Volume (K Unit), by Therapy Type 2024 & 2032
- Figure 25: North America Cancer Immunotherapy Industry Revenue Share (%), by Therapy Type 2024 & 2032
- Figure 26: North America Cancer Immunotherapy Industry Volume Share (%), by Therapy Type 2024 & 2032
- Figure 27: North America Cancer Immunotherapy Industry Revenue (Million), by Application 2024 & 2032
- Figure 28: North America Cancer Immunotherapy Industry Volume (K Unit), by Application 2024 & 2032
- Figure 29: North America Cancer Immunotherapy Industry Revenue Share (%), by Application 2024 & 2032
- Figure 30: North America Cancer Immunotherapy Industry Volume Share (%), by Application 2024 & 2032
- Figure 31: North America Cancer Immunotherapy Industry Revenue (Million), by End Users 2024 & 2032
- Figure 32: North America Cancer Immunotherapy Industry Volume (K Unit), by End Users 2024 & 2032
- Figure 33: North America Cancer Immunotherapy Industry Revenue Share (%), by End Users 2024 & 2032
- Figure 34: North America Cancer Immunotherapy Industry Volume Share (%), by End Users 2024 & 2032
- Figure 35: North America Cancer Immunotherapy Industry Revenue (Million), by Country 2024 & 2032
- Figure 36: North America Cancer Immunotherapy Industry Volume (K Unit), by Country 2024 & 2032
- Figure 37: North America Cancer Immunotherapy Industry Revenue Share (%), by Country 2024 & 2032
- Figure 38: North America Cancer Immunotherapy Industry Volume Share (%), by Country 2024 & 2032
- Figure 39: Europe Cancer Immunotherapy Industry Revenue (Million), by Therapy Type 2024 & 2032
- Figure 40: Europe Cancer Immunotherapy Industry Volume (K Unit), by Therapy Type 2024 & 2032
- Figure 41: Europe Cancer Immunotherapy Industry Revenue Share (%), by Therapy Type 2024 & 2032
- Figure 42: Europe Cancer Immunotherapy Industry Volume Share (%), by Therapy Type 2024 & 2032
- Figure 43: Europe Cancer Immunotherapy Industry Revenue (Million), by Application 2024 & 2032
- Figure 44: Europe Cancer Immunotherapy Industry Volume (K Unit), by Application 2024 & 2032
- Figure 45: Europe Cancer Immunotherapy Industry Revenue Share (%), by Application 2024 & 2032
- Figure 46: Europe Cancer Immunotherapy Industry Volume Share (%), by Application 2024 & 2032
- Figure 47: Europe Cancer Immunotherapy Industry Revenue (Million), by End Users 2024 & 2032
- Figure 48: Europe Cancer Immunotherapy Industry Volume (K Unit), by End Users 2024 & 2032
- Figure 49: Europe Cancer Immunotherapy Industry Revenue Share (%), by End Users 2024 & 2032
- Figure 50: Europe Cancer Immunotherapy Industry Volume Share (%), by End Users 2024 & 2032
- Figure 51: Europe Cancer Immunotherapy Industry Revenue (Million), by Country 2024 & 2032
- Figure 52: Europe Cancer Immunotherapy Industry Volume (K Unit), by Country 2024 & 2032
- Figure 53: Europe Cancer Immunotherapy Industry Revenue Share (%), by Country 2024 & 2032
- Figure 54: Europe Cancer Immunotherapy Industry Volume Share (%), by Country 2024 & 2032
- Figure 55: Asia Pacific Cancer Immunotherapy Industry Revenue (Million), by Therapy Type 2024 & 2032
- Figure 56: Asia Pacific Cancer Immunotherapy Industry Volume (K Unit), by Therapy Type 2024 & 2032
- Figure 57: Asia Pacific Cancer Immunotherapy Industry Revenue Share (%), by Therapy Type 2024 & 2032
- Figure 58: Asia Pacific Cancer Immunotherapy Industry Volume Share (%), by Therapy Type 2024 & 2032
- Figure 59: Asia Pacific Cancer Immunotherapy Industry Revenue (Million), by Application 2024 & 2032
- Figure 60: Asia Pacific Cancer Immunotherapy Industry Volume (K Unit), by Application 2024 & 2032
- Figure 61: Asia Pacific Cancer Immunotherapy Industry Revenue Share (%), by Application 2024 & 2032
- Figure 62: Asia Pacific Cancer Immunotherapy Industry Volume Share (%), by Application 2024 & 2032
- Figure 63: Asia Pacific Cancer Immunotherapy Industry Revenue (Million), by End Users 2024 & 2032
- Figure 64: Asia Pacific Cancer Immunotherapy Industry Volume (K Unit), by End Users 2024 & 2032
- Figure 65: Asia Pacific Cancer Immunotherapy Industry Revenue Share (%), by End Users 2024 & 2032
- Figure 66: Asia Pacific Cancer Immunotherapy Industry Volume Share (%), by End Users 2024 & 2032
- Figure 67: Asia Pacific Cancer Immunotherapy Industry Revenue (Million), by Country 2024 & 2032
- Figure 68: Asia Pacific Cancer Immunotherapy Industry Volume (K Unit), by Country 2024 & 2032
- Figure 69: Asia Pacific Cancer Immunotherapy Industry Revenue Share (%), by Country 2024 & 2032
- Figure 70: Asia Pacific Cancer Immunotherapy Industry Volume Share (%), by Country 2024 & 2032
- Figure 71: Middle East and Africa Cancer Immunotherapy Industry Revenue (Million), by Therapy Type 2024 & 2032
- Figure 72: Middle East and Africa Cancer Immunotherapy Industry Volume (K Unit), by Therapy Type 2024 & 2032
- Figure 73: Middle East and Africa Cancer Immunotherapy Industry Revenue Share (%), by Therapy Type 2024 & 2032
- Figure 74: Middle East and Africa Cancer Immunotherapy Industry Volume Share (%), by Therapy Type 2024 & 2032
- Figure 75: Middle East and Africa Cancer Immunotherapy Industry Revenue (Million), by Application 2024 & 2032
- Figure 76: Middle East and Africa Cancer Immunotherapy Industry Volume (K Unit), by Application 2024 & 2032
- Figure 77: Middle East and Africa Cancer Immunotherapy Industry Revenue Share (%), by Application 2024 & 2032
- Figure 78: Middle East and Africa Cancer Immunotherapy Industry Volume Share (%), by Application 2024 & 2032
- Figure 79: Middle East and Africa Cancer Immunotherapy Industry Revenue (Million), by End Users 2024 & 2032
- Figure 80: Middle East and Africa Cancer Immunotherapy Industry Volume (K Unit), by End Users 2024 & 2032
- Figure 81: Middle East and Africa Cancer Immunotherapy Industry Revenue Share (%), by End Users 2024 & 2032
- Figure 82: Middle East and Africa Cancer Immunotherapy Industry Volume Share (%), by End Users 2024 & 2032
- Figure 83: Middle East and Africa Cancer Immunotherapy Industry Revenue (Million), by Country 2024 & 2032
- Figure 84: Middle East and Africa Cancer Immunotherapy Industry Volume (K Unit), by Country 2024 & 2032
- Figure 85: Middle East and Africa Cancer Immunotherapy Industry Revenue Share (%), by Country 2024 & 2032
- Figure 86: Middle East and Africa Cancer Immunotherapy Industry Volume Share (%), by Country 2024 & 2032
- Figure 87: South America Cancer Immunotherapy Industry Revenue (Million), by Therapy Type 2024 & 2032
- Figure 88: South America Cancer Immunotherapy Industry Volume (K Unit), by Therapy Type 2024 & 2032
- Figure 89: South America Cancer Immunotherapy Industry Revenue Share (%), by Therapy Type 2024 & 2032
- Figure 90: South America Cancer Immunotherapy Industry Volume Share (%), by Therapy Type 2024 & 2032
- Figure 91: South America Cancer Immunotherapy Industry Revenue (Million), by Application 2024 & 2032
- Figure 92: South America Cancer Immunotherapy Industry Volume (K Unit), by Application 2024 & 2032
- Figure 93: South America Cancer Immunotherapy Industry Revenue Share (%), by Application 2024 & 2032
- Figure 94: South America Cancer Immunotherapy Industry Volume Share (%), by Application 2024 & 2032
- Figure 95: South America Cancer Immunotherapy Industry Revenue (Million), by End Users 2024 & 2032
- Figure 96: South America Cancer Immunotherapy Industry Volume (K Unit), by End Users 2024 & 2032
- Figure 97: South America Cancer Immunotherapy Industry Revenue Share (%), by End Users 2024 & 2032
- Figure 98: South America Cancer Immunotherapy Industry Volume Share (%), by End Users 2024 & 2032
- Figure 99: South America Cancer Immunotherapy Industry Revenue (Million), by Country 2024 & 2032
- Figure 100: South America Cancer Immunotherapy Industry Volume (K Unit), by Country 2024 & 2032
- Figure 101: South America Cancer Immunotherapy Industry Revenue Share (%), by Country 2024 & 2032
- Figure 102: South America Cancer Immunotherapy Industry Volume Share (%), by Country 2024 & 2032
List of Tables
- Table 1: Global Cancer Immunotherapy Industry Revenue Million Forecast, by Region 2019 & 2032
- Table 2: Global Cancer Immunotherapy Industry Volume K Unit Forecast, by Region 2019 & 2032
- Table 3: Global Cancer Immunotherapy Industry Revenue Million Forecast, by Therapy Type 2019 & 2032
- Table 4: Global Cancer Immunotherapy Industry Volume K Unit Forecast, by Therapy Type 2019 & 2032
- Table 5: Global Cancer Immunotherapy Industry Revenue Million Forecast, by Application 2019 & 2032
- Table 6: Global Cancer Immunotherapy Industry Volume K Unit Forecast, by Application 2019 & 2032
- Table 7: Global Cancer Immunotherapy Industry Revenue Million Forecast, by End Users 2019 & 2032
- Table 8: Global Cancer Immunotherapy Industry Volume K Unit Forecast, by End Users 2019 & 2032
- Table 9: Global Cancer Immunotherapy Industry Revenue Million Forecast, by Region 2019 & 2032
- Table 10: Global Cancer Immunotherapy Industry Volume K Unit Forecast, by Region 2019 & 2032
- Table 11: Global Cancer Immunotherapy Industry Revenue Million Forecast, by Country 2019 & 2032
- Table 12: Global Cancer Immunotherapy Industry Volume K Unit Forecast, by Country 2019 & 2032
- Table 13: United States Cancer Immunotherapy Industry Revenue (Million) Forecast, by Application 2019 & 2032
- Table 14: United States Cancer Immunotherapy Industry Volume (K Unit) Forecast, by Application 2019 & 2032
- Table 15: Canada Cancer Immunotherapy Industry Revenue (Million) Forecast, by Application 2019 & 2032
- Table 16: Canada Cancer Immunotherapy Industry Volume (K Unit) Forecast, by Application 2019 & 2032
- Table 17: Mexico Cancer Immunotherapy Industry Revenue (Million) Forecast, by Application 2019 & 2032
- Table 18: Mexico Cancer Immunotherapy Industry Volume (K Unit) Forecast, by Application 2019 & 2032
- Table 19: Global Cancer Immunotherapy Industry Revenue Million Forecast, by Country 2019 & 2032
- Table 20: Global Cancer Immunotherapy Industry Volume K Unit Forecast, by Country 2019 & 2032
- Table 21: Germany Cancer Immunotherapy Industry Revenue (Million) Forecast, by Application 2019 & 2032
- Table 22: Germany Cancer Immunotherapy Industry Volume (K Unit) Forecast, by Application 2019 & 2032
- Table 23: United Kingdom Cancer Immunotherapy Industry Revenue (Million) Forecast, by Application 2019 & 2032
- Table 24: United Kingdom Cancer Immunotherapy Industry Volume (K Unit) Forecast, by Application 2019 & 2032
- Table 25: France Cancer Immunotherapy Industry Revenue (Million) Forecast, by Application 2019 & 2032
- Table 26: France Cancer Immunotherapy Industry Volume (K Unit) Forecast, by Application 2019 & 2032
- Table 27: Italy Cancer Immunotherapy Industry Revenue (Million) Forecast, by Application 2019 & 2032
- Table 28: Italy Cancer Immunotherapy Industry Volume (K Unit) Forecast, by Application 2019 & 2032
- Table 29: Spain Cancer Immunotherapy Industry Revenue (Million) Forecast, by Application 2019 & 2032
- Table 30: Spain Cancer Immunotherapy Industry Volume (K Unit) Forecast, by Application 2019 & 2032
- Table 31: Rest of Europe Cancer Immunotherapy Industry Revenue (Million) Forecast, by Application 2019 & 2032
- Table 32: Rest of Europe Cancer Immunotherapy Industry Volume (K Unit) Forecast, by Application 2019 & 2032
- Table 33: Global Cancer Immunotherapy Industry Revenue Million Forecast, by Country 2019 & 2032
- Table 34: Global Cancer Immunotherapy Industry Volume K Unit Forecast, by Country 2019 & 2032
- Table 35: China Cancer Immunotherapy Industry Revenue (Million) Forecast, by Application 2019 & 2032
- Table 36: China Cancer Immunotherapy Industry Volume (K Unit) Forecast, by Application 2019 & 2032
- Table 37: Japan Cancer Immunotherapy Industry Revenue (Million) Forecast, by Application 2019 & 2032
- Table 38: Japan Cancer Immunotherapy Industry Volume (K Unit) Forecast, by Application 2019 & 2032
- Table 39: India Cancer Immunotherapy Industry Revenue (Million) Forecast, by Application 2019 & 2032
- Table 40: India Cancer Immunotherapy Industry Volume (K Unit) Forecast, by Application 2019 & 2032
- Table 41: Australia Cancer Immunotherapy Industry Revenue (Million) Forecast, by Application 2019 & 2032
- Table 42: Australia Cancer Immunotherapy Industry Volume (K Unit) Forecast, by Application 2019 & 2032
- Table 43: South Korea Cancer Immunotherapy Industry Revenue (Million) Forecast, by Application 2019 & 2032
- Table 44: South Korea Cancer Immunotherapy Industry Volume (K Unit) Forecast, by Application 2019 & 2032
- Table 45: Rest of Asia Pacific Cancer Immunotherapy Industry Revenue (Million) Forecast, by Application 2019 & 2032
- Table 46: Rest of Asia Pacific Cancer Immunotherapy Industry Volume (K Unit) Forecast, by Application 2019 & 2032
- Table 47: Global Cancer Immunotherapy Industry Revenue Million Forecast, by Country 2019 & 2032
- Table 48: Global Cancer Immunotherapy Industry Volume K Unit Forecast, by Country 2019 & 2032
- Table 49: GCC Cancer Immunotherapy Industry Revenue (Million) Forecast, by Application 2019 & 2032
- Table 50: GCC Cancer Immunotherapy Industry Volume (K Unit) Forecast, by Application 2019 & 2032
- Table 51: South Africa Cancer Immunotherapy Industry Revenue (Million) Forecast, by Application 2019 & 2032
- Table 52: South Africa Cancer Immunotherapy Industry Volume (K Unit) Forecast, by Application 2019 & 2032
- Table 53: Rest of Middle East and Africa Cancer Immunotherapy Industry Revenue (Million) Forecast, by Application 2019 & 2032
- Table 54: Rest of Middle East and Africa Cancer Immunotherapy Industry Volume (K Unit) Forecast, by Application 2019 & 2032
- Table 55: Global Cancer Immunotherapy Industry Revenue Million Forecast, by Country 2019 & 2032
- Table 56: Global Cancer Immunotherapy Industry Volume K Unit Forecast, by Country 2019 & 2032
- Table 57: Brazil Cancer Immunotherapy Industry Revenue (Million) Forecast, by Application 2019 & 2032
- Table 58: Brazil Cancer Immunotherapy Industry Volume (K Unit) Forecast, by Application 2019 & 2032
- Table 59: Argentina Cancer Immunotherapy Industry Revenue (Million) Forecast, by Application 2019 & 2032
- Table 60: Argentina Cancer Immunotherapy Industry Volume (K Unit) Forecast, by Application 2019 & 2032
- Table 61: Rest of South America Cancer Immunotherapy Industry Revenue (Million) Forecast, by Application 2019 & 2032
- Table 62: Rest of South America Cancer Immunotherapy Industry Volume (K Unit) Forecast, by Application 2019 & 2032
- Table 63: Global Cancer Immunotherapy Industry Revenue Million Forecast, by Therapy Type 2019 & 2032
- Table 64: Global Cancer Immunotherapy Industry Volume K Unit Forecast, by Therapy Type 2019 & 2032
- Table 65: Global Cancer Immunotherapy Industry Revenue Million Forecast, by Application 2019 & 2032
- Table 66: Global Cancer Immunotherapy Industry Volume K Unit Forecast, by Application 2019 & 2032
- Table 67: Global Cancer Immunotherapy Industry Revenue Million Forecast, by End Users 2019 & 2032
- Table 68: Global Cancer Immunotherapy Industry Volume K Unit Forecast, by End Users 2019 & 2032
- Table 69: Global Cancer Immunotherapy Industry Revenue Million Forecast, by Country 2019 & 2032
- Table 70: Global Cancer Immunotherapy Industry Volume K Unit Forecast, by Country 2019 & 2032
- Table 71: United States Cancer Immunotherapy Industry Revenue (Million) Forecast, by Application 2019 & 2032
- Table 72: United States Cancer Immunotherapy Industry Volume (K Unit) Forecast, by Application 2019 & 2032
- Table 73: Canada Cancer Immunotherapy Industry Revenue (Million) Forecast, by Application 2019 & 2032
- Table 74: Canada Cancer Immunotherapy Industry Volume (K Unit) Forecast, by Application 2019 & 2032
- Table 75: Mexico Cancer Immunotherapy Industry Revenue (Million) Forecast, by Application 2019 & 2032
- Table 76: Mexico Cancer Immunotherapy Industry Volume (K Unit) Forecast, by Application 2019 & 2032
- Table 77: Global Cancer Immunotherapy Industry Revenue Million Forecast, by Therapy Type 2019 & 2032
- Table 78: Global Cancer Immunotherapy Industry Volume K Unit Forecast, by Therapy Type 2019 & 2032
- Table 79: Global Cancer Immunotherapy Industry Revenue Million Forecast, by Application 2019 & 2032
- Table 80: Global Cancer Immunotherapy Industry Volume K Unit Forecast, by Application 2019 & 2032
- Table 81: Global Cancer Immunotherapy Industry Revenue Million Forecast, by End Users 2019 & 2032
- Table 82: Global Cancer Immunotherapy Industry Volume K Unit Forecast, by End Users 2019 & 2032
- Table 83: Global Cancer Immunotherapy Industry Revenue Million Forecast, by Country 2019 & 2032
- Table 84: Global Cancer Immunotherapy Industry Volume K Unit Forecast, by Country 2019 & 2032
- Table 85: Germany Cancer Immunotherapy Industry Revenue (Million) Forecast, by Application 2019 & 2032
- Table 86: Germany Cancer Immunotherapy Industry Volume (K Unit) Forecast, by Application 2019 & 2032
- Table 87: United Kingdom Cancer Immunotherapy Industry Revenue (Million) Forecast, by Application 2019 & 2032
- Table 88: United Kingdom Cancer Immunotherapy Industry Volume (K Unit) Forecast, by Application 2019 & 2032
- Table 89: France Cancer Immunotherapy Industry Revenue (Million) Forecast, by Application 2019 & 2032
- Table 90: France Cancer Immunotherapy Industry Volume (K Unit) Forecast, by Application 2019 & 2032
- Table 91: Italy Cancer Immunotherapy Industry Revenue (Million) Forecast, by Application 2019 & 2032
- Table 92: Italy Cancer Immunotherapy Industry Volume (K Unit) Forecast, by Application 2019 & 2032
- Table 93: Spain Cancer Immunotherapy Industry Revenue (Million) Forecast, by Application 2019 & 2032
- Table 94: Spain Cancer Immunotherapy Industry Volume (K Unit) Forecast, by Application 2019 & 2032
- Table 95: Rest of Europe Cancer Immunotherapy Industry Revenue (Million) Forecast, by Application 2019 & 2032
- Table 96: Rest of Europe Cancer Immunotherapy Industry Volume (K Unit) Forecast, by Application 2019 & 2032
- Table 97: Global Cancer Immunotherapy Industry Revenue Million Forecast, by Therapy Type 2019 & 2032
- Table 98: Global Cancer Immunotherapy Industry Volume K Unit Forecast, by Therapy Type 2019 & 2032
- Table 99: Global Cancer Immunotherapy Industry Revenue Million Forecast, by Application 2019 & 2032
- Table 100: Global Cancer Immunotherapy Industry Volume K Unit Forecast, by Application 2019 & 2032
- Table 101: Global Cancer Immunotherapy Industry Revenue Million Forecast, by End Users 2019 & 2032
- Table 102: Global Cancer Immunotherapy Industry Volume K Unit Forecast, by End Users 2019 & 2032
- Table 103: Global Cancer Immunotherapy Industry Revenue Million Forecast, by Country 2019 & 2032
- Table 104: Global Cancer Immunotherapy Industry Volume K Unit Forecast, by Country 2019 & 2032
- Table 105: China Cancer Immunotherapy Industry Revenue (Million) Forecast, by Application 2019 & 2032
- Table 106: China Cancer Immunotherapy Industry Volume (K Unit) Forecast, by Application 2019 & 2032
- Table 107: Japan Cancer Immunotherapy Industry Revenue (Million) Forecast, by Application 2019 & 2032
- Table 108: Japan Cancer Immunotherapy Industry Volume (K Unit) Forecast, by Application 2019 & 2032
- Table 109: India Cancer Immunotherapy Industry Revenue (Million) Forecast, by Application 2019 & 2032
- Table 110: India Cancer Immunotherapy Industry Volume (K Unit) Forecast, by Application 2019 & 2032
- Table 111: Australia Cancer Immunotherapy Industry Revenue (Million) Forecast, by Application 2019 & 2032
- Table 112: Australia Cancer Immunotherapy Industry Volume (K Unit) Forecast, by Application 2019 & 2032
- Table 113: South Korea Cancer Immunotherapy Industry Revenue (Million) Forecast, by Application 2019 & 2032
- Table 114: South Korea Cancer Immunotherapy Industry Volume (K Unit) Forecast, by Application 2019 & 2032
- Table 115: Rest of Asia Pacific Cancer Immunotherapy Industry Revenue (Million) Forecast, by Application 2019 & 2032
- Table 116: Rest of Asia Pacific Cancer Immunotherapy Industry Volume (K Unit) Forecast, by Application 2019 & 2032
- Table 117: Global Cancer Immunotherapy Industry Revenue Million Forecast, by Therapy Type 2019 & 2032
- Table 118: Global Cancer Immunotherapy Industry Volume K Unit Forecast, by Therapy Type 2019 & 2032
- Table 119: Global Cancer Immunotherapy Industry Revenue Million Forecast, by Application 2019 & 2032
- Table 120: Global Cancer Immunotherapy Industry Volume K Unit Forecast, by Application 2019 & 2032
- Table 121: Global Cancer Immunotherapy Industry Revenue Million Forecast, by End Users 2019 & 2032
- Table 122: Global Cancer Immunotherapy Industry Volume K Unit Forecast, by End Users 2019 & 2032
- Table 123: Global Cancer Immunotherapy Industry Revenue Million Forecast, by Country 2019 & 2032
- Table 124: Global Cancer Immunotherapy Industry Volume K Unit Forecast, by Country 2019 & 2032
- Table 125: GCC Cancer Immunotherapy Industry Revenue (Million) Forecast, by Application 2019 & 2032
- Table 126: GCC Cancer Immunotherapy Industry Volume (K Unit) Forecast, by Application 2019 & 2032
- Table 127: South Africa Cancer Immunotherapy Industry Revenue (Million) Forecast, by Application 2019 & 2032
- Table 128: South Africa Cancer Immunotherapy Industry Volume (K Unit) Forecast, by Application 2019 & 2032
- Table 129: Rest of Middle East and Africa Cancer Immunotherapy Industry Revenue (Million) Forecast, by Application 2019 & 2032
- Table 130: Rest of Middle East and Africa Cancer Immunotherapy Industry Volume (K Unit) Forecast, by Application 2019 & 2032
- Table 131: Global Cancer Immunotherapy Industry Revenue Million Forecast, by Therapy Type 2019 & 2032
- Table 132: Global Cancer Immunotherapy Industry Volume K Unit Forecast, by Therapy Type 2019 & 2032
- Table 133: Global Cancer Immunotherapy Industry Revenue Million Forecast, by Application 2019 & 2032
- Table 134: Global Cancer Immunotherapy Industry Volume K Unit Forecast, by Application 2019 & 2032
- Table 135: Global Cancer Immunotherapy Industry Revenue Million Forecast, by End Users 2019 & 2032
- Table 136: Global Cancer Immunotherapy Industry Volume K Unit Forecast, by End Users 2019 & 2032
- Table 137: Global Cancer Immunotherapy Industry Revenue Million Forecast, by Country 2019 & 2032
- Table 138: Global Cancer Immunotherapy Industry Volume K Unit Forecast, by Country 2019 & 2032
- Table 139: Brazil Cancer Immunotherapy Industry Revenue (Million) Forecast, by Application 2019 & 2032
- Table 140: Brazil Cancer Immunotherapy Industry Volume (K Unit) Forecast, by Application 2019 & 2032
- Table 141: Argentina Cancer Immunotherapy Industry Revenue (Million) Forecast, by Application 2019 & 2032
- Table 142: Argentina Cancer Immunotherapy Industry Volume (K Unit) Forecast, by Application 2019 & 2032
- Table 143: Rest of South America Cancer Immunotherapy Industry Revenue (Million) Forecast, by Application 2019 & 2032
- Table 144: Rest of South America Cancer Immunotherapy Industry Volume (K Unit) Forecast, by Application 2019 & 2032
Frequently Asked Questions
1. What is the projected Compound Annual Growth Rate (CAGR) of the Cancer Immunotherapy Industry?
The projected CAGR is approximately 9.10%.
2. Which companies are prominent players in the Cancer Immunotherapy Industry?
Key companies in the market include Bayer AG, Novartis AG, Astellas Pharma Inc, Amgen Inc, Gilead Sciences, OSE Immunotherapeutics, Seattle Genetics Inc, AstraZeneca PLC, Eli Lilly and Company, Bristol-Myers Squibb, Merck and Co Inc, GlaxoSmithKline PLC, F Hoffman La Roche Ltd, Pfizer Inc.
3. What are the main segments of the Cancer Immunotherapy Industry?
The market segments include Therapy Type, Application, End Users.
4. Can you provide details about the market size?
The market size is estimated to be USD XX Million as of 2022.
5. What are some drivers contributing to market growth?
Rising R&D Activities; Increasing Effectivity and Accuracy Of Newer Therapies; Growing Prevalence of Cancer.
6. What are the notable trends driving market growth?
Breast Cancer Segment Expected to Hold a Major Share in the Cancer Immunotherapy Market.
7. Are there any restraints impacting market growth?
High Cost Coupled with Expensive Development; Stringent Regulatory Factors.
8. Can you provide examples of recent developments in the market?
N/A
9. What pricing options are available for accessing the report?
Pricing options include single-user, multi-user, and enterprise licenses priced at USD 4750, USD 5250, and USD 8750 respectively.
10. Is the market size provided in terms of value or volume?
The market size is provided in terms of value, measured in Million and volume, measured in K Unit.
11. Are there any specific market keywords associated with the report?
Yes, the market keyword associated with the report is "Cancer Immunotherapy Industry," which aids in identifying and referencing the specific market segment covered.
12. How do I determine which pricing option suits my needs best?
The pricing options vary based on user requirements and access needs. Individual users may opt for single-user licenses, while businesses requiring broader access may choose multi-user or enterprise licenses for cost-effective access to the report.
13. Are there any additional resources or data provided in the Cancer Immunotherapy Industry report?
While the report offers comprehensive insights, it's advisable to review the specific contents or supplementary materials provided to ascertain if additional resources or data are available.
14. How can I stay updated on further developments or reports in the Cancer Immunotherapy Industry?
To stay informed about further developments, trends, and reports in the Cancer Immunotherapy Industry, consider subscribing to industry newsletters, following relevant companies and organizations, or regularly checking reputable industry news sources and publications.
Methodology
Step 1 - Identification of Relevant Samples Size from Population Database


Step 2 - Approaches for Defining Global Market Size (Value, Volume* & Price*)

Note*: In applicable scenarios
Step 3 - Data Sources
Primary Research
- Web Analytics
- Survey Reports
- Research Institute
- Latest Research Reports
- Opinion Leaders
Secondary Research
- Annual Reports
- White Paper
- Latest Press Release
- Industry Association
- Paid Database
- Investor Presentations

Step 4 - Data Triangulation
Involves using different sources of information in order to increase the validity of a study
These sources are likely to be stakeholders in a program - participants, other researchers, program staff, other community members, and so on.
Then we put all data in single framework & apply various statistical tools to find out the dynamic on the market.
During the analysis stage, feedback from the stakeholder groups would be compared to determine areas of agreement as well as areas of divergence


