
Key Insights
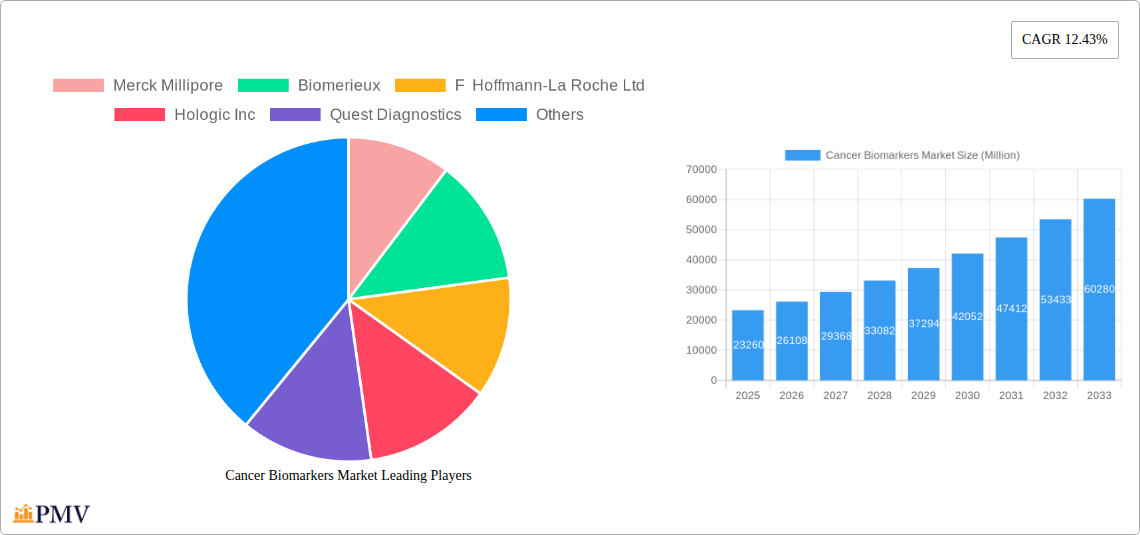
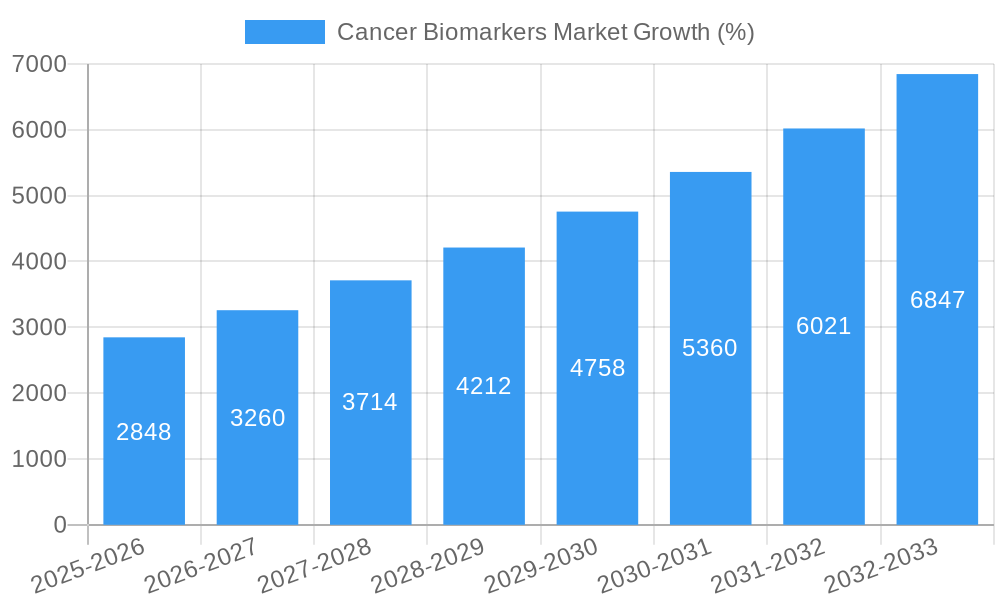
The global cancer biomarkers market, valued at $23.26 billion in 2025, is projected to experience robust growth, driven by a confluence of factors. The rising incidence of cancer globally, coupled with advancements in diagnostic technologies and a growing understanding of the role of biomarkers in early detection and personalized medicine, are key drivers. The increasing adoption of OMICS technologies, such as genomics and proteomics, for biomarker discovery and validation is significantly fueling market expansion. Furthermore, the shift towards personalized cancer treatment, requiring precise biomarker profiling to tailor therapies, contributes to the market's upward trajectory. Technological advancements in immunoassays and imaging technologies are also playing crucial roles in enhancing the accuracy and efficiency of biomarker analysis, further stimulating market growth. While regulatory hurdles and high costs associated with biomarker development and testing present some challenges, the overall market outlook remains positive, with significant growth potential across various segments including prostate, breast, lung, and colorectal cancers.
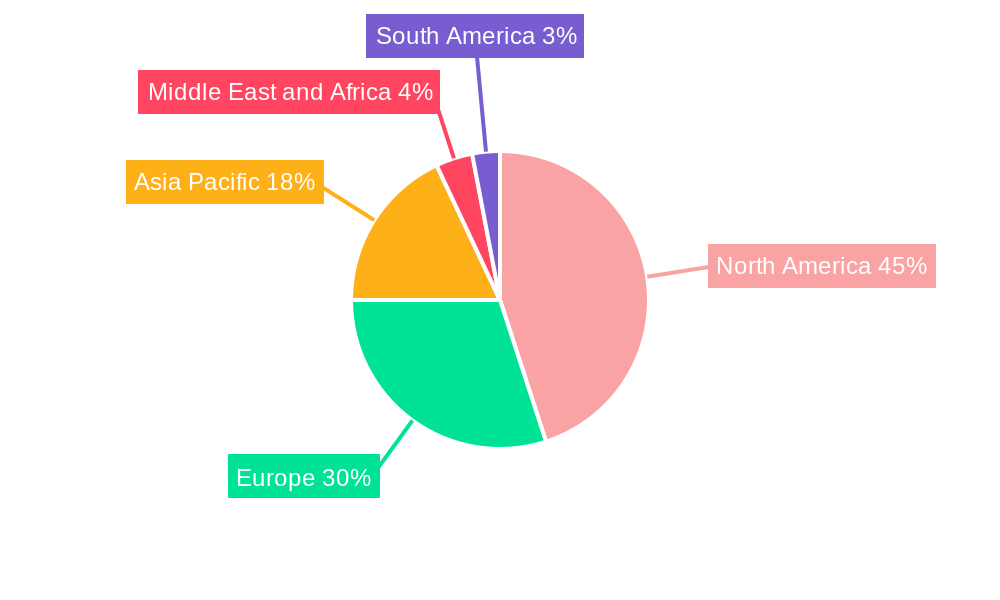
The market segmentation reveals a diverse landscape. Protein biomarkers currently hold a substantial market share, but genetic biomarkers are experiencing rapid growth due to their potential for early disease detection and prognosis. Similarly, OMICS technologies dominate the profiling technology segment, though the adoption of imaging technologies is steadily increasing, particularly in applications like imaging mass spectrometry. Geographically, North America and Europe currently command a significant portion of the market, driven by advanced healthcare infrastructure and high healthcare expenditure. However, rapidly developing economies in Asia Pacific, especially China and India, are poised to witness substantial growth in the coming years, presenting lucrative opportunities for market players. The forecast period (2025-2033) anticipates a sustained CAGR of 12.43%, indicating a substantial market expansion across all segments and regions. Competition among established players like Merck Millipore, Biomerieux, Roche, and Illumina, alongside emerging companies, is expected to remain intense, spurring innovation and driving down costs.
Cancer Biomarkers Market: A Comprehensive Market Research Report (2019-2033)
This comprehensive report provides an in-depth analysis of the global Cancer Biomarkers Market, offering valuable insights for stakeholders across the industry. Covering the period from 2019 to 2033, with a base year of 2025 and a forecast period of 2025-2033, this report meticulously examines market dynamics, competitive landscapes, and future growth prospects. The study includes detailed segmentation by disease type, biomarker type, and profiling technology, providing a granular understanding of market opportunities. Key players like Merck Millipore, Biomerieux, F. Hoffmann-La Roche Ltd, Hologic Inc, Quest Diagnostics, Qiagen, Thermo Fisher Scientific, Illumina Inc, Abbott Laboratories Inc, and Agilent Technologies are analyzed for their market strategies and competitive positioning.
Cancer Biomarkers Market Structure & Competitive Dynamics
The Cancer Biomarkers Market exhibits a moderately consolidated structure with a few dominant players and several smaller niche players. The market is characterized by intense competition driven by continuous innovation, strategic mergers and acquisitions (M&A), and the introduction of novel biomarker technologies. Regulatory frameworks, particularly those related to diagnostic testing and approval processes, significantly impact market dynamics. The market witnesses considerable R&D investment by both large pharmaceutical companies and smaller biotech firms. End-user trends, especially the increasing adoption of personalized medicine approaches, are key drivers.
- Market Concentration: The top 5 players hold an estimated xx% market share in 2025, indicating moderate consolidation.
- Innovation Ecosystems: Significant collaboration between pharmaceutical companies, biotechnology firms, and research institutions drives innovation.
- Regulatory Frameworks: Stringent regulatory approvals for new biomarkers impact market entry and growth, particularly in regions with stricter guidelines.
- Product Substitutes: The availability of alternative diagnostic methods and therapies may create competitive pressures.
- M&A Activities: The market has witnessed significant M&A activity in recent years, with deal values exceeding xx Million in the historical period (2019-2024). These transactions have primarily focused on acquiring companies with promising biomarker technologies or expanding market reach. Examples include (specific examples to be added based on available data).
- End-User Trends: The increasing demand for personalized medicine and early cancer detection is a primary market driver.
Cancer Biomarkers Market Industry Trends & Insights
The Cancer Biomarkers Market is experiencing robust growth, projected to reach xx Million by 2033, driven by several factors. Technological advancements, particularly in genomics and proteomics, are enabling the discovery and development of new biomarkers. The rising prevalence of cancer globally, coupled with increased awareness and earlier diagnosis, is boosting demand for accurate and reliable diagnostic tests. The market is also witnessing a shift towards non-invasive diagnostic methods and point-of-care testing, improving accessibility and convenience. However, high costs associated with biomarker development and testing remain a significant barrier to market penetration, especially in low- and middle-income countries. The market is also characterized by competitive pricing strategies and the constant emergence of new technologies. The compound annual growth rate (CAGR) during the forecast period (2025-2033) is estimated to be xx%. Market penetration for advanced biomarker technologies such as liquid biopsies is slowly increasing, although adoption remains limited due to high costs and limited clinical trial data.
Dominant Markets & Segments in Cancer Biomarkers Market
- By Disease: Prostate cancer, breast cancer, and lung cancer are dominant segments, driven by high prevalence and significant research focus.
- Key Drivers: Increased awareness, improved screening methods, and advancements in diagnostic technologies.
- By Type: Protein biomarkers and genetic biomarkers dominate the market, reflecting the established usage and technological advancements in these areas.
- Dominance Analysis: Protein biomarkers currently hold the larger market share, but genetic biomarkers are projected for higher growth due to advances in next-generation sequencing (NGS).
- By Profiling Technology: OMICS technology, particularly genomics and proteomics, is the leading segment owing to its comprehensive approach. Immunoassays hold a significant market share due to widespread adoption in clinical settings.
- Key Drivers: Technological advancements in OMICS, accessibility and cost-effectiveness of immunoassays.
Cancer Biomarkers Market Product Innovations
Significant advancements in biomarker technology are shaping the market. Next-generation sequencing (NGS) platforms provide highly sensitive and specific detection of multiple biomarkers simultaneously. Liquid biopsies are gaining traction due to their minimally invasive nature, facilitating early and repeated cancer monitoring. Development of novel multiplex assays and improved data analytics tools are enhancing the efficiency and accuracy of cancer biomarker analysis. The market is witnessing increasing focus on the development of biomarkers for early detection, prognosis, and personalized treatment selection. These innovations are improving clinical decision-making and patient outcomes, driving market growth.
Report Segmentation & Scope
This report segments the Cancer Biomarkers Market comprehensively:
- By Disease: Prostate, Breast, Lung, Colorectal, Cervical, and Other Cancers, each with its market size projection (xx Million for each segment in 2025). Prostate and breast cancers hold significant market share driven by higher prevalence rates.
- By Type: Protein Biomarkers (xx Million in 2025), Genetic Biomarkers (xx Million in 2025), and Other Types (xx Million in 2025) showing different growth trajectories based on technological advancements and market adoption.
- By Profiling Technology: OMICS Technology (xx Million in 2025), Imaging Technology (xx Million in 2025), Immunoassays (xx Million in 2025), and Others (xx Million in 2025), each having unique market dynamics related to technology maturity and cost-effectiveness. OMICS is poised for rapid growth.
Key Drivers of Cancer Biomarkers Market Growth
The Cancer Biomarkers Market is propelled by the rising global cancer burden, increasing demand for personalized medicine, advancements in diagnostic technologies, expanding research and development activities, and supportive government initiatives. Stringent regulatory approvals and increasing healthcare spending also contribute to market expansion. The development of non-invasive testing methods and improved reimbursement policies are further accelerating market growth.
Challenges in the Cancer Biomarkers Market Sector
The Cancer Biomarkers Market faces challenges such as stringent regulatory approvals which can lead to delays in product launches. The high cost of biomarker development and testing, particularly for advanced technologies like NGS, limits market penetration. The complexity of biomarker interpretation and the need for skilled personnel also pose barriers to wider adoption. Furthermore, competition from established diagnostic techniques and the emergence of new technologies create continuous pressure on market players. The global supply chain issues and fluctuations in raw material prices present further challenges.
Leading Players in the Cancer Biomarkers Market
- Merck Millipore
- Biomerieux
- F. Hoffmann-La Roche Ltd
- Hologic Inc
- Quest Diagnostics
- Qiagen
- Thermo Fisher Scientific
- Illumina Inc
- Abbott Laboratories Inc
- Agilent Technologies
Key Developments in Cancer Biomarkers Market Sector
- February 2022: OncoDNA launched the OncoDEEP Solid Tumor Biomarker Test Kit, providing labs with a comprehensive NGS solution. This expands access to advanced diagnostic capabilities, increasing market competition.
- June 2022: Nonagen Bioscience received CE marking for its Oncuria immunoassay for bladder cancer, offering a novel urine-based test. This innovation caters to a significant unmet need, driving market growth in early detection.
Strategic Cancer Biomarkers Market Outlook
The Cancer Biomarkers Market presents significant growth opportunities, particularly in emerging markets with increasing cancer prevalence and growing healthcare infrastructure. The focus on personalized medicine, the development of innovative diagnostic tools, and the expanding scope of biomarker applications in drug development will drive future market growth. Strategic partnerships, collaborations, and further M&A activity are anticipated, shaping the competitive landscape and accelerating technological advancements. The market's long-term outlook is positive, driven by continuous innovation and increasing demand for early cancer detection and treatment.
Cancer Biomarkers Market Segmentation
-
1. Disease
- 1.1. Prostate Cancer
- 1.2. Breast Cancer
- 1.3. Lung Cancer
- 1.4. Colorectal Cancer
- 1.5. Cervical Cancer
- 1.6. Other Diseases
-
2. Type
- 2.1. Protein Biomarkers
- 2.2. Genetic Biomarkers
- 2.3. Other Types
-
3. Profiling Technology
- 3.1. OMICS Technology
- 3.2. Imaging Technology
- 3.3. Immunoassays
- 3.4. Others
Cancer Biomarkers Market Segmentation By Geography
-
1. North America
- 1.1. United States
- 1.2. Canada
- 1.3. Mexico
-
2. Europe
- 2.1. Germany
- 2.2. United Kingdom
- 2.3. France
- 2.4. Italy
- 2.5. Spain
- 2.6. Rest of Europe
-
3. Asia Pacific
- 3.1. China
- 3.2. Japan
- 3.3. India
- 3.4. Australia
- 3.5. South Korea
- 3.6. Rest of Asia Pacific
-
4. Middle East and Africa
- 4.1. GCC
- 4.2. South Africa
- 4.3. Rest of Middle East and Africa
-
5. South America
- 5.1. Brazil
- 5.2. Argentina
- 5.3. Rest of South America
Cancer Biomarkers Market REPORT HIGHLIGHTS
| Aspects | Details |
|---|---|
| Study Period | 2019-2033 |
| Base Year | 2024 |
| Estimated Year | 2025 |
| Forecast Period | 2025-2033 |
| Historical Period | 2019-2024 |
| Growth Rate | CAGR of 12.43% from 2019-2033 |
| Segmentation |
|
Table of Contents
- 1. Introduction
- 1.1. Research Scope
- 1.2. Market Segmentation
- 1.3. Research Methodology
- 1.4. Definitions and Assumptions
- 2. Executive Summary
- 2.1. Introduction
- 3. Market Dynamics
- 3.1. Introduction
- 3.2. Market Drivers
- 3.2.1. Surge in Prevalence of Cancer Across the Globe; Paradigm Shift in Healthcare from Disease Diagnosis to Risk Assessment or Early Diagnosis; Increasing Focus on Innovative Drug Development
- 3.3. Market Restrains
- 3.3.1. High Cost of Cancer Diagnosis with Biomarkers; Reimbursement Issues with Biomarker Testing
- 3.4. Market Trends
- 3.4.1. Lung Cancer Segment is Expected to Hold a Significant Market Share in the Cancer Biomarkers Market
- 4. Market Factor Analysis
- 4.1. Porters Five Forces
- 4.2. Supply/Value Chain
- 4.3. PESTEL analysis
- 4.4. Market Entropy
- 4.5. Patent/Trademark Analysis
- 5. Global Cancer Biomarkers Market Analysis, Insights and Forecast, 2019-2031
- 5.1. Market Analysis, Insights and Forecast - by Disease
- 5.1.1. Prostate Cancer
- 5.1.2. Breast Cancer
- 5.1.3. Lung Cancer
- 5.1.4. Colorectal Cancer
- 5.1.5. Cervical Cancer
- 5.1.6. Other Diseases
- 5.2. Market Analysis, Insights and Forecast - by Type
- 5.2.1. Protein Biomarkers
- 5.2.2. Genetic Biomarkers
- 5.2.3. Other Types
- 5.3. Market Analysis, Insights and Forecast - by Profiling Technology
- 5.3.1. OMICS Technology
- 5.3.2. Imaging Technology
- 5.3.3. Immunoassays
- 5.3.4. Others
- 5.4. Market Analysis, Insights and Forecast - by Region
- 5.4.1. North America
- 5.4.2. Europe
- 5.4.3. Asia Pacific
- 5.4.4. Middle East and Africa
- 5.4.5. South America
- 5.1. Market Analysis, Insights and Forecast - by Disease
- 6. North America Cancer Biomarkers Market Analysis, Insights and Forecast, 2019-2031
- 6.1. Market Analysis, Insights and Forecast - by Disease
- 6.1.1. Prostate Cancer
- 6.1.2. Breast Cancer
- 6.1.3. Lung Cancer
- 6.1.4. Colorectal Cancer
- 6.1.5. Cervical Cancer
- 6.1.6. Other Diseases
- 6.2. Market Analysis, Insights and Forecast - by Type
- 6.2.1. Protein Biomarkers
- 6.2.2. Genetic Biomarkers
- 6.2.3. Other Types
- 6.3. Market Analysis, Insights and Forecast - by Profiling Technology
- 6.3.1. OMICS Technology
- 6.3.2. Imaging Technology
- 6.3.3. Immunoassays
- 6.3.4. Others
- 6.1. Market Analysis, Insights and Forecast - by Disease
- 7. Europe Cancer Biomarkers Market Analysis, Insights and Forecast, 2019-2031
- 7.1. Market Analysis, Insights and Forecast - by Disease
- 7.1.1. Prostate Cancer
- 7.1.2. Breast Cancer
- 7.1.3. Lung Cancer
- 7.1.4. Colorectal Cancer
- 7.1.5. Cervical Cancer
- 7.1.6. Other Diseases
- 7.2. Market Analysis, Insights and Forecast - by Type
- 7.2.1. Protein Biomarkers
- 7.2.2. Genetic Biomarkers
- 7.2.3. Other Types
- 7.3. Market Analysis, Insights and Forecast - by Profiling Technology
- 7.3.1. OMICS Technology
- 7.3.2. Imaging Technology
- 7.3.3. Immunoassays
- 7.3.4. Others
- 7.1. Market Analysis, Insights and Forecast - by Disease
- 8. Asia Pacific Cancer Biomarkers Market Analysis, Insights and Forecast, 2019-2031
- 8.1. Market Analysis, Insights and Forecast - by Disease
- 8.1.1. Prostate Cancer
- 8.1.2. Breast Cancer
- 8.1.3. Lung Cancer
- 8.1.4. Colorectal Cancer
- 8.1.5. Cervical Cancer
- 8.1.6. Other Diseases
- 8.2. Market Analysis, Insights and Forecast - by Type
- 8.2.1. Protein Biomarkers
- 8.2.2. Genetic Biomarkers
- 8.2.3. Other Types
- 8.3. Market Analysis, Insights and Forecast - by Profiling Technology
- 8.3.1. OMICS Technology
- 8.3.2. Imaging Technology
- 8.3.3. Immunoassays
- 8.3.4. Others
- 8.1. Market Analysis, Insights and Forecast - by Disease
- 9. Middle East and Africa Cancer Biomarkers Market Analysis, Insights and Forecast, 2019-2031
- 9.1. Market Analysis, Insights and Forecast - by Disease
- 9.1.1. Prostate Cancer
- 9.1.2. Breast Cancer
- 9.1.3. Lung Cancer
- 9.1.4. Colorectal Cancer
- 9.1.5. Cervical Cancer
- 9.1.6. Other Diseases
- 9.2. Market Analysis, Insights and Forecast - by Type
- 9.2.1. Protein Biomarkers
- 9.2.2. Genetic Biomarkers
- 9.2.3. Other Types
- 9.3. Market Analysis, Insights and Forecast - by Profiling Technology
- 9.3.1. OMICS Technology
- 9.3.2. Imaging Technology
- 9.3.3. Immunoassays
- 9.3.4. Others
- 9.1. Market Analysis, Insights and Forecast - by Disease
- 10. South America Cancer Biomarkers Market Analysis, Insights and Forecast, 2019-2031
- 10.1. Market Analysis, Insights and Forecast - by Disease
- 10.1.1. Prostate Cancer
- 10.1.2. Breast Cancer
- 10.1.3. Lung Cancer
- 10.1.4. Colorectal Cancer
- 10.1.5. Cervical Cancer
- 10.1.6. Other Diseases
- 10.2. Market Analysis, Insights and Forecast - by Type
- 10.2.1. Protein Biomarkers
- 10.2.2. Genetic Biomarkers
- 10.2.3. Other Types
- 10.3. Market Analysis, Insights and Forecast - by Profiling Technology
- 10.3.1. OMICS Technology
- 10.3.2. Imaging Technology
- 10.3.3. Immunoassays
- 10.3.4. Others
- 10.1. Market Analysis, Insights and Forecast - by Disease
- 11. North America Cancer Biomarkers Market Analysis, Insights and Forecast, 2019-2031
- 11.1. Market Analysis, Insights and Forecast - By Country/Sub-region
- 11.1.1 United States
- 11.1.2 Canada
- 11.1.3 Mexico
- 12. Europe Cancer Biomarkers Market Analysis, Insights and Forecast, 2019-2031
- 12.1. Market Analysis, Insights and Forecast - By Country/Sub-region
- 12.1.1 Germany
- 12.1.2 United Kingdom
- 12.1.3 France
- 12.1.4 Italy
- 12.1.5 Spain
- 12.1.6 Rest of Europe
- 13. Asia Pacific Cancer Biomarkers Market Analysis, Insights and Forecast, 2019-2031
- 13.1. Market Analysis, Insights and Forecast - By Country/Sub-region
- 13.1.1 China
- 13.1.2 Japan
- 13.1.3 India
- 13.1.4 Australia
- 13.1.5 South Korea
- 13.1.6 Rest of Asia Pacific
- 14. Middle East and Africa Cancer Biomarkers Market Analysis, Insights and Forecast, 2019-2031
- 14.1. Market Analysis, Insights and Forecast - By Country/Sub-region
- 14.1.1 GCC
- 14.1.2 South Africa
- 14.1.3 Rest of Middle East and Africa
- 15. South America Cancer Biomarkers Market Analysis, Insights and Forecast, 2019-2031
- 15.1. Market Analysis, Insights and Forecast - By Country/Sub-region
- 15.1.1 Brazil
- 15.1.2 Argentina
- 15.1.3 Rest of South America
- 16. Competitive Analysis
- 16.1. Global Market Share Analysis 2024
- 16.2. Company Profiles
- 16.2.1 Merck Millipore
- 16.2.1.1. Overview
- 16.2.1.2. Products
- 16.2.1.3. SWOT Analysis
- 16.2.1.4. Recent Developments
- 16.2.1.5. Financials (Based on Availability)
- 16.2.2 Biomerieux
- 16.2.2.1. Overview
- 16.2.2.2. Products
- 16.2.2.3. SWOT Analysis
- 16.2.2.4. Recent Developments
- 16.2.2.5. Financials (Based on Availability)
- 16.2.3 F Hoffmann-La Roche Ltd
- 16.2.3.1. Overview
- 16.2.3.2. Products
- 16.2.3.3. SWOT Analysis
- 16.2.3.4. Recent Developments
- 16.2.3.5. Financials (Based on Availability)
- 16.2.4 Hologic Inc
- 16.2.4.1. Overview
- 16.2.4.2. Products
- 16.2.4.3. SWOT Analysis
- 16.2.4.4. Recent Developments
- 16.2.4.5. Financials (Based on Availability)
- 16.2.5 Quest Diagnostics
- 16.2.5.1. Overview
- 16.2.5.2. Products
- 16.2.5.3. SWOT Analysis
- 16.2.5.4. Recent Developments
- 16.2.5.5. Financials (Based on Availability)
- 16.2.6 Qiagen
- 16.2.6.1. Overview
- 16.2.6.2. Products
- 16.2.6.3. SWOT Analysis
- 16.2.6.4. Recent Developments
- 16.2.6.5. Financials (Based on Availability)
- 16.2.7 Thermo Fisher Scientific
- 16.2.7.1. Overview
- 16.2.7.2. Products
- 16.2.7.3. SWOT Analysis
- 16.2.7.4. Recent Developments
- 16.2.7.5. Financials (Based on Availability)
- 16.2.8 Illumina Inc
- 16.2.8.1. Overview
- 16.2.8.2. Products
- 16.2.8.3. SWOT Analysis
- 16.2.8.4. Recent Developments
- 16.2.8.5. Financials (Based on Availability)
- 16.2.9 Abbott Laboratories Inc
- 16.2.9.1. Overview
- 16.2.9.2. Products
- 16.2.9.3. SWOT Analysis
- 16.2.9.4. Recent Developments
- 16.2.9.5. Financials (Based on Availability)
- 16.2.10 Agilent Technologies
- 16.2.10.1. Overview
- 16.2.10.2. Products
- 16.2.10.3. SWOT Analysis
- 16.2.10.4. Recent Developments
- 16.2.10.5. Financials (Based on Availability)
- 16.2.1 Merck Millipore
List of Figures
- Figure 1: Global Cancer Biomarkers Market Revenue Breakdown (Million, %) by Region 2024 & 2032
- Figure 2: Global Cancer Biomarkers Market Volume Breakdown (K Unit, %) by Region 2024 & 2032
- Figure 3: North America Cancer Biomarkers Market Revenue (Million), by Country 2024 & 2032
- Figure 4: North America Cancer Biomarkers Market Volume (K Unit), by Country 2024 & 2032
- Figure 5: North America Cancer Biomarkers Market Revenue Share (%), by Country 2024 & 2032
- Figure 6: North America Cancer Biomarkers Market Volume Share (%), by Country 2024 & 2032
- Figure 7: Europe Cancer Biomarkers Market Revenue (Million), by Country 2024 & 2032
- Figure 8: Europe Cancer Biomarkers Market Volume (K Unit), by Country 2024 & 2032
- Figure 9: Europe Cancer Biomarkers Market Revenue Share (%), by Country 2024 & 2032
- Figure 10: Europe Cancer Biomarkers Market Volume Share (%), by Country 2024 & 2032
- Figure 11: Asia Pacific Cancer Biomarkers Market Revenue (Million), by Country 2024 & 2032
- Figure 12: Asia Pacific Cancer Biomarkers Market Volume (K Unit), by Country 2024 & 2032
- Figure 13: Asia Pacific Cancer Biomarkers Market Revenue Share (%), by Country 2024 & 2032
- Figure 14: Asia Pacific Cancer Biomarkers Market Volume Share (%), by Country 2024 & 2032
- Figure 15: Middle East and Africa Cancer Biomarkers Market Revenue (Million), by Country 2024 & 2032
- Figure 16: Middle East and Africa Cancer Biomarkers Market Volume (K Unit), by Country 2024 & 2032
- Figure 17: Middle East and Africa Cancer Biomarkers Market Revenue Share (%), by Country 2024 & 2032
- Figure 18: Middle East and Africa Cancer Biomarkers Market Volume Share (%), by Country 2024 & 2032
- Figure 19: South America Cancer Biomarkers Market Revenue (Million), by Country 2024 & 2032
- Figure 20: South America Cancer Biomarkers Market Volume (K Unit), by Country 2024 & 2032
- Figure 21: South America Cancer Biomarkers Market Revenue Share (%), by Country 2024 & 2032
- Figure 22: South America Cancer Biomarkers Market Volume Share (%), by Country 2024 & 2032
- Figure 23: North America Cancer Biomarkers Market Revenue (Million), by Disease 2024 & 2032
- Figure 24: North America Cancer Biomarkers Market Volume (K Unit), by Disease 2024 & 2032
- Figure 25: North America Cancer Biomarkers Market Revenue Share (%), by Disease 2024 & 2032
- Figure 26: North America Cancer Biomarkers Market Volume Share (%), by Disease 2024 & 2032
- Figure 27: North America Cancer Biomarkers Market Revenue (Million), by Type 2024 & 2032
- Figure 28: North America Cancer Biomarkers Market Volume (K Unit), by Type 2024 & 2032
- Figure 29: North America Cancer Biomarkers Market Revenue Share (%), by Type 2024 & 2032
- Figure 30: North America Cancer Biomarkers Market Volume Share (%), by Type 2024 & 2032
- Figure 31: North America Cancer Biomarkers Market Revenue (Million), by Profiling Technology 2024 & 2032
- Figure 32: North America Cancer Biomarkers Market Volume (K Unit), by Profiling Technology 2024 & 2032
- Figure 33: North America Cancer Biomarkers Market Revenue Share (%), by Profiling Technology 2024 & 2032
- Figure 34: North America Cancer Biomarkers Market Volume Share (%), by Profiling Technology 2024 & 2032
- Figure 35: North America Cancer Biomarkers Market Revenue (Million), by Country 2024 & 2032
- Figure 36: North America Cancer Biomarkers Market Volume (K Unit), by Country 2024 & 2032
- Figure 37: North America Cancer Biomarkers Market Revenue Share (%), by Country 2024 & 2032
- Figure 38: North America Cancer Biomarkers Market Volume Share (%), by Country 2024 & 2032
- Figure 39: Europe Cancer Biomarkers Market Revenue (Million), by Disease 2024 & 2032
- Figure 40: Europe Cancer Biomarkers Market Volume (K Unit), by Disease 2024 & 2032
- Figure 41: Europe Cancer Biomarkers Market Revenue Share (%), by Disease 2024 & 2032
- Figure 42: Europe Cancer Biomarkers Market Volume Share (%), by Disease 2024 & 2032
- Figure 43: Europe Cancer Biomarkers Market Revenue (Million), by Type 2024 & 2032
- Figure 44: Europe Cancer Biomarkers Market Volume (K Unit), by Type 2024 & 2032
- Figure 45: Europe Cancer Biomarkers Market Revenue Share (%), by Type 2024 & 2032
- Figure 46: Europe Cancer Biomarkers Market Volume Share (%), by Type 2024 & 2032
- Figure 47: Europe Cancer Biomarkers Market Revenue (Million), by Profiling Technology 2024 & 2032
- Figure 48: Europe Cancer Biomarkers Market Volume (K Unit), by Profiling Technology 2024 & 2032
- Figure 49: Europe Cancer Biomarkers Market Revenue Share (%), by Profiling Technology 2024 & 2032
- Figure 50: Europe Cancer Biomarkers Market Volume Share (%), by Profiling Technology 2024 & 2032
- Figure 51: Europe Cancer Biomarkers Market Revenue (Million), by Country 2024 & 2032
- Figure 52: Europe Cancer Biomarkers Market Volume (K Unit), by Country 2024 & 2032
- Figure 53: Europe Cancer Biomarkers Market Revenue Share (%), by Country 2024 & 2032
- Figure 54: Europe Cancer Biomarkers Market Volume Share (%), by Country 2024 & 2032
- Figure 55: Asia Pacific Cancer Biomarkers Market Revenue (Million), by Disease 2024 & 2032
- Figure 56: Asia Pacific Cancer Biomarkers Market Volume (K Unit), by Disease 2024 & 2032
- Figure 57: Asia Pacific Cancer Biomarkers Market Revenue Share (%), by Disease 2024 & 2032
- Figure 58: Asia Pacific Cancer Biomarkers Market Volume Share (%), by Disease 2024 & 2032
- Figure 59: Asia Pacific Cancer Biomarkers Market Revenue (Million), by Type 2024 & 2032
- Figure 60: Asia Pacific Cancer Biomarkers Market Volume (K Unit), by Type 2024 & 2032
- Figure 61: Asia Pacific Cancer Biomarkers Market Revenue Share (%), by Type 2024 & 2032
- Figure 62: Asia Pacific Cancer Biomarkers Market Volume Share (%), by Type 2024 & 2032
- Figure 63: Asia Pacific Cancer Biomarkers Market Revenue (Million), by Profiling Technology 2024 & 2032
- Figure 64: Asia Pacific Cancer Biomarkers Market Volume (K Unit), by Profiling Technology 2024 & 2032
- Figure 65: Asia Pacific Cancer Biomarkers Market Revenue Share (%), by Profiling Technology 2024 & 2032
- Figure 66: Asia Pacific Cancer Biomarkers Market Volume Share (%), by Profiling Technology 2024 & 2032
- Figure 67: Asia Pacific Cancer Biomarkers Market Revenue (Million), by Country 2024 & 2032
- Figure 68: Asia Pacific Cancer Biomarkers Market Volume (K Unit), by Country 2024 & 2032
- Figure 69: Asia Pacific Cancer Biomarkers Market Revenue Share (%), by Country 2024 & 2032
- Figure 70: Asia Pacific Cancer Biomarkers Market Volume Share (%), by Country 2024 & 2032
- Figure 71: Middle East and Africa Cancer Biomarkers Market Revenue (Million), by Disease 2024 & 2032
- Figure 72: Middle East and Africa Cancer Biomarkers Market Volume (K Unit), by Disease 2024 & 2032
- Figure 73: Middle East and Africa Cancer Biomarkers Market Revenue Share (%), by Disease 2024 & 2032
- Figure 74: Middle East and Africa Cancer Biomarkers Market Volume Share (%), by Disease 2024 & 2032
- Figure 75: Middle East and Africa Cancer Biomarkers Market Revenue (Million), by Type 2024 & 2032
- Figure 76: Middle East and Africa Cancer Biomarkers Market Volume (K Unit), by Type 2024 & 2032
- Figure 77: Middle East and Africa Cancer Biomarkers Market Revenue Share (%), by Type 2024 & 2032
- Figure 78: Middle East and Africa Cancer Biomarkers Market Volume Share (%), by Type 2024 & 2032
- Figure 79: Middle East and Africa Cancer Biomarkers Market Revenue (Million), by Profiling Technology 2024 & 2032
- Figure 80: Middle East and Africa Cancer Biomarkers Market Volume (K Unit), by Profiling Technology 2024 & 2032
- Figure 81: Middle East and Africa Cancer Biomarkers Market Revenue Share (%), by Profiling Technology 2024 & 2032
- Figure 82: Middle East and Africa Cancer Biomarkers Market Volume Share (%), by Profiling Technology 2024 & 2032
- Figure 83: Middle East and Africa Cancer Biomarkers Market Revenue (Million), by Country 2024 & 2032
- Figure 84: Middle East and Africa Cancer Biomarkers Market Volume (K Unit), by Country 2024 & 2032
- Figure 85: Middle East and Africa Cancer Biomarkers Market Revenue Share (%), by Country 2024 & 2032
- Figure 86: Middle East and Africa Cancer Biomarkers Market Volume Share (%), by Country 2024 & 2032
- Figure 87: South America Cancer Biomarkers Market Revenue (Million), by Disease 2024 & 2032
- Figure 88: South America Cancer Biomarkers Market Volume (K Unit), by Disease 2024 & 2032
- Figure 89: South America Cancer Biomarkers Market Revenue Share (%), by Disease 2024 & 2032
- Figure 90: South America Cancer Biomarkers Market Volume Share (%), by Disease 2024 & 2032
- Figure 91: South America Cancer Biomarkers Market Revenue (Million), by Type 2024 & 2032
- Figure 92: South America Cancer Biomarkers Market Volume (K Unit), by Type 2024 & 2032
- Figure 93: South America Cancer Biomarkers Market Revenue Share (%), by Type 2024 & 2032
- Figure 94: South America Cancer Biomarkers Market Volume Share (%), by Type 2024 & 2032
- Figure 95: South America Cancer Biomarkers Market Revenue (Million), by Profiling Technology 2024 & 2032
- Figure 96: South America Cancer Biomarkers Market Volume (K Unit), by Profiling Technology 2024 & 2032
- Figure 97: South America Cancer Biomarkers Market Revenue Share (%), by Profiling Technology 2024 & 2032
- Figure 98: South America Cancer Biomarkers Market Volume Share (%), by Profiling Technology 2024 & 2032
- Figure 99: South America Cancer Biomarkers Market Revenue (Million), by Country 2024 & 2032
- Figure 100: South America Cancer Biomarkers Market Volume (K Unit), by Country 2024 & 2032
- Figure 101: South America Cancer Biomarkers Market Revenue Share (%), by Country 2024 & 2032
- Figure 102: South America Cancer Biomarkers Market Volume Share (%), by Country 2024 & 2032
List of Tables
- Table 1: Global Cancer Biomarkers Market Revenue Million Forecast, by Region 2019 & 2032
- Table 2: Global Cancer Biomarkers Market Volume K Unit Forecast, by Region 2019 & 2032
- Table 3: Global Cancer Biomarkers Market Revenue Million Forecast, by Disease 2019 & 2032
- Table 4: Global Cancer Biomarkers Market Volume K Unit Forecast, by Disease 2019 & 2032
- Table 5: Global Cancer Biomarkers Market Revenue Million Forecast, by Type 2019 & 2032
- Table 6: Global Cancer Biomarkers Market Volume K Unit Forecast, by Type 2019 & 2032
- Table 7: Global Cancer Biomarkers Market Revenue Million Forecast, by Profiling Technology 2019 & 2032
- Table 8: Global Cancer Biomarkers Market Volume K Unit Forecast, by Profiling Technology 2019 & 2032
- Table 9: Global Cancer Biomarkers Market Revenue Million Forecast, by Region 2019 & 2032
- Table 10: Global Cancer Biomarkers Market Volume K Unit Forecast, by Region 2019 & 2032
- Table 11: Global Cancer Biomarkers Market Revenue Million Forecast, by Country 2019 & 2032
- Table 12: Global Cancer Biomarkers Market Volume K Unit Forecast, by Country 2019 & 2032
- Table 13: United States Cancer Biomarkers Market Revenue (Million) Forecast, by Application 2019 & 2032
- Table 14: United States Cancer Biomarkers Market Volume (K Unit) Forecast, by Application 2019 & 2032
- Table 15: Canada Cancer Biomarkers Market Revenue (Million) Forecast, by Application 2019 & 2032
- Table 16: Canada Cancer Biomarkers Market Volume (K Unit) Forecast, by Application 2019 & 2032
- Table 17: Mexico Cancer Biomarkers Market Revenue (Million) Forecast, by Application 2019 & 2032
- Table 18: Mexico Cancer Biomarkers Market Volume (K Unit) Forecast, by Application 2019 & 2032
- Table 19: Global Cancer Biomarkers Market Revenue Million Forecast, by Country 2019 & 2032
- Table 20: Global Cancer Biomarkers Market Volume K Unit Forecast, by Country 2019 & 2032
- Table 21: Germany Cancer Biomarkers Market Revenue (Million) Forecast, by Application 2019 & 2032
- Table 22: Germany Cancer Biomarkers Market Volume (K Unit) Forecast, by Application 2019 & 2032
- Table 23: United Kingdom Cancer Biomarkers Market Revenue (Million) Forecast, by Application 2019 & 2032
- Table 24: United Kingdom Cancer Biomarkers Market Volume (K Unit) Forecast, by Application 2019 & 2032
- Table 25: France Cancer Biomarkers Market Revenue (Million) Forecast, by Application 2019 & 2032
- Table 26: France Cancer Biomarkers Market Volume (K Unit) Forecast, by Application 2019 & 2032
- Table 27: Italy Cancer Biomarkers Market Revenue (Million) Forecast, by Application 2019 & 2032
- Table 28: Italy Cancer Biomarkers Market Volume (K Unit) Forecast, by Application 2019 & 2032
- Table 29: Spain Cancer Biomarkers Market Revenue (Million) Forecast, by Application 2019 & 2032
- Table 30: Spain Cancer Biomarkers Market Volume (K Unit) Forecast, by Application 2019 & 2032
- Table 31: Rest of Europe Cancer Biomarkers Market Revenue (Million) Forecast, by Application 2019 & 2032
- Table 32: Rest of Europe Cancer Biomarkers Market Volume (K Unit) Forecast, by Application 2019 & 2032
- Table 33: Global Cancer Biomarkers Market Revenue Million Forecast, by Country 2019 & 2032
- Table 34: Global Cancer Biomarkers Market Volume K Unit Forecast, by Country 2019 & 2032
- Table 35: China Cancer Biomarkers Market Revenue (Million) Forecast, by Application 2019 & 2032
- Table 36: China Cancer Biomarkers Market Volume (K Unit) Forecast, by Application 2019 & 2032
- Table 37: Japan Cancer Biomarkers Market Revenue (Million) Forecast, by Application 2019 & 2032
- Table 38: Japan Cancer Biomarkers Market Volume (K Unit) Forecast, by Application 2019 & 2032
- Table 39: India Cancer Biomarkers Market Revenue (Million) Forecast, by Application 2019 & 2032
- Table 40: India Cancer Biomarkers Market Volume (K Unit) Forecast, by Application 2019 & 2032
- Table 41: Australia Cancer Biomarkers Market Revenue (Million) Forecast, by Application 2019 & 2032
- Table 42: Australia Cancer Biomarkers Market Volume (K Unit) Forecast, by Application 2019 & 2032
- Table 43: South Korea Cancer Biomarkers Market Revenue (Million) Forecast, by Application 2019 & 2032
- Table 44: South Korea Cancer Biomarkers Market Volume (K Unit) Forecast, by Application 2019 & 2032
- Table 45: Rest of Asia Pacific Cancer Biomarkers Market Revenue (Million) Forecast, by Application 2019 & 2032
- Table 46: Rest of Asia Pacific Cancer Biomarkers Market Volume (K Unit) Forecast, by Application 2019 & 2032
- Table 47: Global Cancer Biomarkers Market Revenue Million Forecast, by Country 2019 & 2032
- Table 48: Global Cancer Biomarkers Market Volume K Unit Forecast, by Country 2019 & 2032
- Table 49: GCC Cancer Biomarkers Market Revenue (Million) Forecast, by Application 2019 & 2032
- Table 50: GCC Cancer Biomarkers Market Volume (K Unit) Forecast, by Application 2019 & 2032
- Table 51: South Africa Cancer Biomarkers Market Revenue (Million) Forecast, by Application 2019 & 2032
- Table 52: South Africa Cancer Biomarkers Market Volume (K Unit) Forecast, by Application 2019 & 2032
- Table 53: Rest of Middle East and Africa Cancer Biomarkers Market Revenue (Million) Forecast, by Application 2019 & 2032
- Table 54: Rest of Middle East and Africa Cancer Biomarkers Market Volume (K Unit) Forecast, by Application 2019 & 2032
- Table 55: Global Cancer Biomarkers Market Revenue Million Forecast, by Country 2019 & 2032
- Table 56: Global Cancer Biomarkers Market Volume K Unit Forecast, by Country 2019 & 2032
- Table 57: Brazil Cancer Biomarkers Market Revenue (Million) Forecast, by Application 2019 & 2032
- Table 58: Brazil Cancer Biomarkers Market Volume (K Unit) Forecast, by Application 2019 & 2032
- Table 59: Argentina Cancer Biomarkers Market Revenue (Million) Forecast, by Application 2019 & 2032
- Table 60: Argentina Cancer Biomarkers Market Volume (K Unit) Forecast, by Application 2019 & 2032
- Table 61: Rest of South America Cancer Biomarkers Market Revenue (Million) Forecast, by Application 2019 & 2032
- Table 62: Rest of South America Cancer Biomarkers Market Volume (K Unit) Forecast, by Application 2019 & 2032
- Table 63: Global Cancer Biomarkers Market Revenue Million Forecast, by Disease 2019 & 2032
- Table 64: Global Cancer Biomarkers Market Volume K Unit Forecast, by Disease 2019 & 2032
- Table 65: Global Cancer Biomarkers Market Revenue Million Forecast, by Type 2019 & 2032
- Table 66: Global Cancer Biomarkers Market Volume K Unit Forecast, by Type 2019 & 2032
- Table 67: Global Cancer Biomarkers Market Revenue Million Forecast, by Profiling Technology 2019 & 2032
- Table 68: Global Cancer Biomarkers Market Volume K Unit Forecast, by Profiling Technology 2019 & 2032
- Table 69: Global Cancer Biomarkers Market Revenue Million Forecast, by Country 2019 & 2032
- Table 70: Global Cancer Biomarkers Market Volume K Unit Forecast, by Country 2019 & 2032
- Table 71: United States Cancer Biomarkers Market Revenue (Million) Forecast, by Application 2019 & 2032
- Table 72: United States Cancer Biomarkers Market Volume (K Unit) Forecast, by Application 2019 & 2032
- Table 73: Canada Cancer Biomarkers Market Revenue (Million) Forecast, by Application 2019 & 2032
- Table 74: Canada Cancer Biomarkers Market Volume (K Unit) Forecast, by Application 2019 & 2032
- Table 75: Mexico Cancer Biomarkers Market Revenue (Million) Forecast, by Application 2019 & 2032
- Table 76: Mexico Cancer Biomarkers Market Volume (K Unit) Forecast, by Application 2019 & 2032
- Table 77: Global Cancer Biomarkers Market Revenue Million Forecast, by Disease 2019 & 2032
- Table 78: Global Cancer Biomarkers Market Volume K Unit Forecast, by Disease 2019 & 2032
- Table 79: Global Cancer Biomarkers Market Revenue Million Forecast, by Type 2019 & 2032
- Table 80: Global Cancer Biomarkers Market Volume K Unit Forecast, by Type 2019 & 2032
- Table 81: Global Cancer Biomarkers Market Revenue Million Forecast, by Profiling Technology 2019 & 2032
- Table 82: Global Cancer Biomarkers Market Volume K Unit Forecast, by Profiling Technology 2019 & 2032
- Table 83: Global Cancer Biomarkers Market Revenue Million Forecast, by Country 2019 & 2032
- Table 84: Global Cancer Biomarkers Market Volume K Unit Forecast, by Country 2019 & 2032
- Table 85: Germany Cancer Biomarkers Market Revenue (Million) Forecast, by Application 2019 & 2032
- Table 86: Germany Cancer Biomarkers Market Volume (K Unit) Forecast, by Application 2019 & 2032
- Table 87: United Kingdom Cancer Biomarkers Market Revenue (Million) Forecast, by Application 2019 & 2032
- Table 88: United Kingdom Cancer Biomarkers Market Volume (K Unit) Forecast, by Application 2019 & 2032
- Table 89: France Cancer Biomarkers Market Revenue (Million) Forecast, by Application 2019 & 2032
- Table 90: France Cancer Biomarkers Market Volume (K Unit) Forecast, by Application 2019 & 2032
- Table 91: Italy Cancer Biomarkers Market Revenue (Million) Forecast, by Application 2019 & 2032
- Table 92: Italy Cancer Biomarkers Market Volume (K Unit) Forecast, by Application 2019 & 2032
- Table 93: Spain Cancer Biomarkers Market Revenue (Million) Forecast, by Application 2019 & 2032
- Table 94: Spain Cancer Biomarkers Market Volume (K Unit) Forecast, by Application 2019 & 2032
- Table 95: Rest of Europe Cancer Biomarkers Market Revenue (Million) Forecast, by Application 2019 & 2032
- Table 96: Rest of Europe Cancer Biomarkers Market Volume (K Unit) Forecast, by Application 2019 & 2032
- Table 97: Global Cancer Biomarkers Market Revenue Million Forecast, by Disease 2019 & 2032
- Table 98: Global Cancer Biomarkers Market Volume K Unit Forecast, by Disease 2019 & 2032
- Table 99: Global Cancer Biomarkers Market Revenue Million Forecast, by Type 2019 & 2032
- Table 100: Global Cancer Biomarkers Market Volume K Unit Forecast, by Type 2019 & 2032
- Table 101: Global Cancer Biomarkers Market Revenue Million Forecast, by Profiling Technology 2019 & 2032
- Table 102: Global Cancer Biomarkers Market Volume K Unit Forecast, by Profiling Technology 2019 & 2032
- Table 103: Global Cancer Biomarkers Market Revenue Million Forecast, by Country 2019 & 2032
- Table 104: Global Cancer Biomarkers Market Volume K Unit Forecast, by Country 2019 & 2032
- Table 105: China Cancer Biomarkers Market Revenue (Million) Forecast, by Application 2019 & 2032
- Table 106: China Cancer Biomarkers Market Volume (K Unit) Forecast, by Application 2019 & 2032
- Table 107: Japan Cancer Biomarkers Market Revenue (Million) Forecast, by Application 2019 & 2032
- Table 108: Japan Cancer Biomarkers Market Volume (K Unit) Forecast, by Application 2019 & 2032
- Table 109: India Cancer Biomarkers Market Revenue (Million) Forecast, by Application 2019 & 2032
- Table 110: India Cancer Biomarkers Market Volume (K Unit) Forecast, by Application 2019 & 2032
- Table 111: Australia Cancer Biomarkers Market Revenue (Million) Forecast, by Application 2019 & 2032
- Table 112: Australia Cancer Biomarkers Market Volume (K Unit) Forecast, by Application 2019 & 2032
- Table 113: South Korea Cancer Biomarkers Market Revenue (Million) Forecast, by Application 2019 & 2032
- Table 114: South Korea Cancer Biomarkers Market Volume (K Unit) Forecast, by Application 2019 & 2032
- Table 115: Rest of Asia Pacific Cancer Biomarkers Market Revenue (Million) Forecast, by Application 2019 & 2032
- Table 116: Rest of Asia Pacific Cancer Biomarkers Market Volume (K Unit) Forecast, by Application 2019 & 2032
- Table 117: Global Cancer Biomarkers Market Revenue Million Forecast, by Disease 2019 & 2032
- Table 118: Global Cancer Biomarkers Market Volume K Unit Forecast, by Disease 2019 & 2032
- Table 119: Global Cancer Biomarkers Market Revenue Million Forecast, by Type 2019 & 2032
- Table 120: Global Cancer Biomarkers Market Volume K Unit Forecast, by Type 2019 & 2032
- Table 121: Global Cancer Biomarkers Market Revenue Million Forecast, by Profiling Technology 2019 & 2032
- Table 122: Global Cancer Biomarkers Market Volume K Unit Forecast, by Profiling Technology 2019 & 2032
- Table 123: Global Cancer Biomarkers Market Revenue Million Forecast, by Country 2019 & 2032
- Table 124: Global Cancer Biomarkers Market Volume K Unit Forecast, by Country 2019 & 2032
- Table 125: GCC Cancer Biomarkers Market Revenue (Million) Forecast, by Application 2019 & 2032
- Table 126: GCC Cancer Biomarkers Market Volume (K Unit) Forecast, by Application 2019 & 2032
- Table 127: South Africa Cancer Biomarkers Market Revenue (Million) Forecast, by Application 2019 & 2032
- Table 128: South Africa Cancer Biomarkers Market Volume (K Unit) Forecast, by Application 2019 & 2032
- Table 129: Rest of Middle East and Africa Cancer Biomarkers Market Revenue (Million) Forecast, by Application 2019 & 2032
- Table 130: Rest of Middle East and Africa Cancer Biomarkers Market Volume (K Unit) Forecast, by Application 2019 & 2032
- Table 131: Global Cancer Biomarkers Market Revenue Million Forecast, by Disease 2019 & 2032
- Table 132: Global Cancer Biomarkers Market Volume K Unit Forecast, by Disease 2019 & 2032
- Table 133: Global Cancer Biomarkers Market Revenue Million Forecast, by Type 2019 & 2032
- Table 134: Global Cancer Biomarkers Market Volume K Unit Forecast, by Type 2019 & 2032
- Table 135: Global Cancer Biomarkers Market Revenue Million Forecast, by Profiling Technology 2019 & 2032
- Table 136: Global Cancer Biomarkers Market Volume K Unit Forecast, by Profiling Technology 2019 & 2032
- Table 137: Global Cancer Biomarkers Market Revenue Million Forecast, by Country 2019 & 2032
- Table 138: Global Cancer Biomarkers Market Volume K Unit Forecast, by Country 2019 & 2032
- Table 139: Brazil Cancer Biomarkers Market Revenue (Million) Forecast, by Application 2019 & 2032
- Table 140: Brazil Cancer Biomarkers Market Volume (K Unit) Forecast, by Application 2019 & 2032
- Table 141: Argentina Cancer Biomarkers Market Revenue (Million) Forecast, by Application 2019 & 2032
- Table 142: Argentina Cancer Biomarkers Market Volume (K Unit) Forecast, by Application 2019 & 2032
- Table 143: Rest of South America Cancer Biomarkers Market Revenue (Million) Forecast, by Application 2019 & 2032
- Table 144: Rest of South America Cancer Biomarkers Market Volume (K Unit) Forecast, by Application 2019 & 2032
Frequently Asked Questions
1. What is the projected Compound Annual Growth Rate (CAGR) of the Cancer Biomarkers Market?
The projected CAGR is approximately 12.43%.
2. Which companies are prominent players in the Cancer Biomarkers Market?
Key companies in the market include Merck Millipore, Biomerieux, F Hoffmann-La Roche Ltd, Hologic Inc, Quest Diagnostics, Qiagen, Thermo Fisher Scientific, Illumina Inc, Abbott Laboratories Inc, Agilent Technologies.
3. What are the main segments of the Cancer Biomarkers Market?
The market segments include Disease, Type, Profiling Technology.
4. Can you provide details about the market size?
The market size is estimated to be USD 23.26 Million as of 2022.
5. What are some drivers contributing to market growth?
Surge in Prevalence of Cancer Across the Globe; Paradigm Shift in Healthcare from Disease Diagnosis to Risk Assessment or Early Diagnosis; Increasing Focus on Innovative Drug Development.
6. What are the notable trends driving market growth?
Lung Cancer Segment is Expected to Hold a Significant Market Share in the Cancer Biomarkers Market.
7. Are there any restraints impacting market growth?
High Cost of Cancer Diagnosis with Biomarkers; Reimbursement Issues with Biomarker Testing.
8. Can you provide examples of recent developments in the market?
February 2022: OncoDNA introduced the OncoDEEP Solid Tumor Biomarker Test Kit. The OncoDEEP kit, which includes Twist Bioscience's enrichment and library preparation solutions, will give labs a complete and reliable solution for performing comprehensive NGS analysis of tumor samples.
9. What pricing options are available for accessing the report?
Pricing options include single-user, multi-user, and enterprise licenses priced at USD 4750, USD 5250, and USD 8750 respectively.
10. Is the market size provided in terms of value or volume?
The market size is provided in terms of value, measured in Million and volume, measured in K Unit.
11. Are there any specific market keywords associated with the report?
Yes, the market keyword associated with the report is "Cancer Biomarkers Market," which aids in identifying and referencing the specific market segment covered.
12. How do I determine which pricing option suits my needs best?
The pricing options vary based on user requirements and access needs. Individual users may opt for single-user licenses, while businesses requiring broader access may choose multi-user or enterprise licenses for cost-effective access to the report.
13. Are there any additional resources or data provided in the Cancer Biomarkers Market report?
While the report offers comprehensive insights, it's advisable to review the specific contents or supplementary materials provided to ascertain if additional resources or data are available.
14. How can I stay updated on further developments or reports in the Cancer Biomarkers Market?
To stay informed about further developments, trends, and reports in the Cancer Biomarkers Market, consider subscribing to industry newsletters, following relevant companies and organizations, or regularly checking reputable industry news sources and publications.
Methodology
Step 1 - Identification of Relevant Samples Size from Population Database


Step 2 - Approaches for Defining Global Market Size (Value, Volume* & Price*)

Note*: In applicable scenarios
Step 3 - Data Sources
Primary Research
- Web Analytics
- Survey Reports
- Research Institute
- Latest Research Reports
- Opinion Leaders
Secondary Research
- Annual Reports
- White Paper
- Latest Press Release
- Industry Association
- Paid Database
- Investor Presentations

Step 4 - Data Triangulation
Involves using different sources of information in order to increase the validity of a study
These sources are likely to be stakeholders in a program - participants, other researchers, program staff, other community members, and so on.
Then we put all data in single framework & apply various statistical tools to find out the dynamic on the market.
During the analysis stage, feedback from the stakeholder groups would be compared to determine areas of agreement as well as areas of divergence


