
Key Insights
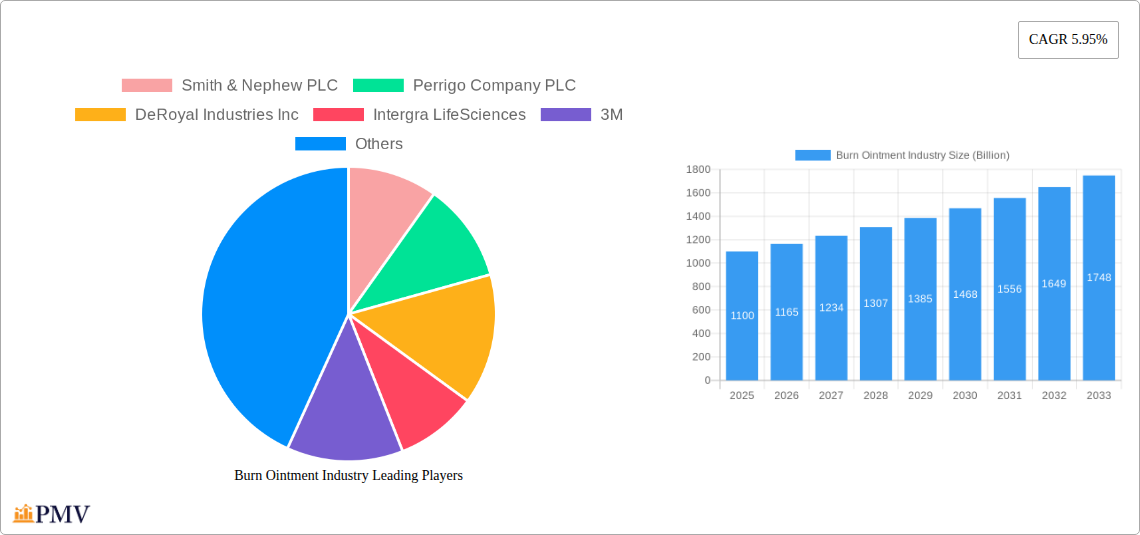
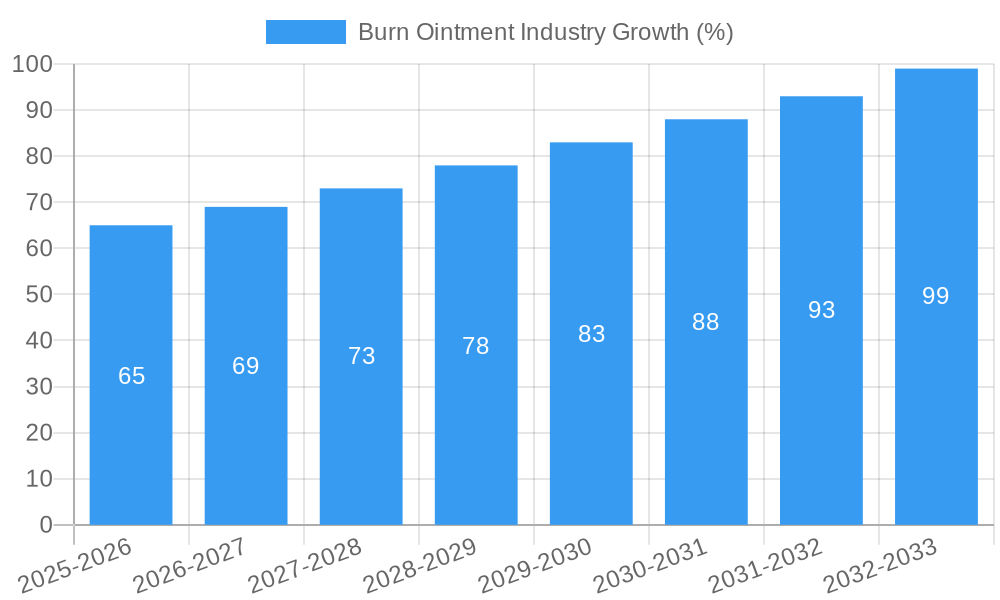
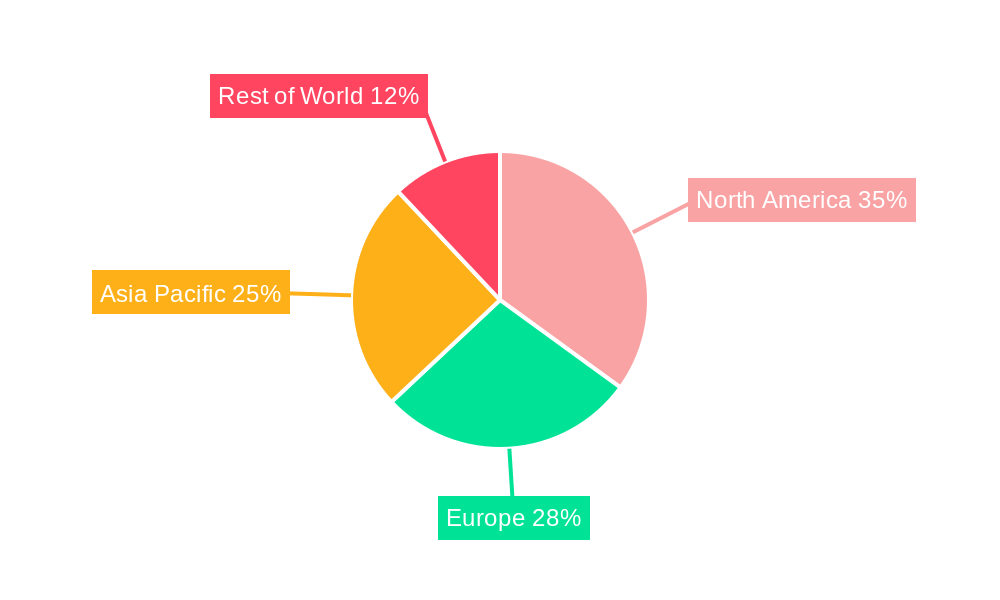
The global burn ointment market, valued at $1.1 billion in 2025, is projected to experience robust growth, driven by a compound annual growth rate (CAGR) of 5.95% from 2025 to 2033. This expansion is fueled by several key factors. The increasing incidence of burns due to accidents, industrial mishaps, and natural disasters contributes significantly to market demand. Furthermore, advancements in burn treatment, leading to the development of more effective and less-irritating ointments with quicker healing times, are driving adoption. The rising prevalence of chronic wounds, alongside an aging global population more susceptible to burn injuries, further bolsters market growth. The market is segmented by product type (topical antibiotics, silver, iodine), burn depth (minor, partial thickness, full thickness), and end-user (hospitals & clinics, other). Hospitals and clinics represent a major share of the market due to their extensive burn treatment facilities and high patient volumes. The preference for advanced formulations with faster healing properties and minimal side effects is shaping product innovation and market competition among key players such as Smith & Nephew, Perrigo, DeRoyal, Integra, 3M, and ConvaTec. Geographic variations in burn incidence rates and healthcare infrastructure influence regional market share. North America and Europe currently hold significant market shares, but the Asia-Pacific region is anticipated to witness substantial growth due to increasing awareness, rising disposable incomes, and improving healthcare infrastructure.
The competitive landscape is characterized by both established multinational corporations and regional players. Established players leverage their extensive distribution networks and brand recognition to maintain market leadership, while smaller companies focus on innovation and niche product development to gain market share. However, stringent regulatory approvals and the potential for adverse reactions associated with certain ointment formulations pose challenges to market growth. The future of the burn ointment market hinges on continued innovation in product formulations, expansion into emerging markets, and strategic collaborations to enhance access to effective burn care globally. The market is expected to witness further consolidation through mergers and acquisitions as companies strive to enhance their product portfolios and geographic reach. Successful strategies will include a focus on targeted marketing efforts towards healthcare professionals and increased patient education on proper burn wound management.
Burn Ointment Industry: A Comprehensive Market Report (2019-2033)
This detailed report provides a comprehensive analysis of the global burn ointment market, projecting a market value of Billion USD by 2033. The study covers the period from 2019 to 2033, with 2025 serving as the base and estimated year. The report meticulously examines market structure, competitive dynamics, key trends, and future growth prospects, offering actionable insights for industry stakeholders.
Burn Ointment Industry Market Structure & Competitive Dynamics
The burn ointment market exhibits a moderately concentrated structure, with several multinational pharmaceutical giants and regional players vying for market share. Key players like Smith & Nephew PLC, Perrigo Company PLC, 3M, ConvaTec Group PLC, Johnson & Johnson, and Pfizer Inc. hold significant market share, estimated at xx Billion USD collectively in 2025. However, smaller, specialized companies are also emerging, leveraging innovation and niche product offerings.
The market's innovation ecosystem thrives on advancements in wound healing technologies, particularly in formulating burn ointments with improved efficacy, reduced side effects, and enhanced patient comfort. Stringent regulatory frameworks, varying across regions, heavily influence product approvals and market access. Substitutes such as advanced wound dressings and other topical treatments pose competitive pressure. End-user preferences are increasingly shifting toward products with faster healing times and reduced scarring. M&A activities, while not rampant, have played a role in consolidating market share, with deal values averaging xx Billion USD annually over the historical period (2019-2024). The following points highlight these dynamic elements:
- Market Concentration: Moderate concentration, with major players commanding a significant portion.
- Innovation: Focus on improved efficacy, reduced side effects, and enhanced patient comfort.
- Regulatory Landscape: Stringent regulations influence product approvals and market access.
- Substitutes: Competition from advanced wound dressings and other topical treatments.
- End-User Trends: Preference for faster healing and reduced scarring.
- M&A Activity: Moderate level of consolidation, with average deal values of xx Billion USD annually (2019-2024).
Burn Ointment Industry Trends & Insights
The global burn ointment market is projected to experience significant growth, with a Compound Annual Growth Rate (CAGR) of xx% during the forecast period (2025-2033). This growth is fueled by several factors including: rising incidence of burns due to accidents and other causes; increasing awareness of advanced burn treatment modalities; technological advancements in burn ointment formulations; and expanding healthcare infrastructure in developing economies. Market penetration in developing nations remains relatively low, presenting a substantial opportunity for expansion. Technological disruptions, including the development of nanotechnology-based ointments and improved drug delivery systems, are expected to further accelerate market growth. Consumer preferences are driving the demand for ointments with minimal side effects and faster healing times. Competitive dynamics are characterized by intense rivalry amongst established players and the emergence of new entrants offering innovative products. The market's continued growth relies heavily on innovation and successful adaptation to evolving consumer needs.
Dominant Markets & Segments in Burn Ointment Industry
The North American region currently dominates the burn ointment market, driven by factors such as high healthcare expenditure, advanced healthcare infrastructure, and a relatively higher incidence of burn injuries. Within product types, Silver-based ointments currently hold the largest market share due to their broad-spectrum antimicrobial properties and effectiveness in treating various burn depths. Partial thickness burns constitute the largest segment by depth of burn, contributing to approximately xx Billion USD in 2025. Hospitals and Clinics remain the primary end-users, accounting for the largest market segment.
Key Drivers for North American Dominance:
- High healthcare expenditure
- Advanced healthcare infrastructure
- Higher incidence of burn injuries
Dominant Segments:
- By Product Type: Silver-based ointments
- By Depth of Burn: Partial thickness burns
- By End User: Hospitals and Clinics
Further detailed analysis will include market size projections for all segments for 2025 and beyond.
Burn Ointment Industry Product Innovations
Recent years have witnessed significant advancements in burn ointment formulations, including the incorporation of novel antimicrobial agents, improved drug delivery systems, and the development of products that minimize scarring and pain. These advancements enhance the efficacy and patient acceptance of burn ointments. The increasing use of nanotechnology in enhancing drug delivery and improving the efficacy of active ingredients is a key technological trend. This market response to patient needs demonstrates a successful product-market fit.
Report Segmentation & Scope
This report segments the burn ointment market by:
- Product Type: Topical Antibiotics, Silver, Iodine
- Depth of Burn: Minor Burns, Partial Thickness Burns, Full Thickness Burns
- End User: Hospitals and Clinics, Other End Users (Homecare, Ambulatory Surgical Centers)
Each segment is analyzed in detail, providing insights into market size, growth projections, and competitive dynamics. Detailed market size and growth projections are provided for each segment for the forecast period (2025-2033).
Key Drivers of Burn Ointment Industry Growth
The burn ointment market's growth is propelled by a confluence of factors:
- Rising Burn Incidence: Increased accidental burns and other burn-related incidents are driving demand.
- Technological Advancements: Innovations in formulations and delivery systems are enhancing efficacy.
- Growing Healthcare Expenditure: Increased healthcare spending globally fuels market expansion.
- Expanding Healthcare Infrastructure: Improved healthcare access in developing countries is driving growth.
Challenges in the Burn Ointment Industry Sector
Several challenges impede the burn ointment market's growth:
- Stringent Regulatory Approvals: The lengthy and complex regulatory processes for new product approvals pose a hurdle.
- Supply Chain Disruptions: Global supply chain vulnerabilities can impact product availability.
- Intense Competition: The market’s competitive landscape presents significant challenges for smaller players.
- Pricing Pressures: Cost pressures from generic products and reimbursement policies impact profitability.
Leading Players in the Burn Ointment Industry Market
- Smith & Nephew PLC
- Perrigo Company PLC
- DeRoyal Industries Inc
- Integra LifeSciences
- 3M
- ConvaTec Group PLC
- Dr Morepen
- Mankind Pharma
- Cardinal Health
- Cipla Limited
- Trio Lifescience Pvt Ltd
- Johnson & Johnson
- Sun Pharmaceutical Industries Ltd (Ranbaxy Laboratories Limited)
- GlaxoSmithKline PLC
- Pfizer Inc
Key Developments in Burn Ointment Industry Sector
- May 2022: Molncyke Healthcare submitted clinical evidence on Mediplex Ag for partial thickness burns at Wound International 2022.
- April 2022: Hospices Civils de Lyon sponsored a clinical trial on silver sulphadiazine for second-degree burns (estimated start: September 2022).
Strategic Burn Ointment Industry Market Outlook
The burn ointment market presents significant growth potential, driven by continued technological innovation, increasing healthcare awareness, and rising incidence of burns. Strategic opportunities exist for companies focusing on developing novel formulations, expanding into underserved markets, and capitalizing on partnerships and collaborations. Future market success will hinge on the ability of companies to offer innovative products that address unmet patient needs, navigate regulatory hurdles, and manage supply chain complexities effectively.
Burn Ointment Industry Segmentation
-
1. Product Type
- 1.1. Topical Antibiotics
- 1.2. Silver
- 1.3. Iodine
-
2. Depth of Burn
- 2.1. Minor Burns
- 2.2. Partial Thickness Burns
- 2.3. Full Thickness Burns
-
3. End User
- 3.1. Hospitals and Clinics
- 3.2. Other End Users
Burn Ointment Industry Segmentation By Geography
-
1. North America
- 1.1. United States
- 1.2. Canada
- 1.3. Mexico
-
2. Europe
- 2.1. Germany
- 2.2. United Kingdom
- 2.3. France
- 2.4. Italy
- 2.5. Spain
- 2.6. Rest of Europe
-
3. Asia Pacific
- 3.1. China
- 3.2. Japan
- 3.3. India
- 3.4. Australia
- 3.5. South Korea
- 3.6. Rest of Asia Pacific
-
4. Middle East and Africa
- 4.1. GCC
- 4.2. South Africa
- 4.3. Rest of Middle East and Africa
-
5. South America
- 5.1. Brazil
- 5.2. Argentina
- 5.3. Rest of South America
Burn Ointment Industry REPORT HIGHLIGHTS
| Aspects | Details |
|---|---|
| Study Period | 2019-2033 |
| Base Year | 2024 |
| Estimated Year | 2025 |
| Forecast Period | 2025-2033 |
| Historical Period | 2019-2024 |
| Growth Rate | CAGR of 5.95% from 2019-2033 |
| Segmentation |
|
Table of Contents
- 1. Introduction
- 1.1. Research Scope
- 1.2. Market Segmentation
- 1.3. Research Methodology
- 1.4. Definitions and Assumptions
- 2. Executive Summary
- 2.1. Introduction
- 3. Market Dynamics
- 3.1. Introduction
- 3.2. Market Drivers
- 3.2.1. Rising Incidences of Burn; Increasing Awareness Regarding Treatment Options
- 3.3. Market Restrains
- 3.3.1. Side Effects Associated with Burn Ointment
- 3.4. Market Trends
- 3.4.1. The Topical Antibiotics Segment is Expected to Hold a Significant Market Share Over the Forecast Period
- 4. Market Factor Analysis
- 4.1. Porters Five Forces
- 4.2. Supply/Value Chain
- 4.3. PESTEL analysis
- 4.4. Market Entropy
- 4.5. Patent/Trademark Analysis
- 5. Global Burn Ointment Industry Analysis, Insights and Forecast, 2019-2031
- 5.1. Market Analysis, Insights and Forecast - by Product Type
- 5.1.1. Topical Antibiotics
- 5.1.2. Silver
- 5.1.3. Iodine
- 5.2. Market Analysis, Insights and Forecast - by Depth of Burn
- 5.2.1. Minor Burns
- 5.2.2. Partial Thickness Burns
- 5.2.3. Full Thickness Burns
- 5.3. Market Analysis, Insights and Forecast - by End User
- 5.3.1. Hospitals and Clinics
- 5.3.2. Other End Users
- 5.4. Market Analysis, Insights and Forecast - by Region
- 5.4.1. North America
- 5.4.2. Europe
- 5.4.3. Asia Pacific
- 5.4.4. Middle East and Africa
- 5.4.5. South America
- 5.1. Market Analysis, Insights and Forecast - by Product Type
- 6. North America Burn Ointment Industry Analysis, Insights and Forecast, 2019-2031
- 6.1. Market Analysis, Insights and Forecast - by Product Type
- 6.1.1. Topical Antibiotics
- 6.1.2. Silver
- 6.1.3. Iodine
- 6.2. Market Analysis, Insights and Forecast - by Depth of Burn
- 6.2.1. Minor Burns
- 6.2.2. Partial Thickness Burns
- 6.2.3. Full Thickness Burns
- 6.3. Market Analysis, Insights and Forecast - by End User
- 6.3.1. Hospitals and Clinics
- 6.3.2. Other End Users
- 6.1. Market Analysis, Insights and Forecast - by Product Type
- 7. Europe Burn Ointment Industry Analysis, Insights and Forecast, 2019-2031
- 7.1. Market Analysis, Insights and Forecast - by Product Type
- 7.1.1. Topical Antibiotics
- 7.1.2. Silver
- 7.1.3. Iodine
- 7.2. Market Analysis, Insights and Forecast - by Depth of Burn
- 7.2.1. Minor Burns
- 7.2.2. Partial Thickness Burns
- 7.2.3. Full Thickness Burns
- 7.3. Market Analysis, Insights and Forecast - by End User
- 7.3.1. Hospitals and Clinics
- 7.3.2. Other End Users
- 7.1. Market Analysis, Insights and Forecast - by Product Type
- 8. Asia Pacific Burn Ointment Industry Analysis, Insights and Forecast, 2019-2031
- 8.1. Market Analysis, Insights and Forecast - by Product Type
- 8.1.1. Topical Antibiotics
- 8.1.2. Silver
- 8.1.3. Iodine
- 8.2. Market Analysis, Insights and Forecast - by Depth of Burn
- 8.2.1. Minor Burns
- 8.2.2. Partial Thickness Burns
- 8.2.3. Full Thickness Burns
- 8.3. Market Analysis, Insights and Forecast - by End User
- 8.3.1. Hospitals and Clinics
- 8.3.2. Other End Users
- 8.1. Market Analysis, Insights and Forecast - by Product Type
- 9. Middle East and Africa Burn Ointment Industry Analysis, Insights and Forecast, 2019-2031
- 9.1. Market Analysis, Insights and Forecast - by Product Type
- 9.1.1. Topical Antibiotics
- 9.1.2. Silver
- 9.1.3. Iodine
- 9.2. Market Analysis, Insights and Forecast - by Depth of Burn
- 9.2.1. Minor Burns
- 9.2.2. Partial Thickness Burns
- 9.2.3. Full Thickness Burns
- 9.3. Market Analysis, Insights and Forecast - by End User
- 9.3.1. Hospitals and Clinics
- 9.3.2. Other End Users
- 9.1. Market Analysis, Insights and Forecast - by Product Type
- 10. South America Burn Ointment Industry Analysis, Insights and Forecast, 2019-2031
- 10.1. Market Analysis, Insights and Forecast - by Product Type
- 10.1.1. Topical Antibiotics
- 10.1.2. Silver
- 10.1.3. Iodine
- 10.2. Market Analysis, Insights and Forecast - by Depth of Burn
- 10.2.1. Minor Burns
- 10.2.2. Partial Thickness Burns
- 10.2.3. Full Thickness Burns
- 10.3. Market Analysis, Insights and Forecast - by End User
- 10.3.1. Hospitals and Clinics
- 10.3.2. Other End Users
- 10.1. Market Analysis, Insights and Forecast - by Product Type
- 11. North America Burn Ointment Industry Analysis, Insights and Forecast, 2019-2031
- 11.1. Market Analysis, Insights and Forecast - By Country/Sub-region
- 11.1.1 United States
- 11.1.2 Canada
- 11.1.3 Mexico
- 12. South America Burn Ointment Industry Analysis, Insights and Forecast, 2019-2031
- 12.1. Market Analysis, Insights and Forecast - By Country/Sub-region
- 12.1.1 Brazil
- 12.1.2 Mexico
- 12.1.3 Rest of South America
- 13. Europe Burn Ointment Industry Analysis, Insights and Forecast, 2019-2031
- 13.1. Market Analysis, Insights and Forecast - By Country/Sub-region
- 13.1.1 United Kingdom
- 13.1.2 Germany
- 13.1.3 France
- 13.1.4 Italy
- 13.1.5 Spain
- 13.1.6 Russia
- 13.1.7 Rest of Europe
- 14. Asia Pacific Burn Ointment Industry Analysis, Insights and Forecast, 2019-2031
- 14.1. Market Analysis, Insights and Forecast - By Country/Sub-region
- 14.1.1 China
- 14.1.2 Japan
- 14.1.3 India
- 14.1.4 South Korea
- 14.1.5 Taiwan
- 14.1.6 Australia
- 14.1.7 Rest of Asia-Pacific
- 15. MEA Burn Ointment Industry Analysis, Insights and Forecast, 2019-2031
- 15.1. Market Analysis, Insights and Forecast - By Country/Sub-region
- 15.1.1 Middle East
- 15.1.2 Africa
- 16. Competitive Analysis
- 16.1. Global Market Share Analysis 2024
- 16.2. Company Profiles
- 16.2.1 Smith & Nephew PLC
- 16.2.1.1. Overview
- 16.2.1.2. Products
- 16.2.1.3. SWOT Analysis
- 16.2.1.4. Recent Developments
- 16.2.1.5. Financials (Based on Availability)
- 16.2.2 Perrigo Company PLC
- 16.2.2.1. Overview
- 16.2.2.2. Products
- 16.2.2.3. SWOT Analysis
- 16.2.2.4. Recent Developments
- 16.2.2.5. Financials (Based on Availability)
- 16.2.3 DeRoyal Industries Inc
- 16.2.3.1. Overview
- 16.2.3.2. Products
- 16.2.3.3. SWOT Analysis
- 16.2.3.4. Recent Developments
- 16.2.3.5. Financials (Based on Availability)
- 16.2.4 Intergra LifeSciences
- 16.2.4.1. Overview
- 16.2.4.2. Products
- 16.2.4.3. SWOT Analysis
- 16.2.4.4. Recent Developments
- 16.2.4.5. Financials (Based on Availability)
- 16.2.5 3M
- 16.2.5.1. Overview
- 16.2.5.2. Products
- 16.2.5.3. SWOT Analysis
- 16.2.5.4. Recent Developments
- 16.2.5.5. Financials (Based on Availability)
- 16.2.6 ConvaTec Group PLC
- 16.2.6.1. Overview
- 16.2.6.2. Products
- 16.2.6.3. SWOT Analysis
- 16.2.6.4. Recent Developments
- 16.2.6.5. Financials (Based on Availability)
- 16.2.7 Dr Morepen
- 16.2.7.1. Overview
- 16.2.7.2. Products
- 16.2.7.3. SWOT Analysis
- 16.2.7.4. Recent Developments
- 16.2.7.5. Financials (Based on Availability)
- 16.2.8 Mankind Pharma
- 16.2.8.1. Overview
- 16.2.8.2. Products
- 16.2.8.3. SWOT Analysis
- 16.2.8.4. Recent Developments
- 16.2.8.5. Financials (Based on Availability)
- 16.2.9 Cardinal Health
- 16.2.9.1. Overview
- 16.2.9.2. Products
- 16.2.9.3. SWOT Analysis
- 16.2.9.4. Recent Developments
- 16.2.9.5. Financials (Based on Availability)
- 16.2.10 Cipla Limited
- 16.2.10.1. Overview
- 16.2.10.2. Products
- 16.2.10.3. SWOT Analysis
- 16.2.10.4. Recent Developments
- 16.2.10.5. Financials (Based on Availability)
- 16.2.11 Trio Lifescience Pvt Ltd
- 16.2.11.1. Overview
- 16.2.11.2. Products
- 16.2.11.3. SWOT Analysis
- 16.2.11.4. Recent Developments
- 16.2.11.5. Financials (Based on Availability)
- 16.2.12 Johnson & Johnson
- 16.2.12.1. Overview
- 16.2.12.2. Products
- 16.2.12.3. SWOT Analysis
- 16.2.12.4. Recent Developments
- 16.2.12.5. Financials (Based on Availability)
- 16.2.13 Sun Pharmaceutical Industries Ltd (Ranbaxy Laboratories Limited)
- 16.2.13.1. Overview
- 16.2.13.2. Products
- 16.2.13.3. SWOT Analysis
- 16.2.13.4. Recent Developments
- 16.2.13.5. Financials (Based on Availability)
- 16.2.14 GlaxoSmithKline PLC
- 16.2.14.1. Overview
- 16.2.14.2. Products
- 16.2.14.3. SWOT Analysis
- 16.2.14.4. Recent Developments
- 16.2.14.5. Financials (Based on Availability)
- 16.2.15 Pfizer Inc
- 16.2.15.1. Overview
- 16.2.15.2. Products
- 16.2.15.3. SWOT Analysis
- 16.2.15.4. Recent Developments
- 16.2.15.5. Financials (Based on Availability)
- 16.2.1 Smith & Nephew PLC
List of Figures
- Figure 1: Global Burn Ointment Industry Revenue Breakdown (Billion, %) by Region 2024 & 2032
- Figure 2: Global Burn Ointment Industry Volume Breakdown (K Tons, %) by Region 2024 & 2032
- Figure 3: North America Burn Ointment Industry Revenue (Billion), by Country 2024 & 2032
- Figure 4: North America Burn Ointment Industry Volume (K Tons), by Country 2024 & 2032
- Figure 5: North America Burn Ointment Industry Revenue Share (%), by Country 2024 & 2032
- Figure 6: North America Burn Ointment Industry Volume Share (%), by Country 2024 & 2032
- Figure 7: South America Burn Ointment Industry Revenue (Billion), by Country 2024 & 2032
- Figure 8: South America Burn Ointment Industry Volume (K Tons), by Country 2024 & 2032
- Figure 9: South America Burn Ointment Industry Revenue Share (%), by Country 2024 & 2032
- Figure 10: South America Burn Ointment Industry Volume Share (%), by Country 2024 & 2032
- Figure 11: Europe Burn Ointment Industry Revenue (Billion), by Country 2024 & 2032
- Figure 12: Europe Burn Ointment Industry Volume (K Tons), by Country 2024 & 2032
- Figure 13: Europe Burn Ointment Industry Revenue Share (%), by Country 2024 & 2032
- Figure 14: Europe Burn Ointment Industry Volume Share (%), by Country 2024 & 2032
- Figure 15: Asia Pacific Burn Ointment Industry Revenue (Billion), by Country 2024 & 2032
- Figure 16: Asia Pacific Burn Ointment Industry Volume (K Tons), by Country 2024 & 2032
- Figure 17: Asia Pacific Burn Ointment Industry Revenue Share (%), by Country 2024 & 2032
- Figure 18: Asia Pacific Burn Ointment Industry Volume Share (%), by Country 2024 & 2032
- Figure 19: MEA Burn Ointment Industry Revenue (Billion), by Country 2024 & 2032
- Figure 20: MEA Burn Ointment Industry Volume (K Tons), by Country 2024 & 2032
- Figure 21: MEA Burn Ointment Industry Revenue Share (%), by Country 2024 & 2032
- Figure 22: MEA Burn Ointment Industry Volume Share (%), by Country 2024 & 2032
- Figure 23: North America Burn Ointment Industry Revenue (Billion), by Product Type 2024 & 2032
- Figure 24: North America Burn Ointment Industry Volume (K Tons), by Product Type 2024 & 2032
- Figure 25: North America Burn Ointment Industry Revenue Share (%), by Product Type 2024 & 2032
- Figure 26: North America Burn Ointment Industry Volume Share (%), by Product Type 2024 & 2032
- Figure 27: North America Burn Ointment Industry Revenue (Billion), by Depth of Burn 2024 & 2032
- Figure 28: North America Burn Ointment Industry Volume (K Tons), by Depth of Burn 2024 & 2032
- Figure 29: North America Burn Ointment Industry Revenue Share (%), by Depth of Burn 2024 & 2032
- Figure 30: North America Burn Ointment Industry Volume Share (%), by Depth of Burn 2024 & 2032
- Figure 31: North America Burn Ointment Industry Revenue (Billion), by End User 2024 & 2032
- Figure 32: North America Burn Ointment Industry Volume (K Tons), by End User 2024 & 2032
- Figure 33: North America Burn Ointment Industry Revenue Share (%), by End User 2024 & 2032
- Figure 34: North America Burn Ointment Industry Volume Share (%), by End User 2024 & 2032
- Figure 35: North America Burn Ointment Industry Revenue (Billion), by Country 2024 & 2032
- Figure 36: North America Burn Ointment Industry Volume (K Tons), by Country 2024 & 2032
- Figure 37: North America Burn Ointment Industry Revenue Share (%), by Country 2024 & 2032
- Figure 38: North America Burn Ointment Industry Volume Share (%), by Country 2024 & 2032
- Figure 39: Europe Burn Ointment Industry Revenue (Billion), by Product Type 2024 & 2032
- Figure 40: Europe Burn Ointment Industry Volume (K Tons), by Product Type 2024 & 2032
- Figure 41: Europe Burn Ointment Industry Revenue Share (%), by Product Type 2024 & 2032
- Figure 42: Europe Burn Ointment Industry Volume Share (%), by Product Type 2024 & 2032
- Figure 43: Europe Burn Ointment Industry Revenue (Billion), by Depth of Burn 2024 & 2032
- Figure 44: Europe Burn Ointment Industry Volume (K Tons), by Depth of Burn 2024 & 2032
- Figure 45: Europe Burn Ointment Industry Revenue Share (%), by Depth of Burn 2024 & 2032
- Figure 46: Europe Burn Ointment Industry Volume Share (%), by Depth of Burn 2024 & 2032
- Figure 47: Europe Burn Ointment Industry Revenue (Billion), by End User 2024 & 2032
- Figure 48: Europe Burn Ointment Industry Volume (K Tons), by End User 2024 & 2032
- Figure 49: Europe Burn Ointment Industry Revenue Share (%), by End User 2024 & 2032
- Figure 50: Europe Burn Ointment Industry Volume Share (%), by End User 2024 & 2032
- Figure 51: Europe Burn Ointment Industry Revenue (Billion), by Country 2024 & 2032
- Figure 52: Europe Burn Ointment Industry Volume (K Tons), by Country 2024 & 2032
- Figure 53: Europe Burn Ointment Industry Revenue Share (%), by Country 2024 & 2032
- Figure 54: Europe Burn Ointment Industry Volume Share (%), by Country 2024 & 2032
- Figure 55: Asia Pacific Burn Ointment Industry Revenue (Billion), by Product Type 2024 & 2032
- Figure 56: Asia Pacific Burn Ointment Industry Volume (K Tons), by Product Type 2024 & 2032
- Figure 57: Asia Pacific Burn Ointment Industry Revenue Share (%), by Product Type 2024 & 2032
- Figure 58: Asia Pacific Burn Ointment Industry Volume Share (%), by Product Type 2024 & 2032
- Figure 59: Asia Pacific Burn Ointment Industry Revenue (Billion), by Depth of Burn 2024 & 2032
- Figure 60: Asia Pacific Burn Ointment Industry Volume (K Tons), by Depth of Burn 2024 & 2032
- Figure 61: Asia Pacific Burn Ointment Industry Revenue Share (%), by Depth of Burn 2024 & 2032
- Figure 62: Asia Pacific Burn Ointment Industry Volume Share (%), by Depth of Burn 2024 & 2032
- Figure 63: Asia Pacific Burn Ointment Industry Revenue (Billion), by End User 2024 & 2032
- Figure 64: Asia Pacific Burn Ointment Industry Volume (K Tons), by End User 2024 & 2032
- Figure 65: Asia Pacific Burn Ointment Industry Revenue Share (%), by End User 2024 & 2032
- Figure 66: Asia Pacific Burn Ointment Industry Volume Share (%), by End User 2024 & 2032
- Figure 67: Asia Pacific Burn Ointment Industry Revenue (Billion), by Country 2024 & 2032
- Figure 68: Asia Pacific Burn Ointment Industry Volume (K Tons), by Country 2024 & 2032
- Figure 69: Asia Pacific Burn Ointment Industry Revenue Share (%), by Country 2024 & 2032
- Figure 70: Asia Pacific Burn Ointment Industry Volume Share (%), by Country 2024 & 2032
- Figure 71: Middle East and Africa Burn Ointment Industry Revenue (Billion), by Product Type 2024 & 2032
- Figure 72: Middle East and Africa Burn Ointment Industry Volume (K Tons), by Product Type 2024 & 2032
- Figure 73: Middle East and Africa Burn Ointment Industry Revenue Share (%), by Product Type 2024 & 2032
- Figure 74: Middle East and Africa Burn Ointment Industry Volume Share (%), by Product Type 2024 & 2032
- Figure 75: Middle East and Africa Burn Ointment Industry Revenue (Billion), by Depth of Burn 2024 & 2032
- Figure 76: Middle East and Africa Burn Ointment Industry Volume (K Tons), by Depth of Burn 2024 & 2032
- Figure 77: Middle East and Africa Burn Ointment Industry Revenue Share (%), by Depth of Burn 2024 & 2032
- Figure 78: Middle East and Africa Burn Ointment Industry Volume Share (%), by Depth of Burn 2024 & 2032
- Figure 79: Middle East and Africa Burn Ointment Industry Revenue (Billion), by End User 2024 & 2032
- Figure 80: Middle East and Africa Burn Ointment Industry Volume (K Tons), by End User 2024 & 2032
- Figure 81: Middle East and Africa Burn Ointment Industry Revenue Share (%), by End User 2024 & 2032
- Figure 82: Middle East and Africa Burn Ointment Industry Volume Share (%), by End User 2024 & 2032
- Figure 83: Middle East and Africa Burn Ointment Industry Revenue (Billion), by Country 2024 & 2032
- Figure 84: Middle East and Africa Burn Ointment Industry Volume (K Tons), by Country 2024 & 2032
- Figure 85: Middle East and Africa Burn Ointment Industry Revenue Share (%), by Country 2024 & 2032
- Figure 86: Middle East and Africa Burn Ointment Industry Volume Share (%), by Country 2024 & 2032
- Figure 87: South America Burn Ointment Industry Revenue (Billion), by Product Type 2024 & 2032
- Figure 88: South America Burn Ointment Industry Volume (K Tons), by Product Type 2024 & 2032
- Figure 89: South America Burn Ointment Industry Revenue Share (%), by Product Type 2024 & 2032
- Figure 90: South America Burn Ointment Industry Volume Share (%), by Product Type 2024 & 2032
- Figure 91: South America Burn Ointment Industry Revenue (Billion), by Depth of Burn 2024 & 2032
- Figure 92: South America Burn Ointment Industry Volume (K Tons), by Depth of Burn 2024 & 2032
- Figure 93: South America Burn Ointment Industry Revenue Share (%), by Depth of Burn 2024 & 2032
- Figure 94: South America Burn Ointment Industry Volume Share (%), by Depth of Burn 2024 & 2032
- Figure 95: South America Burn Ointment Industry Revenue (Billion), by End User 2024 & 2032
- Figure 96: South America Burn Ointment Industry Volume (K Tons), by End User 2024 & 2032
- Figure 97: South America Burn Ointment Industry Revenue Share (%), by End User 2024 & 2032
- Figure 98: South America Burn Ointment Industry Volume Share (%), by End User 2024 & 2032
- Figure 99: South America Burn Ointment Industry Revenue (Billion), by Country 2024 & 2032
- Figure 100: South America Burn Ointment Industry Volume (K Tons), by Country 2024 & 2032
- Figure 101: South America Burn Ointment Industry Revenue Share (%), by Country 2024 & 2032
- Figure 102: South America Burn Ointment Industry Volume Share (%), by Country 2024 & 2032
List of Tables
- Table 1: Global Burn Ointment Industry Revenue Billion Forecast, by Region 2019 & 2032
- Table 2: Global Burn Ointment Industry Volume K Tons Forecast, by Region 2019 & 2032
- Table 3: Global Burn Ointment Industry Revenue Billion Forecast, by Product Type 2019 & 2032
- Table 4: Global Burn Ointment Industry Volume K Tons Forecast, by Product Type 2019 & 2032
- Table 5: Global Burn Ointment Industry Revenue Billion Forecast, by Depth of Burn 2019 & 2032
- Table 6: Global Burn Ointment Industry Volume K Tons Forecast, by Depth of Burn 2019 & 2032
- Table 7: Global Burn Ointment Industry Revenue Billion Forecast, by End User 2019 & 2032
- Table 8: Global Burn Ointment Industry Volume K Tons Forecast, by End User 2019 & 2032
- Table 9: Global Burn Ointment Industry Revenue Billion Forecast, by Region 2019 & 2032
- Table 10: Global Burn Ointment Industry Volume K Tons Forecast, by Region 2019 & 2032
- Table 11: Global Burn Ointment Industry Revenue Billion Forecast, by Country 2019 & 2032
- Table 12: Global Burn Ointment Industry Volume K Tons Forecast, by Country 2019 & 2032
- Table 13: United States Burn Ointment Industry Revenue (Billion) Forecast, by Application 2019 & 2032
- Table 14: United States Burn Ointment Industry Volume (K Tons) Forecast, by Application 2019 & 2032
- Table 15: Canada Burn Ointment Industry Revenue (Billion) Forecast, by Application 2019 & 2032
- Table 16: Canada Burn Ointment Industry Volume (K Tons) Forecast, by Application 2019 & 2032
- Table 17: Mexico Burn Ointment Industry Revenue (Billion) Forecast, by Application 2019 & 2032
- Table 18: Mexico Burn Ointment Industry Volume (K Tons) Forecast, by Application 2019 & 2032
- Table 19: Global Burn Ointment Industry Revenue Billion Forecast, by Country 2019 & 2032
- Table 20: Global Burn Ointment Industry Volume K Tons Forecast, by Country 2019 & 2032
- Table 21: Brazil Burn Ointment Industry Revenue (Billion) Forecast, by Application 2019 & 2032
- Table 22: Brazil Burn Ointment Industry Volume (K Tons) Forecast, by Application 2019 & 2032
- Table 23: Mexico Burn Ointment Industry Revenue (Billion) Forecast, by Application 2019 & 2032
- Table 24: Mexico Burn Ointment Industry Volume (K Tons) Forecast, by Application 2019 & 2032
- Table 25: Rest of South America Burn Ointment Industry Revenue (Billion) Forecast, by Application 2019 & 2032
- Table 26: Rest of South America Burn Ointment Industry Volume (K Tons) Forecast, by Application 2019 & 2032
- Table 27: Global Burn Ointment Industry Revenue Billion Forecast, by Country 2019 & 2032
- Table 28: Global Burn Ointment Industry Volume K Tons Forecast, by Country 2019 & 2032
- Table 29: United Kingdom Burn Ointment Industry Revenue (Billion) Forecast, by Application 2019 & 2032
- Table 30: United Kingdom Burn Ointment Industry Volume (K Tons) Forecast, by Application 2019 & 2032
- Table 31: Germany Burn Ointment Industry Revenue (Billion) Forecast, by Application 2019 & 2032
- Table 32: Germany Burn Ointment Industry Volume (K Tons) Forecast, by Application 2019 & 2032
- Table 33: France Burn Ointment Industry Revenue (Billion) Forecast, by Application 2019 & 2032
- Table 34: France Burn Ointment Industry Volume (K Tons) Forecast, by Application 2019 & 2032
- Table 35: Italy Burn Ointment Industry Revenue (Billion) Forecast, by Application 2019 & 2032
- Table 36: Italy Burn Ointment Industry Volume (K Tons) Forecast, by Application 2019 & 2032
- Table 37: Spain Burn Ointment Industry Revenue (Billion) Forecast, by Application 2019 & 2032
- Table 38: Spain Burn Ointment Industry Volume (K Tons) Forecast, by Application 2019 & 2032
- Table 39: Russia Burn Ointment Industry Revenue (Billion) Forecast, by Application 2019 & 2032
- Table 40: Russia Burn Ointment Industry Volume (K Tons) Forecast, by Application 2019 & 2032
- Table 41: Rest of Europe Burn Ointment Industry Revenue (Billion) Forecast, by Application 2019 & 2032
- Table 42: Rest of Europe Burn Ointment Industry Volume (K Tons) Forecast, by Application 2019 & 2032
- Table 43: Global Burn Ointment Industry Revenue Billion Forecast, by Country 2019 & 2032
- Table 44: Global Burn Ointment Industry Volume K Tons Forecast, by Country 2019 & 2032
- Table 45: China Burn Ointment Industry Revenue (Billion) Forecast, by Application 2019 & 2032
- Table 46: China Burn Ointment Industry Volume (K Tons) Forecast, by Application 2019 & 2032
- Table 47: Japan Burn Ointment Industry Revenue (Billion) Forecast, by Application 2019 & 2032
- Table 48: Japan Burn Ointment Industry Volume (K Tons) Forecast, by Application 2019 & 2032
- Table 49: India Burn Ointment Industry Revenue (Billion) Forecast, by Application 2019 & 2032
- Table 50: India Burn Ointment Industry Volume (K Tons) Forecast, by Application 2019 & 2032
- Table 51: South Korea Burn Ointment Industry Revenue (Billion) Forecast, by Application 2019 & 2032
- Table 52: South Korea Burn Ointment Industry Volume (K Tons) Forecast, by Application 2019 & 2032
- Table 53: Taiwan Burn Ointment Industry Revenue (Billion) Forecast, by Application 2019 & 2032
- Table 54: Taiwan Burn Ointment Industry Volume (K Tons) Forecast, by Application 2019 & 2032
- Table 55: Australia Burn Ointment Industry Revenue (Billion) Forecast, by Application 2019 & 2032
- Table 56: Australia Burn Ointment Industry Volume (K Tons) Forecast, by Application 2019 & 2032
- Table 57: Rest of Asia-Pacific Burn Ointment Industry Revenue (Billion) Forecast, by Application 2019 & 2032
- Table 58: Rest of Asia-Pacific Burn Ointment Industry Volume (K Tons) Forecast, by Application 2019 & 2032
- Table 59: Global Burn Ointment Industry Revenue Billion Forecast, by Country 2019 & 2032
- Table 60: Global Burn Ointment Industry Volume K Tons Forecast, by Country 2019 & 2032
- Table 61: Middle East Burn Ointment Industry Revenue (Billion) Forecast, by Application 2019 & 2032
- Table 62: Middle East Burn Ointment Industry Volume (K Tons) Forecast, by Application 2019 & 2032
- Table 63: Africa Burn Ointment Industry Revenue (Billion) Forecast, by Application 2019 & 2032
- Table 64: Africa Burn Ointment Industry Volume (K Tons) Forecast, by Application 2019 & 2032
- Table 65: Global Burn Ointment Industry Revenue Billion Forecast, by Product Type 2019 & 2032
- Table 66: Global Burn Ointment Industry Volume K Tons Forecast, by Product Type 2019 & 2032
- Table 67: Global Burn Ointment Industry Revenue Billion Forecast, by Depth of Burn 2019 & 2032
- Table 68: Global Burn Ointment Industry Volume K Tons Forecast, by Depth of Burn 2019 & 2032
- Table 69: Global Burn Ointment Industry Revenue Billion Forecast, by End User 2019 & 2032
- Table 70: Global Burn Ointment Industry Volume K Tons Forecast, by End User 2019 & 2032
- Table 71: Global Burn Ointment Industry Revenue Billion Forecast, by Country 2019 & 2032
- Table 72: Global Burn Ointment Industry Volume K Tons Forecast, by Country 2019 & 2032
- Table 73: United States Burn Ointment Industry Revenue (Billion) Forecast, by Application 2019 & 2032
- Table 74: United States Burn Ointment Industry Volume (K Tons) Forecast, by Application 2019 & 2032
- Table 75: Canada Burn Ointment Industry Revenue (Billion) Forecast, by Application 2019 & 2032
- Table 76: Canada Burn Ointment Industry Volume (K Tons) Forecast, by Application 2019 & 2032
- Table 77: Mexico Burn Ointment Industry Revenue (Billion) Forecast, by Application 2019 & 2032
- Table 78: Mexico Burn Ointment Industry Volume (K Tons) Forecast, by Application 2019 & 2032
- Table 79: Global Burn Ointment Industry Revenue Billion Forecast, by Product Type 2019 & 2032
- Table 80: Global Burn Ointment Industry Volume K Tons Forecast, by Product Type 2019 & 2032
- Table 81: Global Burn Ointment Industry Revenue Billion Forecast, by Depth of Burn 2019 & 2032
- Table 82: Global Burn Ointment Industry Volume K Tons Forecast, by Depth of Burn 2019 & 2032
- Table 83: Global Burn Ointment Industry Revenue Billion Forecast, by End User 2019 & 2032
- Table 84: Global Burn Ointment Industry Volume K Tons Forecast, by End User 2019 & 2032
- Table 85: Global Burn Ointment Industry Revenue Billion Forecast, by Country 2019 & 2032
- Table 86: Global Burn Ointment Industry Volume K Tons Forecast, by Country 2019 & 2032
- Table 87: Germany Burn Ointment Industry Revenue (Billion) Forecast, by Application 2019 & 2032
- Table 88: Germany Burn Ointment Industry Volume (K Tons) Forecast, by Application 2019 & 2032
- Table 89: United Kingdom Burn Ointment Industry Revenue (Billion) Forecast, by Application 2019 & 2032
- Table 90: United Kingdom Burn Ointment Industry Volume (K Tons) Forecast, by Application 2019 & 2032
- Table 91: France Burn Ointment Industry Revenue (Billion) Forecast, by Application 2019 & 2032
- Table 92: France Burn Ointment Industry Volume (K Tons) Forecast, by Application 2019 & 2032
- Table 93: Italy Burn Ointment Industry Revenue (Billion) Forecast, by Application 2019 & 2032
- Table 94: Italy Burn Ointment Industry Volume (K Tons) Forecast, by Application 2019 & 2032
- Table 95: Spain Burn Ointment Industry Revenue (Billion) Forecast, by Application 2019 & 2032
- Table 96: Spain Burn Ointment Industry Volume (K Tons) Forecast, by Application 2019 & 2032
- Table 97: Rest of Europe Burn Ointment Industry Revenue (Billion) Forecast, by Application 2019 & 2032
- Table 98: Rest of Europe Burn Ointment Industry Volume (K Tons) Forecast, by Application 2019 & 2032
- Table 99: Global Burn Ointment Industry Revenue Billion Forecast, by Product Type 2019 & 2032
- Table 100: Global Burn Ointment Industry Volume K Tons Forecast, by Product Type 2019 & 2032
- Table 101: Global Burn Ointment Industry Revenue Billion Forecast, by Depth of Burn 2019 & 2032
- Table 102: Global Burn Ointment Industry Volume K Tons Forecast, by Depth of Burn 2019 & 2032
- Table 103: Global Burn Ointment Industry Revenue Billion Forecast, by End User 2019 & 2032
- Table 104: Global Burn Ointment Industry Volume K Tons Forecast, by End User 2019 & 2032
- Table 105: Global Burn Ointment Industry Revenue Billion Forecast, by Country 2019 & 2032
- Table 106: Global Burn Ointment Industry Volume K Tons Forecast, by Country 2019 & 2032
- Table 107: China Burn Ointment Industry Revenue (Billion) Forecast, by Application 2019 & 2032
- Table 108: China Burn Ointment Industry Volume (K Tons) Forecast, by Application 2019 & 2032
- Table 109: Japan Burn Ointment Industry Revenue (Billion) Forecast, by Application 2019 & 2032
- Table 110: Japan Burn Ointment Industry Volume (K Tons) Forecast, by Application 2019 & 2032
- Table 111: India Burn Ointment Industry Revenue (Billion) Forecast, by Application 2019 & 2032
- Table 112: India Burn Ointment Industry Volume (K Tons) Forecast, by Application 2019 & 2032
- Table 113: Australia Burn Ointment Industry Revenue (Billion) Forecast, by Application 2019 & 2032
- Table 114: Australia Burn Ointment Industry Volume (K Tons) Forecast, by Application 2019 & 2032
- Table 115: South Korea Burn Ointment Industry Revenue (Billion) Forecast, by Application 2019 & 2032
- Table 116: South Korea Burn Ointment Industry Volume (K Tons) Forecast, by Application 2019 & 2032
- Table 117: Rest of Asia Pacific Burn Ointment Industry Revenue (Billion) Forecast, by Application 2019 & 2032
- Table 118: Rest of Asia Pacific Burn Ointment Industry Volume (K Tons) Forecast, by Application 2019 & 2032
- Table 119: Global Burn Ointment Industry Revenue Billion Forecast, by Product Type 2019 & 2032
- Table 120: Global Burn Ointment Industry Volume K Tons Forecast, by Product Type 2019 & 2032
- Table 121: Global Burn Ointment Industry Revenue Billion Forecast, by Depth of Burn 2019 & 2032
- Table 122: Global Burn Ointment Industry Volume K Tons Forecast, by Depth of Burn 2019 & 2032
- Table 123: Global Burn Ointment Industry Revenue Billion Forecast, by End User 2019 & 2032
- Table 124: Global Burn Ointment Industry Volume K Tons Forecast, by End User 2019 & 2032
- Table 125: Global Burn Ointment Industry Revenue Billion Forecast, by Country 2019 & 2032
- Table 126: Global Burn Ointment Industry Volume K Tons Forecast, by Country 2019 & 2032
- Table 127: GCC Burn Ointment Industry Revenue (Billion) Forecast, by Application 2019 & 2032
- Table 128: GCC Burn Ointment Industry Volume (K Tons) Forecast, by Application 2019 & 2032
- Table 129: South Africa Burn Ointment Industry Revenue (Billion) Forecast, by Application 2019 & 2032
- Table 130: South Africa Burn Ointment Industry Volume (K Tons) Forecast, by Application 2019 & 2032
- Table 131: Rest of Middle East and Africa Burn Ointment Industry Revenue (Billion) Forecast, by Application 2019 & 2032
- Table 132: Rest of Middle East and Africa Burn Ointment Industry Volume (K Tons) Forecast, by Application 2019 & 2032
- Table 133: Global Burn Ointment Industry Revenue Billion Forecast, by Product Type 2019 & 2032
- Table 134: Global Burn Ointment Industry Volume K Tons Forecast, by Product Type 2019 & 2032
- Table 135: Global Burn Ointment Industry Revenue Billion Forecast, by Depth of Burn 2019 & 2032
- Table 136: Global Burn Ointment Industry Volume K Tons Forecast, by Depth of Burn 2019 & 2032
- Table 137: Global Burn Ointment Industry Revenue Billion Forecast, by End User 2019 & 2032
- Table 138: Global Burn Ointment Industry Volume K Tons Forecast, by End User 2019 & 2032
- Table 139: Global Burn Ointment Industry Revenue Billion Forecast, by Country 2019 & 2032
- Table 140: Global Burn Ointment Industry Volume K Tons Forecast, by Country 2019 & 2032
- Table 141: Brazil Burn Ointment Industry Revenue (Billion) Forecast, by Application 2019 & 2032
- Table 142: Brazil Burn Ointment Industry Volume (K Tons) Forecast, by Application 2019 & 2032
- Table 143: Argentina Burn Ointment Industry Revenue (Billion) Forecast, by Application 2019 & 2032
- Table 144: Argentina Burn Ointment Industry Volume (K Tons) Forecast, by Application 2019 & 2032
- Table 145: Rest of South America Burn Ointment Industry Revenue (Billion) Forecast, by Application 2019 & 2032
- Table 146: Rest of South America Burn Ointment Industry Volume (K Tons) Forecast, by Application 2019 & 2032
Frequently Asked Questions
1. What is the projected Compound Annual Growth Rate (CAGR) of the Burn Ointment Industry?
The projected CAGR is approximately 5.95%.
2. Which companies are prominent players in the Burn Ointment Industry?
Key companies in the market include Smith & Nephew PLC, Perrigo Company PLC, DeRoyal Industries Inc, Intergra LifeSciences, 3M, ConvaTec Group PLC, Dr Morepen, Mankind Pharma, Cardinal Health, Cipla Limited, Trio Lifescience Pvt Ltd, Johnson & Johnson, Sun Pharmaceutical Industries Ltd (Ranbaxy Laboratories Limited), GlaxoSmithKline PLC, Pfizer Inc.
3. What are the main segments of the Burn Ointment Industry?
The market segments include Product Type, Depth of Burn, End User.
4. Can you provide details about the market size?
The market size is estimated to be USD 1.1 Billion as of 2022.
5. What are some drivers contributing to market growth?
Rising Incidences of Burn; Increasing Awareness Regarding Treatment Options.
6. What are the notable trends driving market growth?
The Topical Antibiotics Segment is Expected to Hold a Significant Market Share Over the Forecast Period.
7. Are there any restraints impacting market growth?
Side Effects Associated with Burn Ointment.
8. Can you provide examples of recent developments in the market?
In May 2022, Molncyke Healthcare sunmitted the clinical evidence in Wound International 2022 on the use of Mediplex Ag for the management of partial thickness burns. The soft silicone wound contact layer in Mediplex designed to help minimise wound and peri-wound trauma and associated pain aided in the burn healing.
9. What pricing options are available for accessing the report?
Pricing options include single-user, multi-user, and enterprise licenses priced at USD 4750, USD 5250, and USD 8750 respectively.
10. Is the market size provided in terms of value or volume?
The market size is provided in terms of value, measured in Billion and volume, measured in K Tons.
11. Are there any specific market keywords associated with the report?
Yes, the market keyword associated with the report is "Burn Ointment Industry," which aids in identifying and referencing the specific market segment covered.
12. How do I determine which pricing option suits my needs best?
The pricing options vary based on user requirements and access needs. Individual users may opt for single-user licenses, while businesses requiring broader access may choose multi-user or enterprise licenses for cost-effective access to the report.
13. Are there any additional resources or data provided in the Burn Ointment Industry report?
While the report offers comprehensive insights, it's advisable to review the specific contents or supplementary materials provided to ascertain if additional resources or data are available.
14. How can I stay updated on further developments or reports in the Burn Ointment Industry?
To stay informed about further developments, trends, and reports in the Burn Ointment Industry, consider subscribing to industry newsletters, following relevant companies and organizations, or regularly checking reputable industry news sources and publications.
Methodology
Step 1 - Identification of Relevant Samples Size from Population Database


Step 2 - Approaches for Defining Global Market Size (Value, Volume* & Price*)

Note*: In applicable scenarios
Step 3 - Data Sources
Primary Research
- Web Analytics
- Survey Reports
- Research Institute
- Latest Research Reports
- Opinion Leaders
Secondary Research
- Annual Reports
- White Paper
- Latest Press Release
- Industry Association
- Paid Database
- Investor Presentations

Step 4 - Data Triangulation
Involves using different sources of information in order to increase the validity of a study
These sources are likely to be stakeholders in a program - participants, other researchers, program staff, other community members, and so on.
Then we put all data in single framework & apply various statistical tools to find out the dynamic on the market.
During the analysis stage, feedback from the stakeholder groups would be compared to determine areas of agreement as well as areas of divergence


