
Key Insights
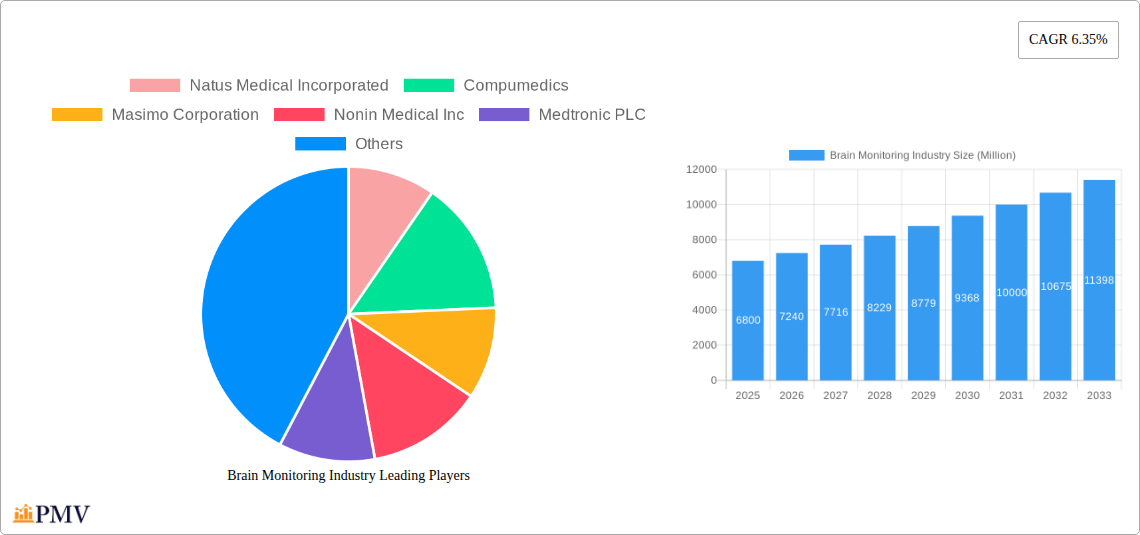
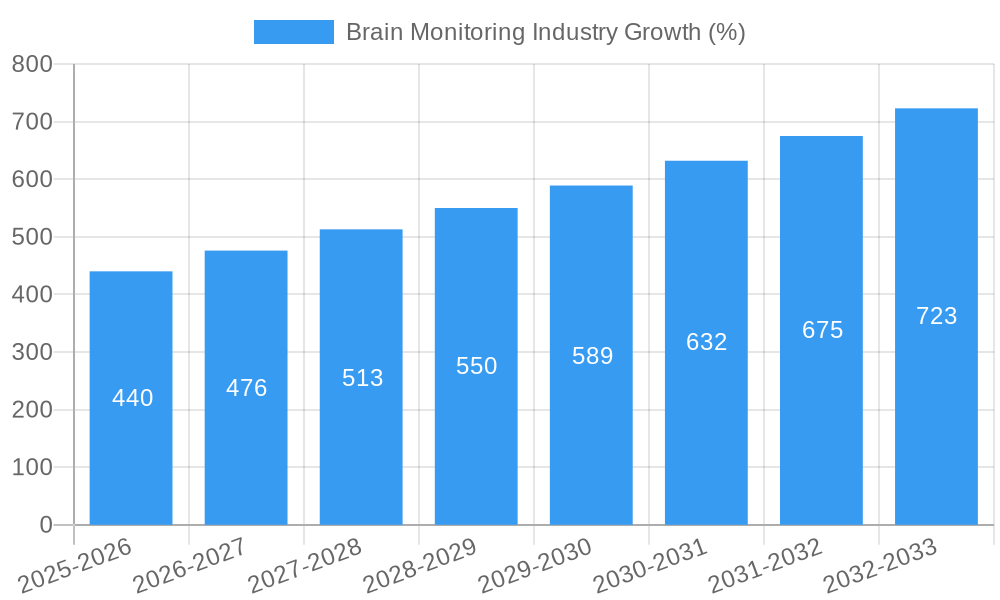
The global brain monitoring market, valued at $6.80 billion in 2025, is projected to experience robust growth, exhibiting a Compound Annual Growth Rate (CAGR) of 6.35% from 2025 to 2033. This expansion is driven by several key factors. The rising prevalence of neurological disorders like Parkinson's disease, traumatic brain injury, epilepsy, and dementia is a significant catalyst. Technological advancements in brain monitoring devices, leading to improved accuracy, portability, and ease of use, are further fueling market growth. Increased healthcare spending, particularly in developed nations, and the growing adoption of minimally invasive procedures are also contributing to market expansion. The segment encompassing hospitals and diagnostic centers constitutes a major portion of the end-user market, reflecting the significant role these facilities play in diagnosing and treating neurological conditions. Furthermore, the increasing demand for effective and efficient brain monitoring solutions in intensive care units (ICUs) and emergency rooms is a substantial driver.
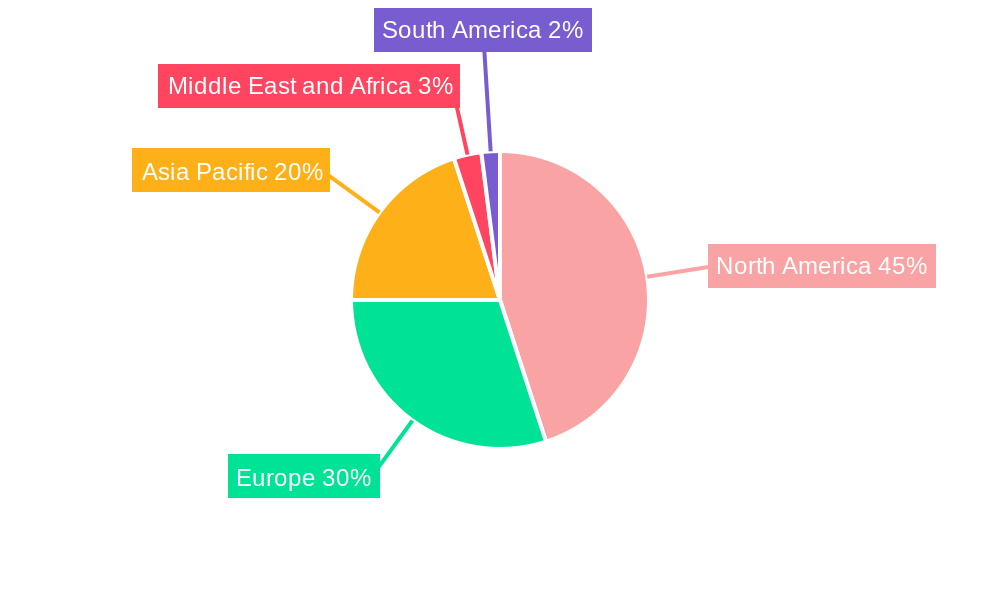
The market is segmented by product type (Magnetoencephalograph, Electroencephalograph, Cerebral Oximeters, fMRI, Intracranial Pressure Monitoring Devices, and Others), application (Parkinson's Disease, Traumatic Brain Injury, Epilepsy, Dementia, Sleep Disorders, and Others), and end-user (Hospitals and Diagnostic Centers). North America currently holds a dominant market share due to advanced healthcare infrastructure and high adoption rates of sophisticated brain monitoring technologies. However, the Asia-Pacific region is anticipated to witness significant growth in the coming years driven by rising healthcare expenditure, increasing awareness about neurological disorders, and expanding healthcare infrastructure. Market restraints include high costs associated with advanced technologies, stringent regulatory approvals, and the potential for technical complexities in certain devices. Despite these challenges, the long-term outlook for the brain monitoring market remains positive, fueled by ongoing research and development, and the continuous need for effective tools in the diagnosis and treatment of neurological conditions.
Brain Monitoring Market Report: 2019-2033
This comprehensive report provides a detailed analysis of the global brain monitoring market, offering invaluable insights for stakeholders, investors, and industry professionals. Covering the period from 2019 to 2033, with a focus on 2025, this report examines market dynamics, competitive landscapes, technological advancements, and future growth projections. The market is valued at xx Million in 2025 and is projected to reach xx Million by 2033, exhibiting a CAGR of xx%.
Brain Monitoring Industry Market Structure & Competitive Dynamics
The brain monitoring market is characterized by a moderately concentrated structure with several key players vying for market share. Key competitors include Natus Medical Incorporated, Compumedics, Masimo Corporation, Nonin Medical Inc, Medtronic PLC, Advanced Brain Monitoring Inc, Cadwell Industries Inc, Koninklijke Philips NV, Integra Lifesciences Corporation, Cerenion Oy, Nihon Kohden Corporation, and General Electric Company. Market share is dynamic, influenced by product innovation, regulatory approvals, and strategic acquisitions. Innovation ecosystems are crucial, driving the development of advanced technologies like AI-powered diagnostics and minimally invasive monitoring devices. Regulatory frameworks, particularly FDA approvals in the US and CE markings in Europe, significantly impact market entry and product adoption. The existence of substitute technologies and evolving end-user preferences contribute to ongoing competitive pressures. M&A activities have been moderate, with deal values ranging from xx Million to xx Million, reflecting strategic efforts to consolidate market position and expand product portfolios.
- Market Concentration: Moderately concentrated, with top 5 players holding approximately xx% market share in 2025.
- Innovation Ecosystems: Strong focus on AI, miniaturization, and improved signal processing.
- Regulatory Frameworks: Stringent regulatory pathways for medical devices, impacting time-to-market.
- Product Substitutes: Limited, but alternative diagnostic techniques pose some level of competition.
- M&A Activity: Moderate activity, with xx major deals recorded between 2019 and 2024, totaling an estimated value of xx Million.
Brain Monitoring Industry Industry Trends & Insights
The global brain monitoring market is experiencing robust growth, driven by several key factors. The increasing prevalence of neurological disorders like Parkinson's disease, epilepsy, traumatic brain injury, and dementia fuels demand for accurate and timely diagnostic tools. Technological advancements, particularly in EEG, fMRI, and intracranial pressure monitoring, are leading to more sophisticated and user-friendly devices. Consumer preferences are shifting towards minimally invasive and portable solutions, impacting device design and functionality. The competitive landscape is dynamic, with established players investing heavily in R&D and emerging companies introducing innovative technologies. This leads to continuous improvements in diagnostic accuracy, ease of use, and cost-effectiveness. Market penetration rates vary significantly across different regions and applications, with developed countries exhibiting higher adoption rates. The market is expected to grow at a CAGR of xx% from 2025 to 2033.
Dominant Markets & Segments in Brain Monitoring Industry
The North American region dominates the global brain monitoring market, driven by factors such as high healthcare expenditure, advanced medical infrastructure, and a large population base affected by neurological disorders. Within the product type segment, Electroencephalographs (EEGs) hold the largest market share, followed by Intracranial Pressure Monitoring Devices. The application segment shows that Traumatic Brain Injury (TBI) and Epilepsy are the most significant contributors. Hospitals remain the primary end-users, followed by diagnostic centers.
Key Drivers for North American Dominance:
- High healthcare expenditure.
- Advanced medical infrastructure.
- High prevalence of neurological disorders.
- Robust regulatory frameworks supporting medical device innovation.
Dominant Segments:
- Product Type: Electroencephalograph (EEG)
- Application: Traumatic Brain Injury (TBI)
- End-User: Hospitals
The significant market share of EEGs is attributable to their widespread availability, relative affordability, and established clinical utility across various neurological applications. The high prevalence of TBI and the critical need for timely intervention are key factors driving the substantial market share of this application segment. The dominance of hospitals stems from their comprehensive capabilities in neurological care and the need for continuous monitoring of critically ill patients.
Brain Monitoring Industry Product Innovations
Recent innovations in brain monitoring technologies center on improved signal processing, miniaturization, and wireless connectivity. The integration of AI and machine learning enhances diagnostic accuracy and automates data analysis. Wireless devices offer enhanced patient mobility and comfort, while miniaturization allows for less invasive procedures. These advancements are improving market fit by addressing unmet clinical needs, increasing efficiency, and reducing healthcare costs. The development of continuous brain monitoring systems for early detection of neurological conditions is a significant trend.
Report Segmentation & Scope
This report segments the brain monitoring market by product type (Magnetoencephalograph, Electroencephalograph, Cerebral Oximeters, fMRI, Intracranial Pressure Monitoring Devices, Other Product Types), application (Parkinson's Disease, Traumatic Brain Injury, Epilepsy, Dementia, Sleep Disorders, Other Applications), and end-user (Hospitals, Diagnostic Centers). Each segment is analyzed in detail, providing insights into market size, growth projections, and competitive dynamics. Growth projections vary across segments, with some showing higher growth rates than others, driven by technological advancements, regulatory changes, and shifts in clinical practice. Competitive intensity also varies across segments, reflecting the presence of established and emerging players.
Key Drivers of Brain Monitoring Industry Growth
Several factors are driving the growth of the brain monitoring market. These include the rising prevalence of neurological disorders, technological advancements enabling improved diagnostics and treatment, increasing healthcare expenditure globally, and growing awareness of the importance of early diagnosis and intervention. Favorable regulatory environments and increasing government initiatives supporting healthcare infrastructure development also contribute significantly.
Challenges in the Brain Monitoring Industry Sector
Challenges in the brain monitoring industry include stringent regulatory approvals, which can increase development costs and time-to-market. Supply chain disruptions can impact the availability of critical components. Intense competition among established players and emerging companies creates pressure on pricing and profitability. These factors can influence market growth and hinder the widespread adoption of advanced technologies. The average cost of developing and receiving FDA approval for a new brain monitoring device is estimated to be xx Million.
Leading Players in the Brain Monitoring Industry Market
- Natus Medical Incorporated
- Compumedics
- Masimo Corporation
- Nonin Medical Inc
- Medtronic PLC
- Advanced Brain Monitoring Inc
- Cadwell Industries Inc
- Koninklijke Philips NV
- Integra Lifesciences Corporation
- Cerenion Oy
- Nihon Kohden Corporation
- General Electric Company
Key Developments in Brain Monitoring Industry Sector
- November 2022: Neurosteer Inc. received FDA clearance for its Neurosteer single-channel EEG brain monitoring platform, expanding the application of continuous brain monitoring across various clinical settings and accelerating early detection of cognitive decline.
- February 2022: Masimo received FDA clearance for its SedLine brain function monitoring system for pediatric patients, significantly broadening the system's potential market and improving brain function monitoring for children.
Strategic Brain Monitoring Industry Market Outlook
The future of the brain monitoring market looks bright, with significant potential for growth. Continued technological advancements, expanding applications, and the increasing prevalence of neurological disorders will drive market expansion. Strategic opportunities exist for companies focusing on developing innovative, user-friendly, and cost-effective solutions, particularly in emerging markets. The integration of AI and big data analytics will further enhance diagnostic capabilities and personalize patient care, creating new growth avenues in the coming years.
Brain Monitoring Industry Segmentation
-
1. Product Type
- 1.1. Magnetoencephalograph
- 1.2. Electroencephalograph
- 1.3. Cerebral Oximeters
- 1.4. Functional Magnetic Resonance Imaging (fMRI)
- 1.5. Intracranial Pressure Monitoring Devices
- 1.6. Other Product Types
-
2. Application
- 2.1. Parkinson's Disease
- 2.2. Traumatic Brain Injury
- 2.3. Epilepsy
- 2.4. Dementia
- 2.5. Sleep Disorders
- 2.6. Other Applications
-
3. End User
- 3.1. Hospitals
- 3.2. Diagnostic Centers
Brain Monitoring Industry Segmentation By Geography
-
1. North America
- 1.1. United States
- 1.2. Canada
- 1.3. Mexico
-
2. Europe
- 2.1. Germany
- 2.2. United Kingdom
- 2.3. France
- 2.4. Italy
- 2.5. Spain
- 2.6. Rest of Europe
-
3. Asia Pacific
- 3.1. China
- 3.2. Japan
- 3.3. India
- 3.4. Australia
- 3.5. South Korea
- 3.6. Rest of Asia Pacific
-
4. Middle East and Africa
- 4.1. GCC
- 4.2. South Africa
- 4.3. Rest of Middle East and Africa
-
5. South America
- 5.1. Brazil
- 5.2. Argentina
- 5.3. Rest of South America
Brain Monitoring Industry REPORT HIGHLIGHTS
| Aspects | Details |
|---|---|
| Study Period | 2019-2033 |
| Base Year | 2024 |
| Estimated Year | 2025 |
| Forecast Period | 2025-2033 |
| Historical Period | 2019-2024 |
| Growth Rate | CAGR of 6.35% from 2019-2033 |
| Segmentation |
|
Table of Contents
- 1. Introduction
- 1.1. Research Scope
- 1.2. Market Segmentation
- 1.3. Research Methodology
- 1.4. Definitions and Assumptions
- 2. Executive Summary
- 2.1. Introduction
- 3. Market Dynamics
- 3.1. Introduction
- 3.2. Market Drivers
- 3.2.1. Growing Geriatric Population; Rise in Incidences of Brain Disorders; Technological Advancements in Brain Monitoring Devices
- 3.3. Market Restrains
- 3.3.1. Stringent Regulations for the Device Approval; Lack of Skilled Personnel to Handle Devices
- 3.4. Market Trends
- 3.4.1. Electroencephalograph is Expected Witness a Healthy Growth Over the Forecast Period
- 4. Market Factor Analysis
- 4.1. Porters Five Forces
- 4.2. Supply/Value Chain
- 4.3. PESTEL analysis
- 4.4. Market Entropy
- 4.5. Patent/Trademark Analysis
- 5. Global Brain Monitoring Industry Analysis, Insights and Forecast, 2019-2031
- 5.1. Market Analysis, Insights and Forecast - by Product Type
- 5.1.1. Magnetoencephalograph
- 5.1.2. Electroencephalograph
- 5.1.3. Cerebral Oximeters
- 5.1.4. Functional Magnetic Resonance Imaging (fMRI)
- 5.1.5. Intracranial Pressure Monitoring Devices
- 5.1.6. Other Product Types
- 5.2. Market Analysis, Insights and Forecast - by Application
- 5.2.1. Parkinson's Disease
- 5.2.2. Traumatic Brain Injury
- 5.2.3. Epilepsy
- 5.2.4. Dementia
- 5.2.5. Sleep Disorders
- 5.2.6. Other Applications
- 5.3. Market Analysis, Insights and Forecast - by End User
- 5.3.1. Hospitals
- 5.3.2. Diagnostic Centers
- 5.4. Market Analysis, Insights and Forecast - by Region
- 5.4.1. North America
- 5.4.2. Europe
- 5.4.3. Asia Pacific
- 5.4.4. Middle East and Africa
- 5.4.5. South America
- 5.1. Market Analysis, Insights and Forecast - by Product Type
- 6. North America Brain Monitoring Industry Analysis, Insights and Forecast, 2019-2031
- 6.1. Market Analysis, Insights and Forecast - by Product Type
- 6.1.1. Magnetoencephalograph
- 6.1.2. Electroencephalograph
- 6.1.3. Cerebral Oximeters
- 6.1.4. Functional Magnetic Resonance Imaging (fMRI)
- 6.1.5. Intracranial Pressure Monitoring Devices
- 6.1.6. Other Product Types
- 6.2. Market Analysis, Insights and Forecast - by Application
- 6.2.1. Parkinson's Disease
- 6.2.2. Traumatic Brain Injury
- 6.2.3. Epilepsy
- 6.2.4. Dementia
- 6.2.5. Sleep Disorders
- 6.2.6. Other Applications
- 6.3. Market Analysis, Insights and Forecast - by End User
- 6.3.1. Hospitals
- 6.3.2. Diagnostic Centers
- 6.1. Market Analysis, Insights and Forecast - by Product Type
- 7. Europe Brain Monitoring Industry Analysis, Insights and Forecast, 2019-2031
- 7.1. Market Analysis, Insights and Forecast - by Product Type
- 7.1.1. Magnetoencephalograph
- 7.1.2. Electroencephalograph
- 7.1.3. Cerebral Oximeters
- 7.1.4. Functional Magnetic Resonance Imaging (fMRI)
- 7.1.5. Intracranial Pressure Monitoring Devices
- 7.1.6. Other Product Types
- 7.2. Market Analysis, Insights and Forecast - by Application
- 7.2.1. Parkinson's Disease
- 7.2.2. Traumatic Brain Injury
- 7.2.3. Epilepsy
- 7.2.4. Dementia
- 7.2.5. Sleep Disorders
- 7.2.6. Other Applications
- 7.3. Market Analysis, Insights and Forecast - by End User
- 7.3.1. Hospitals
- 7.3.2. Diagnostic Centers
- 7.1. Market Analysis, Insights and Forecast - by Product Type
- 8. Asia Pacific Brain Monitoring Industry Analysis, Insights and Forecast, 2019-2031
- 8.1. Market Analysis, Insights and Forecast - by Product Type
- 8.1.1. Magnetoencephalograph
- 8.1.2. Electroencephalograph
- 8.1.3. Cerebral Oximeters
- 8.1.4. Functional Magnetic Resonance Imaging (fMRI)
- 8.1.5. Intracranial Pressure Monitoring Devices
- 8.1.6. Other Product Types
- 8.2. Market Analysis, Insights and Forecast - by Application
- 8.2.1. Parkinson's Disease
- 8.2.2. Traumatic Brain Injury
- 8.2.3. Epilepsy
- 8.2.4. Dementia
- 8.2.5. Sleep Disorders
- 8.2.6. Other Applications
- 8.3. Market Analysis, Insights and Forecast - by End User
- 8.3.1. Hospitals
- 8.3.2. Diagnostic Centers
- 8.1. Market Analysis, Insights and Forecast - by Product Type
- 9. Middle East and Africa Brain Monitoring Industry Analysis, Insights and Forecast, 2019-2031
- 9.1. Market Analysis, Insights and Forecast - by Product Type
- 9.1.1. Magnetoencephalograph
- 9.1.2. Electroencephalograph
- 9.1.3. Cerebral Oximeters
- 9.1.4. Functional Magnetic Resonance Imaging (fMRI)
- 9.1.5. Intracranial Pressure Monitoring Devices
- 9.1.6. Other Product Types
- 9.2. Market Analysis, Insights and Forecast - by Application
- 9.2.1. Parkinson's Disease
- 9.2.2. Traumatic Brain Injury
- 9.2.3. Epilepsy
- 9.2.4. Dementia
- 9.2.5. Sleep Disorders
- 9.2.6. Other Applications
- 9.3. Market Analysis, Insights and Forecast - by End User
- 9.3.1. Hospitals
- 9.3.2. Diagnostic Centers
- 9.1. Market Analysis, Insights and Forecast - by Product Type
- 10. South America Brain Monitoring Industry Analysis, Insights and Forecast, 2019-2031
- 10.1. Market Analysis, Insights and Forecast - by Product Type
- 10.1.1. Magnetoencephalograph
- 10.1.2. Electroencephalograph
- 10.1.3. Cerebral Oximeters
- 10.1.4. Functional Magnetic Resonance Imaging (fMRI)
- 10.1.5. Intracranial Pressure Monitoring Devices
- 10.1.6. Other Product Types
- 10.2. Market Analysis, Insights and Forecast - by Application
- 10.2.1. Parkinson's Disease
- 10.2.2. Traumatic Brain Injury
- 10.2.3. Epilepsy
- 10.2.4. Dementia
- 10.2.5. Sleep Disorders
- 10.2.6. Other Applications
- 10.3. Market Analysis, Insights and Forecast - by End User
- 10.3.1. Hospitals
- 10.3.2. Diagnostic Centers
- 10.1. Market Analysis, Insights and Forecast - by Product Type
- 11. North America Brain Monitoring Industry Analysis, Insights and Forecast, 2019-2031
- 11.1. Market Analysis, Insights and Forecast - By Country/Sub-region
- 11.1.1 United States
- 11.1.2 Canada
- 11.1.3 Mexico
- 12. Europe Brain Monitoring Industry Analysis, Insights and Forecast, 2019-2031
- 12.1. Market Analysis, Insights and Forecast - By Country/Sub-region
- 12.1.1 Germany
- 12.1.2 United Kingdom
- 12.1.3 France
- 12.1.4 Italy
- 12.1.5 Spain
- 12.1.6 Rest of Europe
- 13. Asia Pacific Brain Monitoring Industry Analysis, Insights and Forecast, 2019-2031
- 13.1. Market Analysis, Insights and Forecast - By Country/Sub-region
- 13.1.1 China
- 13.1.2 Japan
- 13.1.3 India
- 13.1.4 Australia
- 13.1.5 South Korea
- 13.1.6 Rest of Asia Pacific
- 14. Middle East and Africa Brain Monitoring Industry Analysis, Insights and Forecast, 2019-2031
- 14.1. Market Analysis, Insights and Forecast - By Country/Sub-region
- 14.1.1 GCC
- 14.1.2 South Africa
- 14.1.3 Rest of Middle East and Africa
- 15. South America Brain Monitoring Industry Analysis, Insights and Forecast, 2019-2031
- 15.1. Market Analysis, Insights and Forecast - By Country/Sub-region
- 15.1.1 Brazil
- 15.1.2 Argentina
- 15.1.3 Rest of South America
- 16. Competitive Analysis
- 16.1. Global Market Share Analysis 2024
- 16.2. Company Profiles
- 16.2.1 Natus Medical Incorporated
- 16.2.1.1. Overview
- 16.2.1.2. Products
- 16.2.1.3. SWOT Analysis
- 16.2.1.4. Recent Developments
- 16.2.1.5. Financials (Based on Availability)
- 16.2.2 Compumedics
- 16.2.2.1. Overview
- 16.2.2.2. Products
- 16.2.2.3. SWOT Analysis
- 16.2.2.4. Recent Developments
- 16.2.2.5. Financials (Based on Availability)
- 16.2.3 Masimo Corporation
- 16.2.3.1. Overview
- 16.2.3.2. Products
- 16.2.3.3. SWOT Analysis
- 16.2.3.4. Recent Developments
- 16.2.3.5. Financials (Based on Availability)
- 16.2.4 Nonin Medical Inc
- 16.2.4.1. Overview
- 16.2.4.2. Products
- 16.2.4.3. SWOT Analysis
- 16.2.4.4. Recent Developments
- 16.2.4.5. Financials (Based on Availability)
- 16.2.5 Medtronic PLC
- 16.2.5.1. Overview
- 16.2.5.2. Products
- 16.2.5.3. SWOT Analysis
- 16.2.5.4. Recent Developments
- 16.2.5.5. Financials (Based on Availability)
- 16.2.6 Advanced Brain Monitoring Inc
- 16.2.6.1. Overview
- 16.2.6.2. Products
- 16.2.6.3. SWOT Analysis
- 16.2.6.4. Recent Developments
- 16.2.6.5. Financials (Based on Availability)
- 16.2.7 Cadwell Industries Inc
- 16.2.7.1. Overview
- 16.2.7.2. Products
- 16.2.7.3. SWOT Analysis
- 16.2.7.4. Recent Developments
- 16.2.7.5. Financials (Based on Availability)
- 16.2.8 Koninklijke Philips NV
- 16.2.8.1. Overview
- 16.2.8.2. Products
- 16.2.8.3. SWOT Analysis
- 16.2.8.4. Recent Developments
- 16.2.8.5. Financials (Based on Availability)
- 16.2.9 Integra Lifesciences Corporation
- 16.2.9.1. Overview
- 16.2.9.2. Products
- 16.2.9.3. SWOT Analysis
- 16.2.9.4. Recent Developments
- 16.2.9.5. Financials (Based on Availability)
- 16.2.10 Cerenion Oy
- 16.2.10.1. Overview
- 16.2.10.2. Products
- 16.2.10.3. SWOT Analysis
- 16.2.10.4. Recent Developments
- 16.2.10.5. Financials (Based on Availability)
- 16.2.11 Nihon Kohden Corporation
- 16.2.11.1. Overview
- 16.2.11.2. Products
- 16.2.11.3. SWOT Analysis
- 16.2.11.4. Recent Developments
- 16.2.11.5. Financials (Based on Availability)
- 16.2.12 General Electric Company
- 16.2.12.1. Overview
- 16.2.12.2. Products
- 16.2.12.3. SWOT Analysis
- 16.2.12.4. Recent Developments
- 16.2.12.5. Financials (Based on Availability)
- 16.2.1 Natus Medical Incorporated
List of Figures
- Figure 1: Global Brain Monitoring Industry Revenue Breakdown (Million, %) by Region 2024 & 2032
- Figure 2: Global Brain Monitoring Industry Volume Breakdown (K Unit, %) by Region 2024 & 2032
- Figure 3: North America Brain Monitoring Industry Revenue (Million), by Country 2024 & 2032
- Figure 4: North America Brain Monitoring Industry Volume (K Unit), by Country 2024 & 2032
- Figure 5: North America Brain Monitoring Industry Revenue Share (%), by Country 2024 & 2032
- Figure 6: North America Brain Monitoring Industry Volume Share (%), by Country 2024 & 2032
- Figure 7: Europe Brain Monitoring Industry Revenue (Million), by Country 2024 & 2032
- Figure 8: Europe Brain Monitoring Industry Volume (K Unit), by Country 2024 & 2032
- Figure 9: Europe Brain Monitoring Industry Revenue Share (%), by Country 2024 & 2032
- Figure 10: Europe Brain Monitoring Industry Volume Share (%), by Country 2024 & 2032
- Figure 11: Asia Pacific Brain Monitoring Industry Revenue (Million), by Country 2024 & 2032
- Figure 12: Asia Pacific Brain Monitoring Industry Volume (K Unit), by Country 2024 & 2032
- Figure 13: Asia Pacific Brain Monitoring Industry Revenue Share (%), by Country 2024 & 2032
- Figure 14: Asia Pacific Brain Monitoring Industry Volume Share (%), by Country 2024 & 2032
- Figure 15: Middle East and Africa Brain Monitoring Industry Revenue (Million), by Country 2024 & 2032
- Figure 16: Middle East and Africa Brain Monitoring Industry Volume (K Unit), by Country 2024 & 2032
- Figure 17: Middle East and Africa Brain Monitoring Industry Revenue Share (%), by Country 2024 & 2032
- Figure 18: Middle East and Africa Brain Monitoring Industry Volume Share (%), by Country 2024 & 2032
- Figure 19: South America Brain Monitoring Industry Revenue (Million), by Country 2024 & 2032
- Figure 20: South America Brain Monitoring Industry Volume (K Unit), by Country 2024 & 2032
- Figure 21: South America Brain Monitoring Industry Revenue Share (%), by Country 2024 & 2032
- Figure 22: South America Brain Monitoring Industry Volume Share (%), by Country 2024 & 2032
- Figure 23: North America Brain Monitoring Industry Revenue (Million), by Product Type 2024 & 2032
- Figure 24: North America Brain Monitoring Industry Volume (K Unit), by Product Type 2024 & 2032
- Figure 25: North America Brain Monitoring Industry Revenue Share (%), by Product Type 2024 & 2032
- Figure 26: North America Brain Monitoring Industry Volume Share (%), by Product Type 2024 & 2032
- Figure 27: North America Brain Monitoring Industry Revenue (Million), by Application 2024 & 2032
- Figure 28: North America Brain Monitoring Industry Volume (K Unit), by Application 2024 & 2032
- Figure 29: North America Brain Monitoring Industry Revenue Share (%), by Application 2024 & 2032
- Figure 30: North America Brain Monitoring Industry Volume Share (%), by Application 2024 & 2032
- Figure 31: North America Brain Monitoring Industry Revenue (Million), by End User 2024 & 2032
- Figure 32: North America Brain Monitoring Industry Volume (K Unit), by End User 2024 & 2032
- Figure 33: North America Brain Monitoring Industry Revenue Share (%), by End User 2024 & 2032
- Figure 34: North America Brain Monitoring Industry Volume Share (%), by End User 2024 & 2032
- Figure 35: North America Brain Monitoring Industry Revenue (Million), by Country 2024 & 2032
- Figure 36: North America Brain Monitoring Industry Volume (K Unit), by Country 2024 & 2032
- Figure 37: North America Brain Monitoring Industry Revenue Share (%), by Country 2024 & 2032
- Figure 38: North America Brain Monitoring Industry Volume Share (%), by Country 2024 & 2032
- Figure 39: Europe Brain Monitoring Industry Revenue (Million), by Product Type 2024 & 2032
- Figure 40: Europe Brain Monitoring Industry Volume (K Unit), by Product Type 2024 & 2032
- Figure 41: Europe Brain Monitoring Industry Revenue Share (%), by Product Type 2024 & 2032
- Figure 42: Europe Brain Monitoring Industry Volume Share (%), by Product Type 2024 & 2032
- Figure 43: Europe Brain Monitoring Industry Revenue (Million), by Application 2024 & 2032
- Figure 44: Europe Brain Monitoring Industry Volume (K Unit), by Application 2024 & 2032
- Figure 45: Europe Brain Monitoring Industry Revenue Share (%), by Application 2024 & 2032
- Figure 46: Europe Brain Monitoring Industry Volume Share (%), by Application 2024 & 2032
- Figure 47: Europe Brain Monitoring Industry Revenue (Million), by End User 2024 & 2032
- Figure 48: Europe Brain Monitoring Industry Volume (K Unit), by End User 2024 & 2032
- Figure 49: Europe Brain Monitoring Industry Revenue Share (%), by End User 2024 & 2032
- Figure 50: Europe Brain Monitoring Industry Volume Share (%), by End User 2024 & 2032
- Figure 51: Europe Brain Monitoring Industry Revenue (Million), by Country 2024 & 2032
- Figure 52: Europe Brain Monitoring Industry Volume (K Unit), by Country 2024 & 2032
- Figure 53: Europe Brain Monitoring Industry Revenue Share (%), by Country 2024 & 2032
- Figure 54: Europe Brain Monitoring Industry Volume Share (%), by Country 2024 & 2032
- Figure 55: Asia Pacific Brain Monitoring Industry Revenue (Million), by Product Type 2024 & 2032
- Figure 56: Asia Pacific Brain Monitoring Industry Volume (K Unit), by Product Type 2024 & 2032
- Figure 57: Asia Pacific Brain Monitoring Industry Revenue Share (%), by Product Type 2024 & 2032
- Figure 58: Asia Pacific Brain Monitoring Industry Volume Share (%), by Product Type 2024 & 2032
- Figure 59: Asia Pacific Brain Monitoring Industry Revenue (Million), by Application 2024 & 2032
- Figure 60: Asia Pacific Brain Monitoring Industry Volume (K Unit), by Application 2024 & 2032
- Figure 61: Asia Pacific Brain Monitoring Industry Revenue Share (%), by Application 2024 & 2032
- Figure 62: Asia Pacific Brain Monitoring Industry Volume Share (%), by Application 2024 & 2032
- Figure 63: Asia Pacific Brain Monitoring Industry Revenue (Million), by End User 2024 & 2032
- Figure 64: Asia Pacific Brain Monitoring Industry Volume (K Unit), by End User 2024 & 2032
- Figure 65: Asia Pacific Brain Monitoring Industry Revenue Share (%), by End User 2024 & 2032
- Figure 66: Asia Pacific Brain Monitoring Industry Volume Share (%), by End User 2024 & 2032
- Figure 67: Asia Pacific Brain Monitoring Industry Revenue (Million), by Country 2024 & 2032
- Figure 68: Asia Pacific Brain Monitoring Industry Volume (K Unit), by Country 2024 & 2032
- Figure 69: Asia Pacific Brain Monitoring Industry Revenue Share (%), by Country 2024 & 2032
- Figure 70: Asia Pacific Brain Monitoring Industry Volume Share (%), by Country 2024 & 2032
- Figure 71: Middle East and Africa Brain Monitoring Industry Revenue (Million), by Product Type 2024 & 2032
- Figure 72: Middle East and Africa Brain Monitoring Industry Volume (K Unit), by Product Type 2024 & 2032
- Figure 73: Middle East and Africa Brain Monitoring Industry Revenue Share (%), by Product Type 2024 & 2032
- Figure 74: Middle East and Africa Brain Monitoring Industry Volume Share (%), by Product Type 2024 & 2032
- Figure 75: Middle East and Africa Brain Monitoring Industry Revenue (Million), by Application 2024 & 2032
- Figure 76: Middle East and Africa Brain Monitoring Industry Volume (K Unit), by Application 2024 & 2032
- Figure 77: Middle East and Africa Brain Monitoring Industry Revenue Share (%), by Application 2024 & 2032
- Figure 78: Middle East and Africa Brain Monitoring Industry Volume Share (%), by Application 2024 & 2032
- Figure 79: Middle East and Africa Brain Monitoring Industry Revenue (Million), by End User 2024 & 2032
- Figure 80: Middle East and Africa Brain Monitoring Industry Volume (K Unit), by End User 2024 & 2032
- Figure 81: Middle East and Africa Brain Monitoring Industry Revenue Share (%), by End User 2024 & 2032
- Figure 82: Middle East and Africa Brain Monitoring Industry Volume Share (%), by End User 2024 & 2032
- Figure 83: Middle East and Africa Brain Monitoring Industry Revenue (Million), by Country 2024 & 2032
- Figure 84: Middle East and Africa Brain Monitoring Industry Volume (K Unit), by Country 2024 & 2032
- Figure 85: Middle East and Africa Brain Monitoring Industry Revenue Share (%), by Country 2024 & 2032
- Figure 86: Middle East and Africa Brain Monitoring Industry Volume Share (%), by Country 2024 & 2032
- Figure 87: South America Brain Monitoring Industry Revenue (Million), by Product Type 2024 & 2032
- Figure 88: South America Brain Monitoring Industry Volume (K Unit), by Product Type 2024 & 2032
- Figure 89: South America Brain Monitoring Industry Revenue Share (%), by Product Type 2024 & 2032
- Figure 90: South America Brain Monitoring Industry Volume Share (%), by Product Type 2024 & 2032
- Figure 91: South America Brain Monitoring Industry Revenue (Million), by Application 2024 & 2032
- Figure 92: South America Brain Monitoring Industry Volume (K Unit), by Application 2024 & 2032
- Figure 93: South America Brain Monitoring Industry Revenue Share (%), by Application 2024 & 2032
- Figure 94: South America Brain Monitoring Industry Volume Share (%), by Application 2024 & 2032
- Figure 95: South America Brain Monitoring Industry Revenue (Million), by End User 2024 & 2032
- Figure 96: South America Brain Monitoring Industry Volume (K Unit), by End User 2024 & 2032
- Figure 97: South America Brain Monitoring Industry Revenue Share (%), by End User 2024 & 2032
- Figure 98: South America Brain Monitoring Industry Volume Share (%), by End User 2024 & 2032
- Figure 99: South America Brain Monitoring Industry Revenue (Million), by Country 2024 & 2032
- Figure 100: South America Brain Monitoring Industry Volume (K Unit), by Country 2024 & 2032
- Figure 101: South America Brain Monitoring Industry Revenue Share (%), by Country 2024 & 2032
- Figure 102: South America Brain Monitoring Industry Volume Share (%), by Country 2024 & 2032
List of Tables
- Table 1: Global Brain Monitoring Industry Revenue Million Forecast, by Region 2019 & 2032
- Table 2: Global Brain Monitoring Industry Volume K Unit Forecast, by Region 2019 & 2032
- Table 3: Global Brain Monitoring Industry Revenue Million Forecast, by Product Type 2019 & 2032
- Table 4: Global Brain Monitoring Industry Volume K Unit Forecast, by Product Type 2019 & 2032
- Table 5: Global Brain Monitoring Industry Revenue Million Forecast, by Application 2019 & 2032
- Table 6: Global Brain Monitoring Industry Volume K Unit Forecast, by Application 2019 & 2032
- Table 7: Global Brain Monitoring Industry Revenue Million Forecast, by End User 2019 & 2032
- Table 8: Global Brain Monitoring Industry Volume K Unit Forecast, by End User 2019 & 2032
- Table 9: Global Brain Monitoring Industry Revenue Million Forecast, by Region 2019 & 2032
- Table 10: Global Brain Monitoring Industry Volume K Unit Forecast, by Region 2019 & 2032
- Table 11: Global Brain Monitoring Industry Revenue Million Forecast, by Country 2019 & 2032
- Table 12: Global Brain Monitoring Industry Volume K Unit Forecast, by Country 2019 & 2032
- Table 13: United States Brain Monitoring Industry Revenue (Million) Forecast, by Application 2019 & 2032
- Table 14: United States Brain Monitoring Industry Volume (K Unit) Forecast, by Application 2019 & 2032
- Table 15: Canada Brain Monitoring Industry Revenue (Million) Forecast, by Application 2019 & 2032
- Table 16: Canada Brain Monitoring Industry Volume (K Unit) Forecast, by Application 2019 & 2032
- Table 17: Mexico Brain Monitoring Industry Revenue (Million) Forecast, by Application 2019 & 2032
- Table 18: Mexico Brain Monitoring Industry Volume (K Unit) Forecast, by Application 2019 & 2032
- Table 19: Global Brain Monitoring Industry Revenue Million Forecast, by Country 2019 & 2032
- Table 20: Global Brain Monitoring Industry Volume K Unit Forecast, by Country 2019 & 2032
- Table 21: Germany Brain Monitoring Industry Revenue (Million) Forecast, by Application 2019 & 2032
- Table 22: Germany Brain Monitoring Industry Volume (K Unit) Forecast, by Application 2019 & 2032
- Table 23: United Kingdom Brain Monitoring Industry Revenue (Million) Forecast, by Application 2019 & 2032
- Table 24: United Kingdom Brain Monitoring Industry Volume (K Unit) Forecast, by Application 2019 & 2032
- Table 25: France Brain Monitoring Industry Revenue (Million) Forecast, by Application 2019 & 2032
- Table 26: France Brain Monitoring Industry Volume (K Unit) Forecast, by Application 2019 & 2032
- Table 27: Italy Brain Monitoring Industry Revenue (Million) Forecast, by Application 2019 & 2032
- Table 28: Italy Brain Monitoring Industry Volume (K Unit) Forecast, by Application 2019 & 2032
- Table 29: Spain Brain Monitoring Industry Revenue (Million) Forecast, by Application 2019 & 2032
- Table 30: Spain Brain Monitoring Industry Volume (K Unit) Forecast, by Application 2019 & 2032
- Table 31: Rest of Europe Brain Monitoring Industry Revenue (Million) Forecast, by Application 2019 & 2032
- Table 32: Rest of Europe Brain Monitoring Industry Volume (K Unit) Forecast, by Application 2019 & 2032
- Table 33: Global Brain Monitoring Industry Revenue Million Forecast, by Country 2019 & 2032
- Table 34: Global Brain Monitoring Industry Volume K Unit Forecast, by Country 2019 & 2032
- Table 35: China Brain Monitoring Industry Revenue (Million) Forecast, by Application 2019 & 2032
- Table 36: China Brain Monitoring Industry Volume (K Unit) Forecast, by Application 2019 & 2032
- Table 37: Japan Brain Monitoring Industry Revenue (Million) Forecast, by Application 2019 & 2032
- Table 38: Japan Brain Monitoring Industry Volume (K Unit) Forecast, by Application 2019 & 2032
- Table 39: India Brain Monitoring Industry Revenue (Million) Forecast, by Application 2019 & 2032
- Table 40: India Brain Monitoring Industry Volume (K Unit) Forecast, by Application 2019 & 2032
- Table 41: Australia Brain Monitoring Industry Revenue (Million) Forecast, by Application 2019 & 2032
- Table 42: Australia Brain Monitoring Industry Volume (K Unit) Forecast, by Application 2019 & 2032
- Table 43: South Korea Brain Monitoring Industry Revenue (Million) Forecast, by Application 2019 & 2032
- Table 44: South Korea Brain Monitoring Industry Volume (K Unit) Forecast, by Application 2019 & 2032
- Table 45: Rest of Asia Pacific Brain Monitoring Industry Revenue (Million) Forecast, by Application 2019 & 2032
- Table 46: Rest of Asia Pacific Brain Monitoring Industry Volume (K Unit) Forecast, by Application 2019 & 2032
- Table 47: Global Brain Monitoring Industry Revenue Million Forecast, by Country 2019 & 2032
- Table 48: Global Brain Monitoring Industry Volume K Unit Forecast, by Country 2019 & 2032
- Table 49: GCC Brain Monitoring Industry Revenue (Million) Forecast, by Application 2019 & 2032
- Table 50: GCC Brain Monitoring Industry Volume (K Unit) Forecast, by Application 2019 & 2032
- Table 51: South Africa Brain Monitoring Industry Revenue (Million) Forecast, by Application 2019 & 2032
- Table 52: South Africa Brain Monitoring Industry Volume (K Unit) Forecast, by Application 2019 & 2032
- Table 53: Rest of Middle East and Africa Brain Monitoring Industry Revenue (Million) Forecast, by Application 2019 & 2032
- Table 54: Rest of Middle East and Africa Brain Monitoring Industry Volume (K Unit) Forecast, by Application 2019 & 2032
- Table 55: Global Brain Monitoring Industry Revenue Million Forecast, by Country 2019 & 2032
- Table 56: Global Brain Monitoring Industry Volume K Unit Forecast, by Country 2019 & 2032
- Table 57: Brazil Brain Monitoring Industry Revenue (Million) Forecast, by Application 2019 & 2032
- Table 58: Brazil Brain Monitoring Industry Volume (K Unit) Forecast, by Application 2019 & 2032
- Table 59: Argentina Brain Monitoring Industry Revenue (Million) Forecast, by Application 2019 & 2032
- Table 60: Argentina Brain Monitoring Industry Volume (K Unit) Forecast, by Application 2019 & 2032
- Table 61: Rest of South America Brain Monitoring Industry Revenue (Million) Forecast, by Application 2019 & 2032
- Table 62: Rest of South America Brain Monitoring Industry Volume (K Unit) Forecast, by Application 2019 & 2032
- Table 63: Global Brain Monitoring Industry Revenue Million Forecast, by Product Type 2019 & 2032
- Table 64: Global Brain Monitoring Industry Volume K Unit Forecast, by Product Type 2019 & 2032
- Table 65: Global Brain Monitoring Industry Revenue Million Forecast, by Application 2019 & 2032
- Table 66: Global Brain Monitoring Industry Volume K Unit Forecast, by Application 2019 & 2032
- Table 67: Global Brain Monitoring Industry Revenue Million Forecast, by End User 2019 & 2032
- Table 68: Global Brain Monitoring Industry Volume K Unit Forecast, by End User 2019 & 2032
- Table 69: Global Brain Monitoring Industry Revenue Million Forecast, by Country 2019 & 2032
- Table 70: Global Brain Monitoring Industry Volume K Unit Forecast, by Country 2019 & 2032
- Table 71: United States Brain Monitoring Industry Revenue (Million) Forecast, by Application 2019 & 2032
- Table 72: United States Brain Monitoring Industry Volume (K Unit) Forecast, by Application 2019 & 2032
- Table 73: Canada Brain Monitoring Industry Revenue (Million) Forecast, by Application 2019 & 2032
- Table 74: Canada Brain Monitoring Industry Volume (K Unit) Forecast, by Application 2019 & 2032
- Table 75: Mexico Brain Monitoring Industry Revenue (Million) Forecast, by Application 2019 & 2032
- Table 76: Mexico Brain Monitoring Industry Volume (K Unit) Forecast, by Application 2019 & 2032
- Table 77: Global Brain Monitoring Industry Revenue Million Forecast, by Product Type 2019 & 2032
- Table 78: Global Brain Monitoring Industry Volume K Unit Forecast, by Product Type 2019 & 2032
- Table 79: Global Brain Monitoring Industry Revenue Million Forecast, by Application 2019 & 2032
- Table 80: Global Brain Monitoring Industry Volume K Unit Forecast, by Application 2019 & 2032
- Table 81: Global Brain Monitoring Industry Revenue Million Forecast, by End User 2019 & 2032
- Table 82: Global Brain Monitoring Industry Volume K Unit Forecast, by End User 2019 & 2032
- Table 83: Global Brain Monitoring Industry Revenue Million Forecast, by Country 2019 & 2032
- Table 84: Global Brain Monitoring Industry Volume K Unit Forecast, by Country 2019 & 2032
- Table 85: Germany Brain Monitoring Industry Revenue (Million) Forecast, by Application 2019 & 2032
- Table 86: Germany Brain Monitoring Industry Volume (K Unit) Forecast, by Application 2019 & 2032
- Table 87: United Kingdom Brain Monitoring Industry Revenue (Million) Forecast, by Application 2019 & 2032
- Table 88: United Kingdom Brain Monitoring Industry Volume (K Unit) Forecast, by Application 2019 & 2032
- Table 89: France Brain Monitoring Industry Revenue (Million) Forecast, by Application 2019 & 2032
- Table 90: France Brain Monitoring Industry Volume (K Unit) Forecast, by Application 2019 & 2032
- Table 91: Italy Brain Monitoring Industry Revenue (Million) Forecast, by Application 2019 & 2032
- Table 92: Italy Brain Monitoring Industry Volume (K Unit) Forecast, by Application 2019 & 2032
- Table 93: Spain Brain Monitoring Industry Revenue (Million) Forecast, by Application 2019 & 2032
- Table 94: Spain Brain Monitoring Industry Volume (K Unit) Forecast, by Application 2019 & 2032
- Table 95: Rest of Europe Brain Monitoring Industry Revenue (Million) Forecast, by Application 2019 & 2032
- Table 96: Rest of Europe Brain Monitoring Industry Volume (K Unit) Forecast, by Application 2019 & 2032
- Table 97: Global Brain Monitoring Industry Revenue Million Forecast, by Product Type 2019 & 2032
- Table 98: Global Brain Monitoring Industry Volume K Unit Forecast, by Product Type 2019 & 2032
- Table 99: Global Brain Monitoring Industry Revenue Million Forecast, by Application 2019 & 2032
- Table 100: Global Brain Monitoring Industry Volume K Unit Forecast, by Application 2019 & 2032
- Table 101: Global Brain Monitoring Industry Revenue Million Forecast, by End User 2019 & 2032
- Table 102: Global Brain Monitoring Industry Volume K Unit Forecast, by End User 2019 & 2032
- Table 103: Global Brain Monitoring Industry Revenue Million Forecast, by Country 2019 & 2032
- Table 104: Global Brain Monitoring Industry Volume K Unit Forecast, by Country 2019 & 2032
- Table 105: China Brain Monitoring Industry Revenue (Million) Forecast, by Application 2019 & 2032
- Table 106: China Brain Monitoring Industry Volume (K Unit) Forecast, by Application 2019 & 2032
- Table 107: Japan Brain Monitoring Industry Revenue (Million) Forecast, by Application 2019 & 2032
- Table 108: Japan Brain Monitoring Industry Volume (K Unit) Forecast, by Application 2019 & 2032
- Table 109: India Brain Monitoring Industry Revenue (Million) Forecast, by Application 2019 & 2032
- Table 110: India Brain Monitoring Industry Volume (K Unit) Forecast, by Application 2019 & 2032
- Table 111: Australia Brain Monitoring Industry Revenue (Million) Forecast, by Application 2019 & 2032
- Table 112: Australia Brain Monitoring Industry Volume (K Unit) Forecast, by Application 2019 & 2032
- Table 113: South Korea Brain Monitoring Industry Revenue (Million) Forecast, by Application 2019 & 2032
- Table 114: South Korea Brain Monitoring Industry Volume (K Unit) Forecast, by Application 2019 & 2032
- Table 115: Rest of Asia Pacific Brain Monitoring Industry Revenue (Million) Forecast, by Application 2019 & 2032
- Table 116: Rest of Asia Pacific Brain Monitoring Industry Volume (K Unit) Forecast, by Application 2019 & 2032
- Table 117: Global Brain Monitoring Industry Revenue Million Forecast, by Product Type 2019 & 2032
- Table 118: Global Brain Monitoring Industry Volume K Unit Forecast, by Product Type 2019 & 2032
- Table 119: Global Brain Monitoring Industry Revenue Million Forecast, by Application 2019 & 2032
- Table 120: Global Brain Monitoring Industry Volume K Unit Forecast, by Application 2019 & 2032
- Table 121: Global Brain Monitoring Industry Revenue Million Forecast, by End User 2019 & 2032
- Table 122: Global Brain Monitoring Industry Volume K Unit Forecast, by End User 2019 & 2032
- Table 123: Global Brain Monitoring Industry Revenue Million Forecast, by Country 2019 & 2032
- Table 124: Global Brain Monitoring Industry Volume K Unit Forecast, by Country 2019 & 2032
- Table 125: GCC Brain Monitoring Industry Revenue (Million) Forecast, by Application 2019 & 2032
- Table 126: GCC Brain Monitoring Industry Volume (K Unit) Forecast, by Application 2019 & 2032
- Table 127: South Africa Brain Monitoring Industry Revenue (Million) Forecast, by Application 2019 & 2032
- Table 128: South Africa Brain Monitoring Industry Volume (K Unit) Forecast, by Application 2019 & 2032
- Table 129: Rest of Middle East and Africa Brain Monitoring Industry Revenue (Million) Forecast, by Application 2019 & 2032
- Table 130: Rest of Middle East and Africa Brain Monitoring Industry Volume (K Unit) Forecast, by Application 2019 & 2032
- Table 131: Global Brain Monitoring Industry Revenue Million Forecast, by Product Type 2019 & 2032
- Table 132: Global Brain Monitoring Industry Volume K Unit Forecast, by Product Type 2019 & 2032
- Table 133: Global Brain Monitoring Industry Revenue Million Forecast, by Application 2019 & 2032
- Table 134: Global Brain Monitoring Industry Volume K Unit Forecast, by Application 2019 & 2032
- Table 135: Global Brain Monitoring Industry Revenue Million Forecast, by End User 2019 & 2032
- Table 136: Global Brain Monitoring Industry Volume K Unit Forecast, by End User 2019 & 2032
- Table 137: Global Brain Monitoring Industry Revenue Million Forecast, by Country 2019 & 2032
- Table 138: Global Brain Monitoring Industry Volume K Unit Forecast, by Country 2019 & 2032
- Table 139: Brazil Brain Monitoring Industry Revenue (Million) Forecast, by Application 2019 & 2032
- Table 140: Brazil Brain Monitoring Industry Volume (K Unit) Forecast, by Application 2019 & 2032
- Table 141: Argentina Brain Monitoring Industry Revenue (Million) Forecast, by Application 2019 & 2032
- Table 142: Argentina Brain Monitoring Industry Volume (K Unit) Forecast, by Application 2019 & 2032
- Table 143: Rest of South America Brain Monitoring Industry Revenue (Million) Forecast, by Application 2019 & 2032
- Table 144: Rest of South America Brain Monitoring Industry Volume (K Unit) Forecast, by Application 2019 & 2032
Frequently Asked Questions
1. What is the projected Compound Annual Growth Rate (CAGR) of the Brain Monitoring Industry?
The projected CAGR is approximately 6.35%.
2. Which companies are prominent players in the Brain Monitoring Industry?
Key companies in the market include Natus Medical Incorporated, Compumedics, Masimo Corporation, Nonin Medical Inc, Medtronic PLC, Advanced Brain Monitoring Inc, Cadwell Industries Inc, Koninklijke Philips NV, Integra Lifesciences Corporation, Cerenion Oy, Nihon Kohden Corporation, General Electric Company.
3. What are the main segments of the Brain Monitoring Industry?
The market segments include Product Type, Application, End User.
4. Can you provide details about the market size?
The market size is estimated to be USD 6.80 Million as of 2022.
5. What are some drivers contributing to market growth?
Growing Geriatric Population; Rise in Incidences of Brain Disorders; Technological Advancements in Brain Monitoring Devices.
6. What are the notable trends driving market growth?
Electroencephalograph is Expected Witness a Healthy Growth Over the Forecast Period.
7. Are there any restraints impacting market growth?
Stringent Regulations for the Device Approval; Lack of Skilled Personnel to Handle Devices.
8. Can you provide examples of recent developments in the market?
November 2022: Neurosteer Inc. received FDA clearance for its Neurosteer single-channel EEG brain monitoring platform. This clearance enables the use of Neurosteer's unobtrusive multi-purpose system in a broad range of clinical settings. The platform offers continuous brain monitoring in the ICU to support critical interventions, and aids in the early detection of pre-symptomatic cognitive decline, including Alzheimer's, Parkinson's, and dementia, in a doctor's office. It assists in the rapid and cost-effective massive screening of subjects who may be suffering from neurodegenerative disorders in pharma drug trials.
9. What pricing options are available for accessing the report?
Pricing options include single-user, multi-user, and enterprise licenses priced at USD 4750, USD 5250, and USD 8750 respectively.
10. Is the market size provided in terms of value or volume?
The market size is provided in terms of value, measured in Million and volume, measured in K Unit.
11. Are there any specific market keywords associated with the report?
Yes, the market keyword associated with the report is "Brain Monitoring Industry," which aids in identifying and referencing the specific market segment covered.
12. How do I determine which pricing option suits my needs best?
The pricing options vary based on user requirements and access needs. Individual users may opt for single-user licenses, while businesses requiring broader access may choose multi-user or enterprise licenses for cost-effective access to the report.
13. Are there any additional resources or data provided in the Brain Monitoring Industry report?
While the report offers comprehensive insights, it's advisable to review the specific contents or supplementary materials provided to ascertain if additional resources or data are available.
14. How can I stay updated on further developments or reports in the Brain Monitoring Industry?
To stay informed about further developments, trends, and reports in the Brain Monitoring Industry, consider subscribing to industry newsletters, following relevant companies and organizations, or regularly checking reputable industry news sources and publications.
Methodology
Step 1 - Identification of Relevant Samples Size from Population Database


Step 2 - Approaches for Defining Global Market Size (Value, Volume* & Price*)

Note*: In applicable scenarios
Step 3 - Data Sources
Primary Research
- Web Analytics
- Survey Reports
- Research Institute
- Latest Research Reports
- Opinion Leaders
Secondary Research
- Annual Reports
- White Paper
- Latest Press Release
- Industry Association
- Paid Database
- Investor Presentations

Step 4 - Data Triangulation
Involves using different sources of information in order to increase the validity of a study
These sources are likely to be stakeholders in a program - participants, other researchers, program staff, other community members, and so on.
Then we put all data in single framework & apply various statistical tools to find out the dynamic on the market.
During the analysis stage, feedback from the stakeholder groups would be compared to determine areas of agreement as well as areas of divergence


