
Key Insights
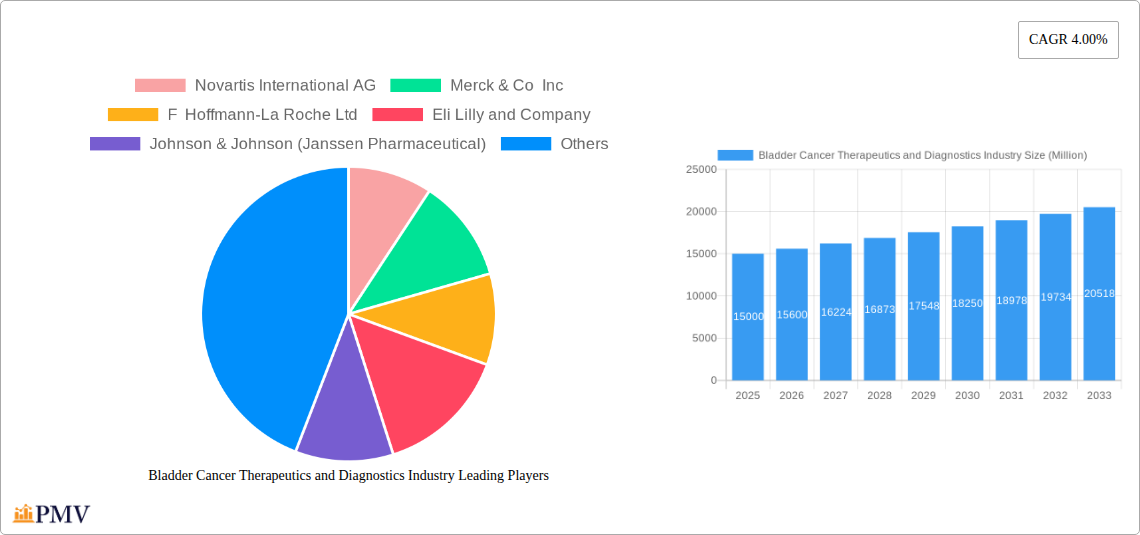
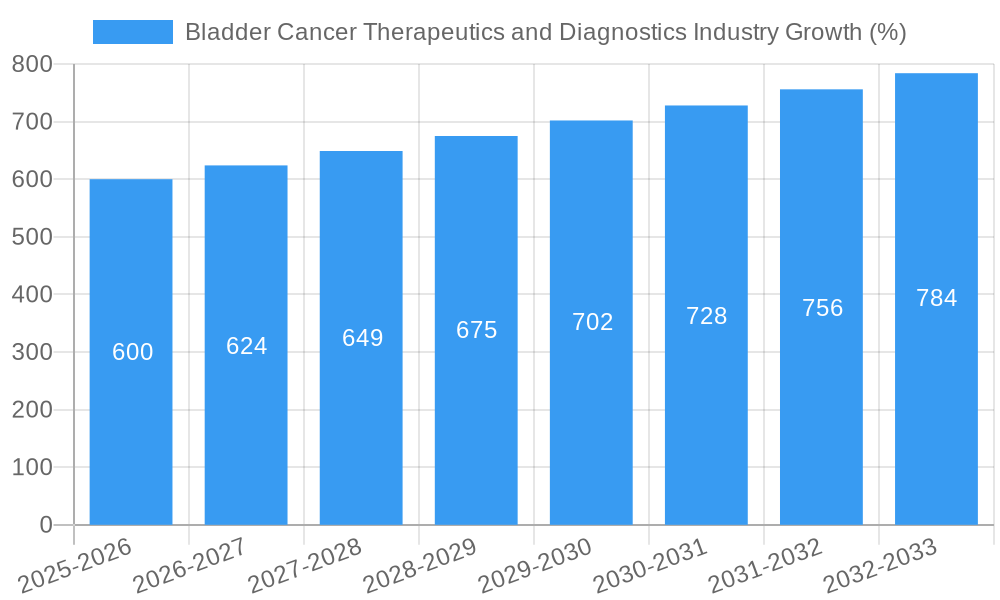
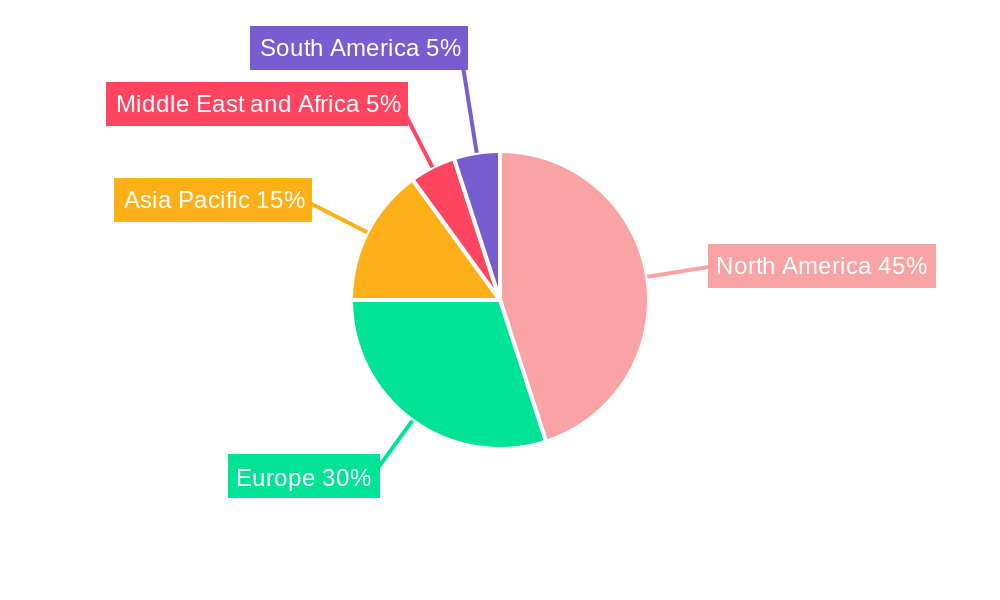
The global bladder cancer therapeutics and diagnostics market is experiencing steady growth, projected to maintain a Compound Annual Growth Rate (CAGR) of 4.00% from 2025 to 2033. This expansion is fueled by several key drivers. Rising incidence rates of bladder cancer, particularly transitional cell carcinoma, the most prevalent type, are significantly contributing to market growth. Advancements in diagnostic technologies, including improved imaging techniques and biomarker detection, enable earlier and more accurate diagnosis, leading to timely intervention and improved patient outcomes. Furthermore, the development and approval of novel targeted therapies and immunotherapies are offering enhanced treatment options with improved efficacy and reduced side effects compared to traditional chemotherapy. The increasing geriatric population, a key demographic susceptible to bladder cancer, further boosts market demand. However, high treatment costs associated with advanced therapies and the complexities involved in early detection, particularly in resource-constrained settings, pose challenges to market growth. The market is segmented by product type (therapeutics and diagnostics), cancer type (transitional cell, squamous cell, and other), and geography. North America and Europe currently dominate the market, driven by robust healthcare infrastructure and higher adoption of advanced technologies. However, Asia-Pacific is expected to witness significant growth during the forecast period due to rising healthcare expenditure and increasing awareness about bladder cancer. Competition is intense, with major pharmaceutical and diagnostic companies like Novartis, Merck, Roche, and others actively engaged in research and development, striving for a larger market share.
The competitive landscape is characterized by both established players and emerging companies. Major pharmaceutical companies are focusing on developing innovative therapies, including immunotherapy and targeted agents, while diagnostic companies are concentrating on improving diagnostic accuracy and accessibility. Strategic collaborations and mergers & acquisitions are also shaping the competitive dynamics. The market is expected to witness a continuous influx of new drugs and diagnostic tools, further driving innovation and competition. The continued focus on personalized medicine and the development of companion diagnostics will also influence market trends in the coming years. Growth is further supported by increased government funding for cancer research and growing public and private investment in the development of novel treatment strategies. The market's future trajectory will depend on factors such as the success of ongoing clinical trials, regulatory approvals, pricing strategies, and the availability of reimbursement policies.
Bladder Cancer Therapeutics and Diagnostics Industry: A Comprehensive Market Report (2019-2033)
This in-depth report provides a comprehensive analysis of the Bladder Cancer Therapeutics and Diagnostics industry, offering actionable insights for stakeholders across the value chain. The study period covers 2019-2033, with a base year of 2025 and a forecast period of 2025-2033. The report meticulously examines market segmentation, competitive dynamics, technological advancements, and regulatory landscapes impacting the industry's growth trajectory. Expected market size values in Million USD are provided where data is available; otherwise, estimations are marked as "xx".
Bladder Cancer Therapeutics and Diagnostics Industry Market Structure & Competitive Dynamics
The bladder cancer therapeutics and diagnostics market is characterized by a moderately concentrated structure with several large multinational pharmaceutical and diagnostic companies holding significant market share. Key players include Novartis International AG, Merck & Co Inc, F Hoffmann-La Roche Ltd, Eli Lilly and Company, Johnson & Johnson (Janssen Pharmaceutical), and others. The competitive landscape is dynamic, driven by ongoing R&D efforts focused on innovative therapies and improved diagnostic tools. Market share fluctuates based on product launches, clinical trial outcomes, and regulatory approvals. Innovation ecosystems are crucial, fostering collaborations between pharmaceutical companies, academic institutions, and biotech firms. Regulatory frameworks, particularly those set by the FDA and EMA, significantly influence market access and product approval timelines. The market experiences competition from alternative treatments and diagnostic methods, prompting ongoing innovation to maintain a competitive edge. Mergers and acquisitions (M&A) play a significant role in market consolidation and expansion, with deal values reaching xx Million in recent years, representing a major driver of market evolution. End-user trends, including increased demand for minimally invasive procedures and personalized medicine, are reshaping market dynamics. Overall, the market exhibits strong growth prospects driven by rising prevalence of bladder cancer and advancements in treatment modalities.
Bladder Cancer Therapeutics and Diagnostics Industry Industry Trends & Insights
The bladder cancer therapeutics and diagnostics market is experiencing robust growth, driven by several key factors. The increasing prevalence of bladder cancer globally is a primary driver. Technological advancements, particularly in immunotherapy, targeted therapy, and minimally invasive diagnostic techniques, are revolutionizing treatment and early detection. Changing consumer preferences toward personalized medicine and improved patient outcomes are also influencing the market. The market's CAGR is projected to be xx% during the forecast period (2025-2033), exceeding previous years' growth due to increasing awareness of the disease and improved treatment options. Market penetration of advanced diagnostic tools and novel therapies is gradually increasing, although challenges remain in terms of access and affordability in certain regions. The competitive dynamics within the market remain intense, with leading players engaging in strategic collaborations, M&A activities, and aggressive R&D initiatives to maintain their market position. The introduction of novel biomarkers and diagnostic assays continues to improve early detection rates, thus boosting the early diagnosis and subsequent treatment uptake. However, a significant barrier to market growth is the high cost of innovative treatments, limiting accessibility for many patients.
Dominant Markets & Segments in Bladder Cancer Therapeutics and Diagnostics Industry
- Leading Region: North America currently holds the largest market share, driven by high healthcare expenditure, advanced healthcare infrastructure, and a large patient pool. This dominance is projected to continue through the forecast period.
- Leading Country: The United States, within North America, is the leading country in the market, reflecting strong R&D investment and the presence of numerous major pharmaceutical and diagnostic companies.
- Dominant Product Segment: Therapeutics dominate the market, driven by the high prevalence of bladder cancer and continuous innovation in treatment modalities.
- Dominant Diagnostic Segment: Immunohistochemistry (IHC) assays represent a large segment of the diagnostics market, with the demand driven by its reliability in assessing cancer staging.
- Dominant Cancer Type: Transitional cell bladder cancer accounts for the majority of cases globally, making it the largest segment within the overall market.
Key drivers for dominance in North America and the US include robust healthcare infrastructure, high disposable income levels, favorable regulatory environments, and substantial investments in healthcare research. These factors support the development and adoption of advanced diagnostic tools and innovative therapies. Europe and Asia-Pacific are also witnessing significant growth, albeit at a slower pace due to varying levels of healthcare expenditure and infrastructural limitations.
Bladder Cancer Therapeutics and Diagnostics Industry Product Innovations
Recent years have witnessed significant advancements in bladder cancer therapeutics and diagnostics. Novel immunotherapies, including checkpoint inhibitors and oncolytic viruses, have shown promising results in extending patient survival and improving quality of life. Targeted therapies, utilizing small molecule inhibitors and antibody-drug conjugates, are increasingly used to treat specific molecular subtypes of bladder cancer. Diagnostic innovations include improved imaging techniques (e.g., advanced cystoscopy, MRI, CT) and more sensitive molecular diagnostic assays, enabling earlier and more precise diagnosis. These innovations provide enhanced treatment options, allowing for personalized approaches tailored to individual patient characteristics and disease profiles. The overall trend is toward minimally invasive procedures, improved patient comfort, and targeted therapies aimed at minimizing side effects and improving treatment efficacy.
Report Segmentation & Scope
This report segments the bladder cancer therapeutics and diagnostics market across multiple dimensions.
Product: The report analyzes the therapeutics segment, further divided into immunotherapy, chemotherapy, targeted therapy, and other therapies. The diagnostics segment comprises imaging techniques, molecular diagnostics, and other diagnostic tools.
Cancer Type: The market is segmented by cancer type, including Transitional Cell Bladder Cancer, Squamous Cell Bladder Cancer, and Other Cancer Types. Growth projections and competitive dynamics are analyzed for each segment. Each segment's market size and growth projections are detailed within the report, outlining the competitive landscape and influencing factors.
Key Drivers of Bladder Cancer Therapeutics and Diagnostics Industry Growth
Several factors are driving growth in the bladder cancer therapeutics and diagnostics market. The rising prevalence of bladder cancer globally is a major factor, driven by aging populations and lifestyle factors such as tobacco use. Technological advancements, including improved diagnostic techniques (e.g., Nanostics' ClarityDX Bladder test) and novel treatment modalities (e.g., FDA review of ImmunityBio's N-803), are significantly enhancing treatment outcomes and early detection rates. Increasing healthcare expenditure and insurance coverage in developed and developing economies are further boosting market growth. Finally, growing awareness among patients and healthcare professionals regarding bladder cancer and its management options is playing a crucial role.
Challenges in the Bladder Cancer Therapeutics and Diagnostics Industry Sector
Despite significant advancements, the bladder cancer therapeutics and diagnostics industry faces several challenges. High treatment costs often restrict access to innovative therapies, particularly in low- and middle-income countries. The development and regulatory approval of new drugs and diagnostic tools is a lengthy and costly process. Competition among established pharmaceutical companies is fierce, impacting profitability. Supply chain disruptions and manufacturing bottlenecks can also impact availability. Furthermore, the heterogeneity of bladder cancer itself poses challenges to developing effective and universally applicable therapies.
Leading Players in the Bladder Cancer Therapeutics and Diagnostics Industry Market
- Novartis International AG
- Merck & Co Inc
- F Hoffmann-La Roche Ltd
- Eli Lilly and Company
- Johnson & Johnson (Janssen Pharmaceutical)
- Ameritech Diagnostic Reagent(Jiaxing)Co Ltd
- Endo Pharmaceuticals Inc
- Astellas Pharma Inc
- Abbott Inc
- Bristol-Myers Squibb Company
- GlaxoSmithKline PLC
- Pfizer Inc
Key Developments in Bladder Cancer Therapeutics and Diagnostics Industry Sector
- July 2022: The United States Food and Drug Administration (FDA) agreed to review ImmunityBio's Biologics License Application (BLA) for N-803 for non-muscle-invasive bladder cancer (NMIBC). This development signifies progress in the treatment landscape and potentially broadens treatment options for NMIBC patients.
- July 2022: Nanostics Inc. launched a prospective clinical study for its ClarityDX Bladder diagnostic test, aiming to validate a novel minimally invasive approach for bladder cancer detection. This highlights ongoing efforts to improve early detection and diagnosis.
Strategic Bladder Cancer Therapeutics and Diagnostics Industry Market Outlook
The bladder cancer therapeutics and diagnostics market is poised for continued growth, driven by the unmet medical needs, ongoing technological advancements, and a growing awareness of the disease. Future market potential lies in the development and adoption of personalized therapies, improved diagnostic tools, and targeted therapies that minimize side effects and enhance patient outcomes. Strategic opportunities exist for companies to focus on developing novel biomarkers, improving early detection, and accelerating the development and approval of effective therapies for advanced and metastatic bladder cancer. Continued focus on R&D investments, strategic partnerships, and improved accessibility to treatment are crucial to unlocking the full potential of this market.
Bladder Cancer Therapeutics and Diagnostics Industry Segmentation
-
1. Product
-
1.1. Therapeutics
- 1.1.1. Chemotherapy
- 1.1.2. Immunotherapy
- 1.1.3. Other Therapeuticss
-
1.2. Diagnostics
- 1.2.1. Cystoscopy
- 1.2.2. Bladder Ultrasound
- 1.2.3. Urinalysis
- 1.2.4. Other Diagnostics
-
1.1. Therapeutics
-
2. Cancer Type
- 2.1. Transitional Cell Bladder Cancer
- 2.2. Squamous Cell Bladder Cancer
- 2.3. Other Cancer Types
Bladder Cancer Therapeutics and Diagnostics Industry Segmentation By Geography
-
1. North America
- 1.1. United States
- 1.2. Canada
- 1.3. Mexico
-
2. Europe
- 2.1. Germany
- 2.2. United Kingdom
- 2.3. France
- 2.4. Italy
- 2.5. Spain
- 2.6. Rest of Europe
-
3. Asia Pacific
- 3.1. China
- 3.2. Japan
- 3.3. India
- 3.4. Australia
- 3.5. South Korea
- 3.6. Rest of Asia Pacific
-
4. Middle East and Africa
- 4.1. GCC
- 4.2. South Africa
- 4.3. Rest of Middle East and Africa
-
5. South America
- 5.1. Brazil
- 5.2. Argentina
- 5.3. Rest of South America
Bladder Cancer Therapeutics and Diagnostics Industry REPORT HIGHLIGHTS
| Aspects | Details |
|---|---|
| Study Period | 2019-2033 |
| Base Year | 2024 |
| Estimated Year | 2025 |
| Forecast Period | 2025-2033 |
| Historical Period | 2019-2024 |
| Growth Rate | CAGR of 4.00% from 2019-2033 |
| Segmentation |
|
Table of Contents
- 1. Introduction
- 1.1. Research Scope
- 1.2. Market Segmentation
- 1.3. Research Methodology
- 1.4. Definitions and Assumptions
- 2. Executive Summary
- 2.1. Introduction
- 3. Market Dynamics
- 3.1. Introduction
- 3.2. Market Drivers
- 3.2.1. Increasing Awareness on Bladder Diseases and Available Therapies; Increasing Healthcare Expenditure; Increasing Burden of Bladder Cancer
- 3.3. Market Restrains
- 3.3.1. Rise in the Number of Patent Expiration and Increased Use of Generic Drugs; Asymptomatic Nature of the Disease
- 3.4. Market Trends
- 3.4.1. Cystoscopy is Anticipated to be the Dominant Segment in Studied Market Over the Forecast Period
- 4. Market Factor Analysis
- 4.1. Porters Five Forces
- 4.2. Supply/Value Chain
- 4.3. PESTEL analysis
- 4.4. Market Entropy
- 4.5. Patent/Trademark Analysis
- 5. Global Bladder Cancer Therapeutics and Diagnostics Industry Analysis, Insights and Forecast, 2019-2031
- 5.1. Market Analysis, Insights and Forecast - by Product
- 5.1.1. Therapeutics
- 5.1.1.1. Chemotherapy
- 5.1.1.2. Immunotherapy
- 5.1.1.3. Other Therapeuticss
- 5.1.2. Diagnostics
- 5.1.2.1. Cystoscopy
- 5.1.2.2. Bladder Ultrasound
- 5.1.2.3. Urinalysis
- 5.1.2.4. Other Diagnostics
- 5.1.1. Therapeutics
- 5.2. Market Analysis, Insights and Forecast - by Cancer Type
- 5.2.1. Transitional Cell Bladder Cancer
- 5.2.2. Squamous Cell Bladder Cancer
- 5.2.3. Other Cancer Types
- 5.3. Market Analysis, Insights and Forecast - by Region
- 5.3.1. North America
- 5.3.2. Europe
- 5.3.3. Asia Pacific
- 5.3.4. Middle East and Africa
- 5.3.5. South America
- 5.1. Market Analysis, Insights and Forecast - by Product
- 6. North America Bladder Cancer Therapeutics and Diagnostics Industry Analysis, Insights and Forecast, 2019-2031
- 6.1. Market Analysis, Insights and Forecast - by Product
- 6.1.1. Therapeutics
- 6.1.1.1. Chemotherapy
- 6.1.1.2. Immunotherapy
- 6.1.1.3. Other Therapeuticss
- 6.1.2. Diagnostics
- 6.1.2.1. Cystoscopy
- 6.1.2.2. Bladder Ultrasound
- 6.1.2.3. Urinalysis
- 6.1.2.4. Other Diagnostics
- 6.1.1. Therapeutics
- 6.2. Market Analysis, Insights and Forecast - by Cancer Type
- 6.2.1. Transitional Cell Bladder Cancer
- 6.2.2. Squamous Cell Bladder Cancer
- 6.2.3. Other Cancer Types
- 6.1. Market Analysis, Insights and Forecast - by Product
- 7. Europe Bladder Cancer Therapeutics and Diagnostics Industry Analysis, Insights and Forecast, 2019-2031
- 7.1. Market Analysis, Insights and Forecast - by Product
- 7.1.1. Therapeutics
- 7.1.1.1. Chemotherapy
- 7.1.1.2. Immunotherapy
- 7.1.1.3. Other Therapeuticss
- 7.1.2. Diagnostics
- 7.1.2.1. Cystoscopy
- 7.1.2.2. Bladder Ultrasound
- 7.1.2.3. Urinalysis
- 7.1.2.4. Other Diagnostics
- 7.1.1. Therapeutics
- 7.2. Market Analysis, Insights and Forecast - by Cancer Type
- 7.2.1. Transitional Cell Bladder Cancer
- 7.2.2. Squamous Cell Bladder Cancer
- 7.2.3. Other Cancer Types
- 7.1. Market Analysis, Insights and Forecast - by Product
- 8. Asia Pacific Bladder Cancer Therapeutics and Diagnostics Industry Analysis, Insights and Forecast, 2019-2031
- 8.1. Market Analysis, Insights and Forecast - by Product
- 8.1.1. Therapeutics
- 8.1.1.1. Chemotherapy
- 8.1.1.2. Immunotherapy
- 8.1.1.3. Other Therapeuticss
- 8.1.2. Diagnostics
- 8.1.2.1. Cystoscopy
- 8.1.2.2. Bladder Ultrasound
- 8.1.2.3. Urinalysis
- 8.1.2.4. Other Diagnostics
- 8.1.1. Therapeutics
- 8.2. Market Analysis, Insights and Forecast - by Cancer Type
- 8.2.1. Transitional Cell Bladder Cancer
- 8.2.2. Squamous Cell Bladder Cancer
- 8.2.3. Other Cancer Types
- 8.1. Market Analysis, Insights and Forecast - by Product
- 9. Middle East and Africa Bladder Cancer Therapeutics and Diagnostics Industry Analysis, Insights and Forecast, 2019-2031
- 9.1. Market Analysis, Insights and Forecast - by Product
- 9.1.1. Therapeutics
- 9.1.1.1. Chemotherapy
- 9.1.1.2. Immunotherapy
- 9.1.1.3. Other Therapeuticss
- 9.1.2. Diagnostics
- 9.1.2.1. Cystoscopy
- 9.1.2.2. Bladder Ultrasound
- 9.1.2.3. Urinalysis
- 9.1.2.4. Other Diagnostics
- 9.1.1. Therapeutics
- 9.2. Market Analysis, Insights and Forecast - by Cancer Type
- 9.2.1. Transitional Cell Bladder Cancer
- 9.2.2. Squamous Cell Bladder Cancer
- 9.2.3. Other Cancer Types
- 9.1. Market Analysis, Insights and Forecast - by Product
- 10. South America Bladder Cancer Therapeutics and Diagnostics Industry Analysis, Insights and Forecast, 2019-2031
- 10.1. Market Analysis, Insights and Forecast - by Product
- 10.1.1. Therapeutics
- 10.1.1.1. Chemotherapy
- 10.1.1.2. Immunotherapy
- 10.1.1.3. Other Therapeuticss
- 10.1.2. Diagnostics
- 10.1.2.1. Cystoscopy
- 10.1.2.2. Bladder Ultrasound
- 10.1.2.3. Urinalysis
- 10.1.2.4. Other Diagnostics
- 10.1.1. Therapeutics
- 10.2. Market Analysis, Insights and Forecast - by Cancer Type
- 10.2.1. Transitional Cell Bladder Cancer
- 10.2.2. Squamous Cell Bladder Cancer
- 10.2.3. Other Cancer Types
- 10.1. Market Analysis, Insights and Forecast - by Product
- 11. North America Bladder Cancer Therapeutics and Diagnostics Industry Analysis, Insights and Forecast, 2019-2031
- 11.1. Market Analysis, Insights and Forecast - By Country/Sub-region
- 11.1.1 United States
- 11.1.2 Canada
- 11.1.3 Mexico
- 12. Europe Bladder Cancer Therapeutics and Diagnostics Industry Analysis, Insights and Forecast, 2019-2031
- 12.1. Market Analysis, Insights and Forecast - By Country/Sub-region
- 12.1.1 Germany
- 12.1.2 United Kingdom
- 12.1.3 France
- 12.1.4 Italy
- 12.1.5 Spain
- 12.1.6 Rest of Europe
- 13. Asia Pacific Bladder Cancer Therapeutics and Diagnostics Industry Analysis, Insights and Forecast, 2019-2031
- 13.1. Market Analysis, Insights and Forecast - By Country/Sub-region
- 13.1.1 China
- 13.1.2 Japan
- 13.1.3 India
- 13.1.4 Australia
- 13.1.5 South Korea
- 13.1.6 Rest of Asia Pacific
- 14. Middle East and Africa Bladder Cancer Therapeutics and Diagnostics Industry Analysis, Insights and Forecast, 2019-2031
- 14.1. Market Analysis, Insights and Forecast - By Country/Sub-region
- 14.1.1 GCC
- 14.1.2 South Africa
- 14.1.3 Rest of Middle East and Africa
- 15. South America Bladder Cancer Therapeutics and Diagnostics Industry Analysis, Insights and Forecast, 2019-2031
- 15.1. Market Analysis, Insights and Forecast - By Country/Sub-region
- 15.1.1 Brazil
- 15.1.2 Argentina
- 15.1.3 Rest of South America
- 16. Competitive Analysis
- 16.1. Global Market Share Analysis 2024
- 16.2. Company Profiles
- 16.2.1 Novartis International AG
- 16.2.1.1. Overview
- 16.2.1.2. Products
- 16.2.1.3. SWOT Analysis
- 16.2.1.4. Recent Developments
- 16.2.1.5. Financials (Based on Availability)
- 16.2.2 Merck & Co Inc
- 16.2.2.1. Overview
- 16.2.2.2. Products
- 16.2.2.3. SWOT Analysis
- 16.2.2.4. Recent Developments
- 16.2.2.5. Financials (Based on Availability)
- 16.2.3 F Hoffmann-La Roche Ltd
- 16.2.3.1. Overview
- 16.2.3.2. Products
- 16.2.3.3. SWOT Analysis
- 16.2.3.4. Recent Developments
- 16.2.3.5. Financials (Based on Availability)
- 16.2.4 Eli Lilly and Company
- 16.2.4.1. Overview
- 16.2.4.2. Products
- 16.2.4.3. SWOT Analysis
- 16.2.4.4. Recent Developments
- 16.2.4.5. Financials (Based on Availability)
- 16.2.5 Johnson & Johnson (Janssen Pharmaceutical)
- 16.2.5.1. Overview
- 16.2.5.2. Products
- 16.2.5.3. SWOT Analysis
- 16.2.5.4. Recent Developments
- 16.2.5.5. Financials (Based on Availability)
- 16.2.6 Ameritech Diagnostic Reagent(Jiaxing)Co Ltd
- 16.2.6.1. Overview
- 16.2.6.2. Products
- 16.2.6.3. SWOT Analysis
- 16.2.6.4. Recent Developments
- 16.2.6.5. Financials (Based on Availability)
- 16.2.7 Endo Pharmaceuticals Inc
- 16.2.7.1. Overview
- 16.2.7.2. Products
- 16.2.7.3. SWOT Analysis
- 16.2.7.4. Recent Developments
- 16.2.7.5. Financials (Based on Availability)
- 16.2.8 Astellas Pharma Inc
- 16.2.8.1. Overview
- 16.2.8.2. Products
- 16.2.8.3. SWOT Analysis
- 16.2.8.4. Recent Developments
- 16.2.8.5. Financials (Based on Availability)
- 16.2.9 Abbott Inc
- 16.2.9.1. Overview
- 16.2.9.2. Products
- 16.2.9.3. SWOT Analysis
- 16.2.9.4. Recent Developments
- 16.2.9.5. Financials (Based on Availability)
- 16.2.10 Bristol-Myers Squibb Company
- 16.2.10.1. Overview
- 16.2.10.2. Products
- 16.2.10.3. SWOT Analysis
- 16.2.10.4. Recent Developments
- 16.2.10.5. Financials (Based on Availability)
- 16.2.11 GlaxoSmithKline PLC
- 16.2.11.1. Overview
- 16.2.11.2. Products
- 16.2.11.3. SWOT Analysis
- 16.2.11.4. Recent Developments
- 16.2.11.5. Financials (Based on Availability)
- 16.2.12 Pfizer Inc
- 16.2.12.1. Overview
- 16.2.12.2. Products
- 16.2.12.3. SWOT Analysis
- 16.2.12.4. Recent Developments
- 16.2.12.5. Financials (Based on Availability)
- 16.2.1 Novartis International AG
List of Figures
- Figure 1: Global Bladder Cancer Therapeutics and Diagnostics Industry Revenue Breakdown (Million, %) by Region 2024 & 2032
- Figure 2: Global Bladder Cancer Therapeutics and Diagnostics Industry Volume Breakdown (K Unit, %) by Region 2024 & 2032
- Figure 3: North America Bladder Cancer Therapeutics and Diagnostics Industry Revenue (Million), by Country 2024 & 2032
- Figure 4: North America Bladder Cancer Therapeutics and Diagnostics Industry Volume (K Unit), by Country 2024 & 2032
- Figure 5: North America Bladder Cancer Therapeutics and Diagnostics Industry Revenue Share (%), by Country 2024 & 2032
- Figure 6: North America Bladder Cancer Therapeutics and Diagnostics Industry Volume Share (%), by Country 2024 & 2032
- Figure 7: Europe Bladder Cancer Therapeutics and Diagnostics Industry Revenue (Million), by Country 2024 & 2032
- Figure 8: Europe Bladder Cancer Therapeutics and Diagnostics Industry Volume (K Unit), by Country 2024 & 2032
- Figure 9: Europe Bladder Cancer Therapeutics and Diagnostics Industry Revenue Share (%), by Country 2024 & 2032
- Figure 10: Europe Bladder Cancer Therapeutics and Diagnostics Industry Volume Share (%), by Country 2024 & 2032
- Figure 11: Asia Pacific Bladder Cancer Therapeutics and Diagnostics Industry Revenue (Million), by Country 2024 & 2032
- Figure 12: Asia Pacific Bladder Cancer Therapeutics and Diagnostics Industry Volume (K Unit), by Country 2024 & 2032
- Figure 13: Asia Pacific Bladder Cancer Therapeutics and Diagnostics Industry Revenue Share (%), by Country 2024 & 2032
- Figure 14: Asia Pacific Bladder Cancer Therapeutics and Diagnostics Industry Volume Share (%), by Country 2024 & 2032
- Figure 15: Middle East and Africa Bladder Cancer Therapeutics and Diagnostics Industry Revenue (Million), by Country 2024 & 2032
- Figure 16: Middle East and Africa Bladder Cancer Therapeutics and Diagnostics Industry Volume (K Unit), by Country 2024 & 2032
- Figure 17: Middle East and Africa Bladder Cancer Therapeutics and Diagnostics Industry Revenue Share (%), by Country 2024 & 2032
- Figure 18: Middle East and Africa Bladder Cancer Therapeutics and Diagnostics Industry Volume Share (%), by Country 2024 & 2032
- Figure 19: South America Bladder Cancer Therapeutics and Diagnostics Industry Revenue (Million), by Country 2024 & 2032
- Figure 20: South America Bladder Cancer Therapeutics and Diagnostics Industry Volume (K Unit), by Country 2024 & 2032
- Figure 21: South America Bladder Cancer Therapeutics and Diagnostics Industry Revenue Share (%), by Country 2024 & 2032
- Figure 22: South America Bladder Cancer Therapeutics and Diagnostics Industry Volume Share (%), by Country 2024 & 2032
- Figure 23: North America Bladder Cancer Therapeutics and Diagnostics Industry Revenue (Million), by Product 2024 & 2032
- Figure 24: North America Bladder Cancer Therapeutics and Diagnostics Industry Volume (K Unit), by Product 2024 & 2032
- Figure 25: North America Bladder Cancer Therapeutics and Diagnostics Industry Revenue Share (%), by Product 2024 & 2032
- Figure 26: North America Bladder Cancer Therapeutics and Diagnostics Industry Volume Share (%), by Product 2024 & 2032
- Figure 27: North America Bladder Cancer Therapeutics and Diagnostics Industry Revenue (Million), by Cancer Type 2024 & 2032
- Figure 28: North America Bladder Cancer Therapeutics and Diagnostics Industry Volume (K Unit), by Cancer Type 2024 & 2032
- Figure 29: North America Bladder Cancer Therapeutics and Diagnostics Industry Revenue Share (%), by Cancer Type 2024 & 2032
- Figure 30: North America Bladder Cancer Therapeutics and Diagnostics Industry Volume Share (%), by Cancer Type 2024 & 2032
- Figure 31: North America Bladder Cancer Therapeutics and Diagnostics Industry Revenue (Million), by Country 2024 & 2032
- Figure 32: North America Bladder Cancer Therapeutics and Diagnostics Industry Volume (K Unit), by Country 2024 & 2032
- Figure 33: North America Bladder Cancer Therapeutics and Diagnostics Industry Revenue Share (%), by Country 2024 & 2032
- Figure 34: North America Bladder Cancer Therapeutics and Diagnostics Industry Volume Share (%), by Country 2024 & 2032
- Figure 35: Europe Bladder Cancer Therapeutics and Diagnostics Industry Revenue (Million), by Product 2024 & 2032
- Figure 36: Europe Bladder Cancer Therapeutics and Diagnostics Industry Volume (K Unit), by Product 2024 & 2032
- Figure 37: Europe Bladder Cancer Therapeutics and Diagnostics Industry Revenue Share (%), by Product 2024 & 2032
- Figure 38: Europe Bladder Cancer Therapeutics and Diagnostics Industry Volume Share (%), by Product 2024 & 2032
- Figure 39: Europe Bladder Cancer Therapeutics and Diagnostics Industry Revenue (Million), by Cancer Type 2024 & 2032
- Figure 40: Europe Bladder Cancer Therapeutics and Diagnostics Industry Volume (K Unit), by Cancer Type 2024 & 2032
- Figure 41: Europe Bladder Cancer Therapeutics and Diagnostics Industry Revenue Share (%), by Cancer Type 2024 & 2032
- Figure 42: Europe Bladder Cancer Therapeutics and Diagnostics Industry Volume Share (%), by Cancer Type 2024 & 2032
- Figure 43: Europe Bladder Cancer Therapeutics and Diagnostics Industry Revenue (Million), by Country 2024 & 2032
- Figure 44: Europe Bladder Cancer Therapeutics and Diagnostics Industry Volume (K Unit), by Country 2024 & 2032
- Figure 45: Europe Bladder Cancer Therapeutics and Diagnostics Industry Revenue Share (%), by Country 2024 & 2032
- Figure 46: Europe Bladder Cancer Therapeutics and Diagnostics Industry Volume Share (%), by Country 2024 & 2032
- Figure 47: Asia Pacific Bladder Cancer Therapeutics and Diagnostics Industry Revenue (Million), by Product 2024 & 2032
- Figure 48: Asia Pacific Bladder Cancer Therapeutics and Diagnostics Industry Volume (K Unit), by Product 2024 & 2032
- Figure 49: Asia Pacific Bladder Cancer Therapeutics and Diagnostics Industry Revenue Share (%), by Product 2024 & 2032
- Figure 50: Asia Pacific Bladder Cancer Therapeutics and Diagnostics Industry Volume Share (%), by Product 2024 & 2032
- Figure 51: Asia Pacific Bladder Cancer Therapeutics and Diagnostics Industry Revenue (Million), by Cancer Type 2024 & 2032
- Figure 52: Asia Pacific Bladder Cancer Therapeutics and Diagnostics Industry Volume (K Unit), by Cancer Type 2024 & 2032
- Figure 53: Asia Pacific Bladder Cancer Therapeutics and Diagnostics Industry Revenue Share (%), by Cancer Type 2024 & 2032
- Figure 54: Asia Pacific Bladder Cancer Therapeutics and Diagnostics Industry Volume Share (%), by Cancer Type 2024 & 2032
- Figure 55: Asia Pacific Bladder Cancer Therapeutics and Diagnostics Industry Revenue (Million), by Country 2024 & 2032
- Figure 56: Asia Pacific Bladder Cancer Therapeutics and Diagnostics Industry Volume (K Unit), by Country 2024 & 2032
- Figure 57: Asia Pacific Bladder Cancer Therapeutics and Diagnostics Industry Revenue Share (%), by Country 2024 & 2032
- Figure 58: Asia Pacific Bladder Cancer Therapeutics and Diagnostics Industry Volume Share (%), by Country 2024 & 2032
- Figure 59: Middle East and Africa Bladder Cancer Therapeutics and Diagnostics Industry Revenue (Million), by Product 2024 & 2032
- Figure 60: Middle East and Africa Bladder Cancer Therapeutics and Diagnostics Industry Volume (K Unit), by Product 2024 & 2032
- Figure 61: Middle East and Africa Bladder Cancer Therapeutics and Diagnostics Industry Revenue Share (%), by Product 2024 & 2032
- Figure 62: Middle East and Africa Bladder Cancer Therapeutics and Diagnostics Industry Volume Share (%), by Product 2024 & 2032
- Figure 63: Middle East and Africa Bladder Cancer Therapeutics and Diagnostics Industry Revenue (Million), by Cancer Type 2024 & 2032
- Figure 64: Middle East and Africa Bladder Cancer Therapeutics and Diagnostics Industry Volume (K Unit), by Cancer Type 2024 & 2032
- Figure 65: Middle East and Africa Bladder Cancer Therapeutics and Diagnostics Industry Revenue Share (%), by Cancer Type 2024 & 2032
- Figure 66: Middle East and Africa Bladder Cancer Therapeutics and Diagnostics Industry Volume Share (%), by Cancer Type 2024 & 2032
- Figure 67: Middle East and Africa Bladder Cancer Therapeutics and Diagnostics Industry Revenue (Million), by Country 2024 & 2032
- Figure 68: Middle East and Africa Bladder Cancer Therapeutics and Diagnostics Industry Volume (K Unit), by Country 2024 & 2032
- Figure 69: Middle East and Africa Bladder Cancer Therapeutics and Diagnostics Industry Revenue Share (%), by Country 2024 & 2032
- Figure 70: Middle East and Africa Bladder Cancer Therapeutics and Diagnostics Industry Volume Share (%), by Country 2024 & 2032
- Figure 71: South America Bladder Cancer Therapeutics and Diagnostics Industry Revenue (Million), by Product 2024 & 2032
- Figure 72: South America Bladder Cancer Therapeutics and Diagnostics Industry Volume (K Unit), by Product 2024 & 2032
- Figure 73: South America Bladder Cancer Therapeutics and Diagnostics Industry Revenue Share (%), by Product 2024 & 2032
- Figure 74: South America Bladder Cancer Therapeutics and Diagnostics Industry Volume Share (%), by Product 2024 & 2032
- Figure 75: South America Bladder Cancer Therapeutics and Diagnostics Industry Revenue (Million), by Cancer Type 2024 & 2032
- Figure 76: South America Bladder Cancer Therapeutics and Diagnostics Industry Volume (K Unit), by Cancer Type 2024 & 2032
- Figure 77: South America Bladder Cancer Therapeutics and Diagnostics Industry Revenue Share (%), by Cancer Type 2024 & 2032
- Figure 78: South America Bladder Cancer Therapeutics and Diagnostics Industry Volume Share (%), by Cancer Type 2024 & 2032
- Figure 79: South America Bladder Cancer Therapeutics and Diagnostics Industry Revenue (Million), by Country 2024 & 2032
- Figure 80: South America Bladder Cancer Therapeutics and Diagnostics Industry Volume (K Unit), by Country 2024 & 2032
- Figure 81: South America Bladder Cancer Therapeutics and Diagnostics Industry Revenue Share (%), by Country 2024 & 2032
- Figure 82: South America Bladder Cancer Therapeutics and Diagnostics Industry Volume Share (%), by Country 2024 & 2032
List of Tables
- Table 1: Global Bladder Cancer Therapeutics and Diagnostics Industry Revenue Million Forecast, by Region 2019 & 2032
- Table 2: Global Bladder Cancer Therapeutics and Diagnostics Industry Volume K Unit Forecast, by Region 2019 & 2032
- Table 3: Global Bladder Cancer Therapeutics and Diagnostics Industry Revenue Million Forecast, by Product 2019 & 2032
- Table 4: Global Bladder Cancer Therapeutics and Diagnostics Industry Volume K Unit Forecast, by Product 2019 & 2032
- Table 5: Global Bladder Cancer Therapeutics and Diagnostics Industry Revenue Million Forecast, by Cancer Type 2019 & 2032
- Table 6: Global Bladder Cancer Therapeutics and Diagnostics Industry Volume K Unit Forecast, by Cancer Type 2019 & 2032
- Table 7: Global Bladder Cancer Therapeutics and Diagnostics Industry Revenue Million Forecast, by Region 2019 & 2032
- Table 8: Global Bladder Cancer Therapeutics and Diagnostics Industry Volume K Unit Forecast, by Region 2019 & 2032
- Table 9: Global Bladder Cancer Therapeutics and Diagnostics Industry Revenue Million Forecast, by Country 2019 & 2032
- Table 10: Global Bladder Cancer Therapeutics and Diagnostics Industry Volume K Unit Forecast, by Country 2019 & 2032
- Table 11: United States Bladder Cancer Therapeutics and Diagnostics Industry Revenue (Million) Forecast, by Application 2019 & 2032
- Table 12: United States Bladder Cancer Therapeutics and Diagnostics Industry Volume (K Unit) Forecast, by Application 2019 & 2032
- Table 13: Canada Bladder Cancer Therapeutics and Diagnostics Industry Revenue (Million) Forecast, by Application 2019 & 2032
- Table 14: Canada Bladder Cancer Therapeutics and Diagnostics Industry Volume (K Unit) Forecast, by Application 2019 & 2032
- Table 15: Mexico Bladder Cancer Therapeutics and Diagnostics Industry Revenue (Million) Forecast, by Application 2019 & 2032
- Table 16: Mexico Bladder Cancer Therapeutics and Diagnostics Industry Volume (K Unit) Forecast, by Application 2019 & 2032
- Table 17: Global Bladder Cancer Therapeutics and Diagnostics Industry Revenue Million Forecast, by Country 2019 & 2032
- Table 18: Global Bladder Cancer Therapeutics and Diagnostics Industry Volume K Unit Forecast, by Country 2019 & 2032
- Table 19: Germany Bladder Cancer Therapeutics and Diagnostics Industry Revenue (Million) Forecast, by Application 2019 & 2032
- Table 20: Germany Bladder Cancer Therapeutics and Diagnostics Industry Volume (K Unit) Forecast, by Application 2019 & 2032
- Table 21: United Kingdom Bladder Cancer Therapeutics and Diagnostics Industry Revenue (Million) Forecast, by Application 2019 & 2032
- Table 22: United Kingdom Bladder Cancer Therapeutics and Diagnostics Industry Volume (K Unit) Forecast, by Application 2019 & 2032
- Table 23: France Bladder Cancer Therapeutics and Diagnostics Industry Revenue (Million) Forecast, by Application 2019 & 2032
- Table 24: France Bladder Cancer Therapeutics and Diagnostics Industry Volume (K Unit) Forecast, by Application 2019 & 2032
- Table 25: Italy Bladder Cancer Therapeutics and Diagnostics Industry Revenue (Million) Forecast, by Application 2019 & 2032
- Table 26: Italy Bladder Cancer Therapeutics and Diagnostics Industry Volume (K Unit) Forecast, by Application 2019 & 2032
- Table 27: Spain Bladder Cancer Therapeutics and Diagnostics Industry Revenue (Million) Forecast, by Application 2019 & 2032
- Table 28: Spain Bladder Cancer Therapeutics and Diagnostics Industry Volume (K Unit) Forecast, by Application 2019 & 2032
- Table 29: Rest of Europe Bladder Cancer Therapeutics and Diagnostics Industry Revenue (Million) Forecast, by Application 2019 & 2032
- Table 30: Rest of Europe Bladder Cancer Therapeutics and Diagnostics Industry Volume (K Unit) Forecast, by Application 2019 & 2032
- Table 31: Global Bladder Cancer Therapeutics and Diagnostics Industry Revenue Million Forecast, by Country 2019 & 2032
- Table 32: Global Bladder Cancer Therapeutics and Diagnostics Industry Volume K Unit Forecast, by Country 2019 & 2032
- Table 33: China Bladder Cancer Therapeutics and Diagnostics Industry Revenue (Million) Forecast, by Application 2019 & 2032
- Table 34: China Bladder Cancer Therapeutics and Diagnostics Industry Volume (K Unit) Forecast, by Application 2019 & 2032
- Table 35: Japan Bladder Cancer Therapeutics and Diagnostics Industry Revenue (Million) Forecast, by Application 2019 & 2032
- Table 36: Japan Bladder Cancer Therapeutics and Diagnostics Industry Volume (K Unit) Forecast, by Application 2019 & 2032
- Table 37: India Bladder Cancer Therapeutics and Diagnostics Industry Revenue (Million) Forecast, by Application 2019 & 2032
- Table 38: India Bladder Cancer Therapeutics and Diagnostics Industry Volume (K Unit) Forecast, by Application 2019 & 2032
- Table 39: Australia Bladder Cancer Therapeutics and Diagnostics Industry Revenue (Million) Forecast, by Application 2019 & 2032
- Table 40: Australia Bladder Cancer Therapeutics and Diagnostics Industry Volume (K Unit) Forecast, by Application 2019 & 2032
- Table 41: South Korea Bladder Cancer Therapeutics and Diagnostics Industry Revenue (Million) Forecast, by Application 2019 & 2032
- Table 42: South Korea Bladder Cancer Therapeutics and Diagnostics Industry Volume (K Unit) Forecast, by Application 2019 & 2032
- Table 43: Rest of Asia Pacific Bladder Cancer Therapeutics and Diagnostics Industry Revenue (Million) Forecast, by Application 2019 & 2032
- Table 44: Rest of Asia Pacific Bladder Cancer Therapeutics and Diagnostics Industry Volume (K Unit) Forecast, by Application 2019 & 2032
- Table 45: Global Bladder Cancer Therapeutics and Diagnostics Industry Revenue Million Forecast, by Country 2019 & 2032
- Table 46: Global Bladder Cancer Therapeutics and Diagnostics Industry Volume K Unit Forecast, by Country 2019 & 2032
- Table 47: GCC Bladder Cancer Therapeutics and Diagnostics Industry Revenue (Million) Forecast, by Application 2019 & 2032
- Table 48: GCC Bladder Cancer Therapeutics and Diagnostics Industry Volume (K Unit) Forecast, by Application 2019 & 2032
- Table 49: South Africa Bladder Cancer Therapeutics and Diagnostics Industry Revenue (Million) Forecast, by Application 2019 & 2032
- Table 50: South Africa Bladder Cancer Therapeutics and Diagnostics Industry Volume (K Unit) Forecast, by Application 2019 & 2032
- Table 51: Rest of Middle East and Africa Bladder Cancer Therapeutics and Diagnostics Industry Revenue (Million) Forecast, by Application 2019 & 2032
- Table 52: Rest of Middle East and Africa Bladder Cancer Therapeutics and Diagnostics Industry Volume (K Unit) Forecast, by Application 2019 & 2032
- Table 53: Global Bladder Cancer Therapeutics and Diagnostics Industry Revenue Million Forecast, by Country 2019 & 2032
- Table 54: Global Bladder Cancer Therapeutics and Diagnostics Industry Volume K Unit Forecast, by Country 2019 & 2032
- Table 55: Brazil Bladder Cancer Therapeutics and Diagnostics Industry Revenue (Million) Forecast, by Application 2019 & 2032
- Table 56: Brazil Bladder Cancer Therapeutics and Diagnostics Industry Volume (K Unit) Forecast, by Application 2019 & 2032
- Table 57: Argentina Bladder Cancer Therapeutics and Diagnostics Industry Revenue (Million) Forecast, by Application 2019 & 2032
- Table 58: Argentina Bladder Cancer Therapeutics and Diagnostics Industry Volume (K Unit) Forecast, by Application 2019 & 2032
- Table 59: Rest of South America Bladder Cancer Therapeutics and Diagnostics Industry Revenue (Million) Forecast, by Application 2019 & 2032
- Table 60: Rest of South America Bladder Cancer Therapeutics and Diagnostics Industry Volume (K Unit) Forecast, by Application 2019 & 2032
- Table 61: Global Bladder Cancer Therapeutics and Diagnostics Industry Revenue Million Forecast, by Product 2019 & 2032
- Table 62: Global Bladder Cancer Therapeutics and Diagnostics Industry Volume K Unit Forecast, by Product 2019 & 2032
- Table 63: Global Bladder Cancer Therapeutics and Diagnostics Industry Revenue Million Forecast, by Cancer Type 2019 & 2032
- Table 64: Global Bladder Cancer Therapeutics and Diagnostics Industry Volume K Unit Forecast, by Cancer Type 2019 & 2032
- Table 65: Global Bladder Cancer Therapeutics and Diagnostics Industry Revenue Million Forecast, by Country 2019 & 2032
- Table 66: Global Bladder Cancer Therapeutics and Diagnostics Industry Volume K Unit Forecast, by Country 2019 & 2032
- Table 67: United States Bladder Cancer Therapeutics and Diagnostics Industry Revenue (Million) Forecast, by Application 2019 & 2032
- Table 68: United States Bladder Cancer Therapeutics and Diagnostics Industry Volume (K Unit) Forecast, by Application 2019 & 2032
- Table 69: Canada Bladder Cancer Therapeutics and Diagnostics Industry Revenue (Million) Forecast, by Application 2019 & 2032
- Table 70: Canada Bladder Cancer Therapeutics and Diagnostics Industry Volume (K Unit) Forecast, by Application 2019 & 2032
- Table 71: Mexico Bladder Cancer Therapeutics and Diagnostics Industry Revenue (Million) Forecast, by Application 2019 & 2032
- Table 72: Mexico Bladder Cancer Therapeutics and Diagnostics Industry Volume (K Unit) Forecast, by Application 2019 & 2032
- Table 73: Global Bladder Cancer Therapeutics and Diagnostics Industry Revenue Million Forecast, by Product 2019 & 2032
- Table 74: Global Bladder Cancer Therapeutics and Diagnostics Industry Volume K Unit Forecast, by Product 2019 & 2032
- Table 75: Global Bladder Cancer Therapeutics and Diagnostics Industry Revenue Million Forecast, by Cancer Type 2019 & 2032
- Table 76: Global Bladder Cancer Therapeutics and Diagnostics Industry Volume K Unit Forecast, by Cancer Type 2019 & 2032
- Table 77: Global Bladder Cancer Therapeutics and Diagnostics Industry Revenue Million Forecast, by Country 2019 & 2032
- Table 78: Global Bladder Cancer Therapeutics and Diagnostics Industry Volume K Unit Forecast, by Country 2019 & 2032
- Table 79: Germany Bladder Cancer Therapeutics and Diagnostics Industry Revenue (Million) Forecast, by Application 2019 & 2032
- Table 80: Germany Bladder Cancer Therapeutics and Diagnostics Industry Volume (K Unit) Forecast, by Application 2019 & 2032
- Table 81: United Kingdom Bladder Cancer Therapeutics and Diagnostics Industry Revenue (Million) Forecast, by Application 2019 & 2032
- Table 82: United Kingdom Bladder Cancer Therapeutics and Diagnostics Industry Volume (K Unit) Forecast, by Application 2019 & 2032
- Table 83: France Bladder Cancer Therapeutics and Diagnostics Industry Revenue (Million) Forecast, by Application 2019 & 2032
- Table 84: France Bladder Cancer Therapeutics and Diagnostics Industry Volume (K Unit) Forecast, by Application 2019 & 2032
- Table 85: Italy Bladder Cancer Therapeutics and Diagnostics Industry Revenue (Million) Forecast, by Application 2019 & 2032
- Table 86: Italy Bladder Cancer Therapeutics and Diagnostics Industry Volume (K Unit) Forecast, by Application 2019 & 2032
- Table 87: Spain Bladder Cancer Therapeutics and Diagnostics Industry Revenue (Million) Forecast, by Application 2019 & 2032
- Table 88: Spain Bladder Cancer Therapeutics and Diagnostics Industry Volume (K Unit) Forecast, by Application 2019 & 2032
- Table 89: Rest of Europe Bladder Cancer Therapeutics and Diagnostics Industry Revenue (Million) Forecast, by Application 2019 & 2032
- Table 90: Rest of Europe Bladder Cancer Therapeutics and Diagnostics Industry Volume (K Unit) Forecast, by Application 2019 & 2032
- Table 91: Global Bladder Cancer Therapeutics and Diagnostics Industry Revenue Million Forecast, by Product 2019 & 2032
- Table 92: Global Bladder Cancer Therapeutics and Diagnostics Industry Volume K Unit Forecast, by Product 2019 & 2032
- Table 93: Global Bladder Cancer Therapeutics and Diagnostics Industry Revenue Million Forecast, by Cancer Type 2019 & 2032
- Table 94: Global Bladder Cancer Therapeutics and Diagnostics Industry Volume K Unit Forecast, by Cancer Type 2019 & 2032
- Table 95: Global Bladder Cancer Therapeutics and Diagnostics Industry Revenue Million Forecast, by Country 2019 & 2032
- Table 96: Global Bladder Cancer Therapeutics and Diagnostics Industry Volume K Unit Forecast, by Country 2019 & 2032
- Table 97: China Bladder Cancer Therapeutics and Diagnostics Industry Revenue (Million) Forecast, by Application 2019 & 2032
- Table 98: China Bladder Cancer Therapeutics and Diagnostics Industry Volume (K Unit) Forecast, by Application 2019 & 2032
- Table 99: Japan Bladder Cancer Therapeutics and Diagnostics Industry Revenue (Million) Forecast, by Application 2019 & 2032
- Table 100: Japan Bladder Cancer Therapeutics and Diagnostics Industry Volume (K Unit) Forecast, by Application 2019 & 2032
- Table 101: India Bladder Cancer Therapeutics and Diagnostics Industry Revenue (Million) Forecast, by Application 2019 & 2032
- Table 102: India Bladder Cancer Therapeutics and Diagnostics Industry Volume (K Unit) Forecast, by Application 2019 & 2032
- Table 103: Australia Bladder Cancer Therapeutics and Diagnostics Industry Revenue (Million) Forecast, by Application 2019 & 2032
- Table 104: Australia Bladder Cancer Therapeutics and Diagnostics Industry Volume (K Unit) Forecast, by Application 2019 & 2032
- Table 105: South Korea Bladder Cancer Therapeutics and Diagnostics Industry Revenue (Million) Forecast, by Application 2019 & 2032
- Table 106: South Korea Bladder Cancer Therapeutics and Diagnostics Industry Volume (K Unit) Forecast, by Application 2019 & 2032
- Table 107: Rest of Asia Pacific Bladder Cancer Therapeutics and Diagnostics Industry Revenue (Million) Forecast, by Application 2019 & 2032
- Table 108: Rest of Asia Pacific Bladder Cancer Therapeutics and Diagnostics Industry Volume (K Unit) Forecast, by Application 2019 & 2032
- Table 109: Global Bladder Cancer Therapeutics and Diagnostics Industry Revenue Million Forecast, by Product 2019 & 2032
- Table 110: Global Bladder Cancer Therapeutics and Diagnostics Industry Volume K Unit Forecast, by Product 2019 & 2032
- Table 111: Global Bladder Cancer Therapeutics and Diagnostics Industry Revenue Million Forecast, by Cancer Type 2019 & 2032
- Table 112: Global Bladder Cancer Therapeutics and Diagnostics Industry Volume K Unit Forecast, by Cancer Type 2019 & 2032
- Table 113: Global Bladder Cancer Therapeutics and Diagnostics Industry Revenue Million Forecast, by Country 2019 & 2032
- Table 114: Global Bladder Cancer Therapeutics and Diagnostics Industry Volume K Unit Forecast, by Country 2019 & 2032
- Table 115: GCC Bladder Cancer Therapeutics and Diagnostics Industry Revenue (Million) Forecast, by Application 2019 & 2032
- Table 116: GCC Bladder Cancer Therapeutics and Diagnostics Industry Volume (K Unit) Forecast, by Application 2019 & 2032
- Table 117: South Africa Bladder Cancer Therapeutics and Diagnostics Industry Revenue (Million) Forecast, by Application 2019 & 2032
- Table 118: South Africa Bladder Cancer Therapeutics and Diagnostics Industry Volume (K Unit) Forecast, by Application 2019 & 2032
- Table 119: Rest of Middle East and Africa Bladder Cancer Therapeutics and Diagnostics Industry Revenue (Million) Forecast, by Application 2019 & 2032
- Table 120: Rest of Middle East and Africa Bladder Cancer Therapeutics and Diagnostics Industry Volume (K Unit) Forecast, by Application 2019 & 2032
- Table 121: Global Bladder Cancer Therapeutics and Diagnostics Industry Revenue Million Forecast, by Product 2019 & 2032
- Table 122: Global Bladder Cancer Therapeutics and Diagnostics Industry Volume K Unit Forecast, by Product 2019 & 2032
- Table 123: Global Bladder Cancer Therapeutics and Diagnostics Industry Revenue Million Forecast, by Cancer Type 2019 & 2032
- Table 124: Global Bladder Cancer Therapeutics and Diagnostics Industry Volume K Unit Forecast, by Cancer Type 2019 & 2032
- Table 125: Global Bladder Cancer Therapeutics and Diagnostics Industry Revenue Million Forecast, by Country 2019 & 2032
- Table 126: Global Bladder Cancer Therapeutics and Diagnostics Industry Volume K Unit Forecast, by Country 2019 & 2032
- Table 127: Brazil Bladder Cancer Therapeutics and Diagnostics Industry Revenue (Million) Forecast, by Application 2019 & 2032
- Table 128: Brazil Bladder Cancer Therapeutics and Diagnostics Industry Volume (K Unit) Forecast, by Application 2019 & 2032
- Table 129: Argentina Bladder Cancer Therapeutics and Diagnostics Industry Revenue (Million) Forecast, by Application 2019 & 2032
- Table 130: Argentina Bladder Cancer Therapeutics and Diagnostics Industry Volume (K Unit) Forecast, by Application 2019 & 2032
- Table 131: Rest of South America Bladder Cancer Therapeutics and Diagnostics Industry Revenue (Million) Forecast, by Application 2019 & 2032
- Table 132: Rest of South America Bladder Cancer Therapeutics and Diagnostics Industry Volume (K Unit) Forecast, by Application 2019 & 2032
Frequently Asked Questions
1. What is the projected Compound Annual Growth Rate (CAGR) of the Bladder Cancer Therapeutics and Diagnostics Industry?
The projected CAGR is approximately 4.00%.
2. Which companies are prominent players in the Bladder Cancer Therapeutics and Diagnostics Industry?
Key companies in the market include Novartis International AG, Merck & Co Inc, F Hoffmann-La Roche Ltd, Eli Lilly and Company, Johnson & Johnson (Janssen Pharmaceutical), Ameritech Diagnostic Reagent(Jiaxing)Co Ltd, Endo Pharmaceuticals Inc, Astellas Pharma Inc , Abbott Inc, Bristol-Myers Squibb Company, GlaxoSmithKline PLC, Pfizer Inc.
3. What are the main segments of the Bladder Cancer Therapeutics and Diagnostics Industry?
The market segments include Product, Cancer Type.
4. Can you provide details about the market size?
The market size is estimated to be USD XX Million as of 2022.
5. What are some drivers contributing to market growth?
Increasing Awareness on Bladder Diseases and Available Therapies; Increasing Healthcare Expenditure; Increasing Burden of Bladder Cancer.
6. What are the notable trends driving market growth?
Cystoscopy is Anticipated to be the Dominant Segment in Studied Market Over the Forecast Period.
7. Are there any restraints impacting market growth?
Rise in the Number of Patent Expiration and Increased Use of Generic Drugs; Asymptomatic Nature of the Disease.
8. Can you provide examples of recent developments in the market?
In July 2022, The United States Food and Drug Administration (FDA) agreed to review ImmunityBio's Biologics License Application (BLA) for N-803 in patients with or without Ta or T1 illness who have non-muscle-invasive bladder cancer (NMIBC) carcinoma in situ (CIS).
9. What pricing options are available for accessing the report?
Pricing options include single-user, multi-user, and enterprise licenses priced at USD 4750, USD 5250, and USD 8750 respectively.
10. Is the market size provided in terms of value or volume?
The market size is provided in terms of value, measured in Million and volume, measured in K Unit.
11. Are there any specific market keywords associated with the report?
Yes, the market keyword associated with the report is "Bladder Cancer Therapeutics and Diagnostics Industry," which aids in identifying and referencing the specific market segment covered.
12. How do I determine which pricing option suits my needs best?
The pricing options vary based on user requirements and access needs. Individual users may opt for single-user licenses, while businesses requiring broader access may choose multi-user or enterprise licenses for cost-effective access to the report.
13. Are there any additional resources or data provided in the Bladder Cancer Therapeutics and Diagnostics Industry report?
While the report offers comprehensive insights, it's advisable to review the specific contents or supplementary materials provided to ascertain if additional resources or data are available.
14. How can I stay updated on further developments or reports in the Bladder Cancer Therapeutics and Diagnostics Industry?
To stay informed about further developments, trends, and reports in the Bladder Cancer Therapeutics and Diagnostics Industry, consider subscribing to industry newsletters, following relevant companies and organizations, or regularly checking reputable industry news sources and publications.
Methodology
Step 1 - Identification of Relevant Samples Size from Population Database


Step 2 - Approaches for Defining Global Market Size (Value, Volume* & Price*)

Note*: In applicable scenarios
Step 3 - Data Sources
Primary Research
- Web Analytics
- Survey Reports
- Research Institute
- Latest Research Reports
- Opinion Leaders
Secondary Research
- Annual Reports
- White Paper
- Latest Press Release
- Industry Association
- Paid Database
- Investor Presentations

Step 4 - Data Triangulation
Involves using different sources of information in order to increase the validity of a study
These sources are likely to be stakeholders in a program - participants, other researchers, program staff, other community members, and so on.
Then we put all data in single framework & apply various statistical tools to find out the dynamic on the market.
During the analysis stage, feedback from the stakeholder groups would be compared to determine areas of agreement as well as areas of divergence


