
Key Insights
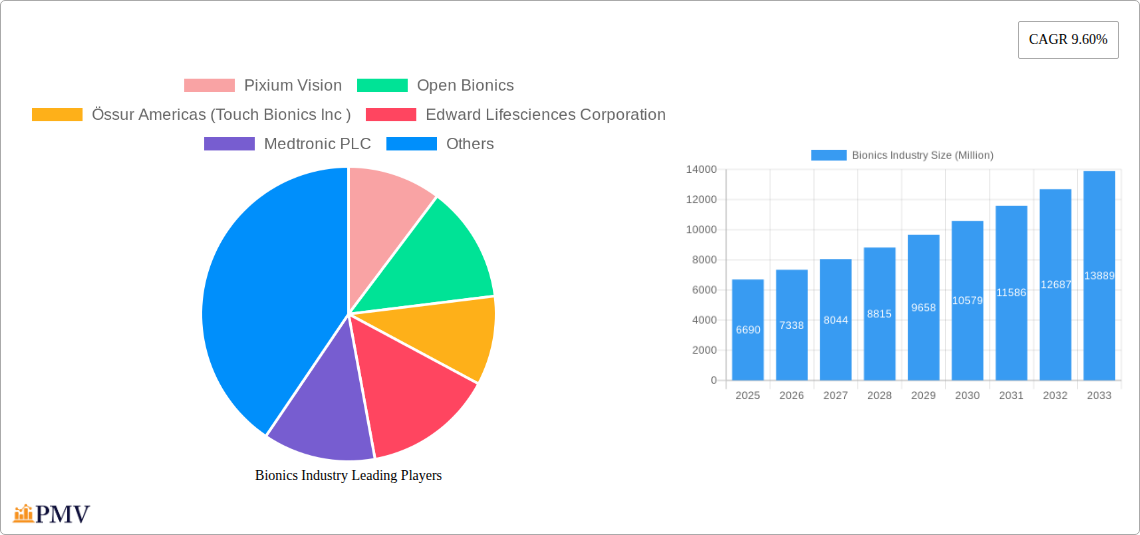
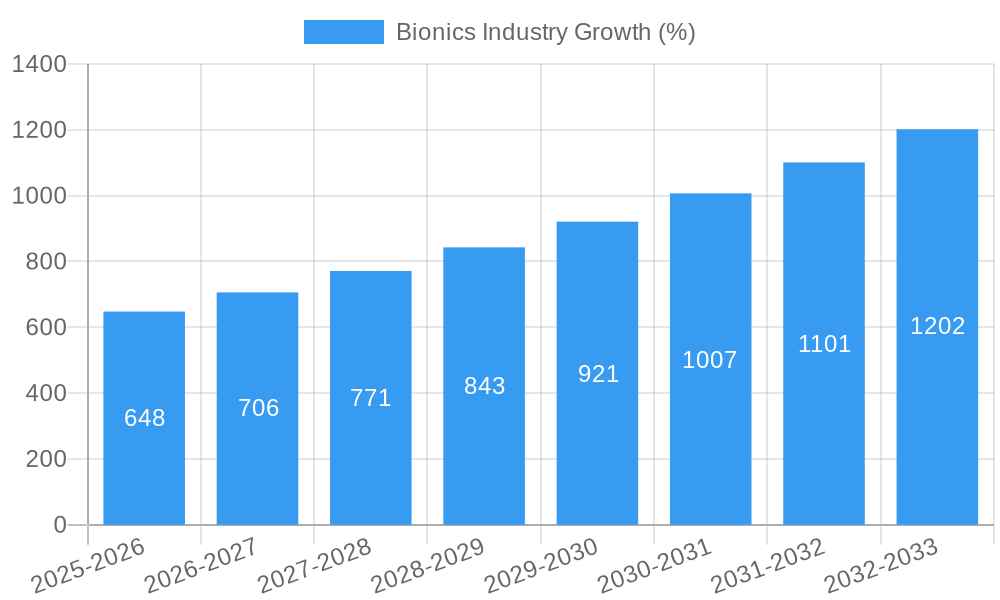
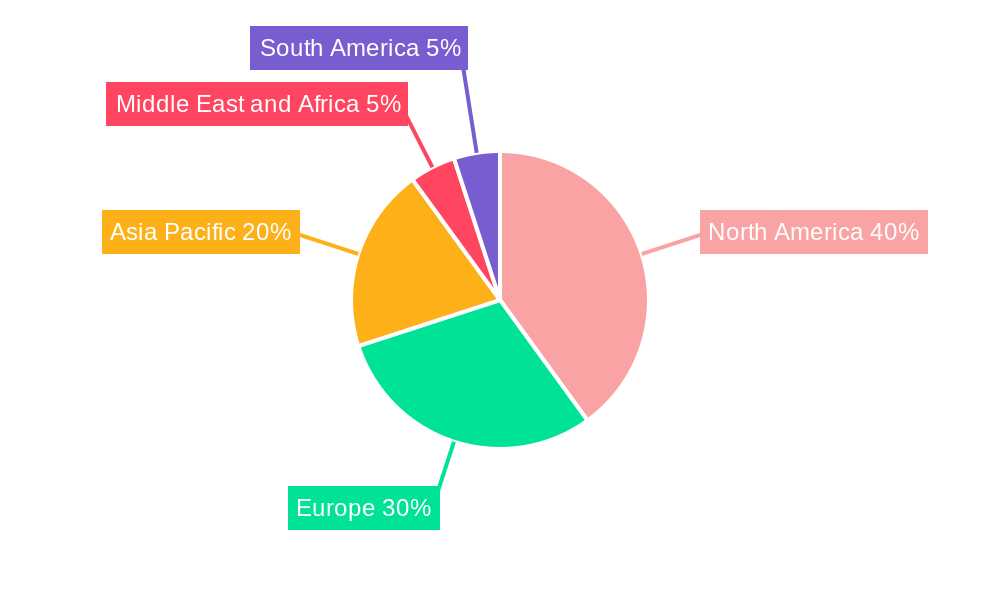
The global bionics market, valued at $6.69 billion in 2025, is projected to experience robust growth, driven by a 9.60% CAGR from 2025 to 2033. This expansion is fueled by several key factors. Technological advancements are leading to more sophisticated and effective bionic devices, improving the quality of life for individuals with disabilities. The aging global population, coupled with an increasing prevalence of chronic diseases requiring bionic interventions, significantly contributes to market growth. Furthermore, rising healthcare expenditure and increased government initiatives supporting assistive technologies are bolstering market adoption. The market is segmented by fixation type (implantable and external bionics) and bionic type (vision, ear, orthopedic, cardiac, etc.), with implantable bionics currently dominating due to their superior functionality and long-term benefits. Significant regional variations exist, with North America and Europe currently holding the largest market shares due to advanced healthcare infrastructure and higher adoption rates. However, the Asia-Pacific region is expected to witness the fastest growth in the coming years, driven by increasing awareness, rising disposable incomes, and expanding healthcare access.
Competitive pressures among established players like Medtronic, Cochlear, and Össur, as well as emerging companies developing innovative solutions, are further stimulating market innovation and driving down costs. Challenges remain, however, including high device costs, potential complications related to surgery and implantation, and regulatory hurdles for new technologies. Nevertheless, ongoing research and development efforts, particularly in areas like advanced materials, AI integration, and improved biocompatibility, are poised to overcome these obstacles and unlock substantial future growth within the bionics industry. The long-term outlook for the bionics market remains exceptionally positive, with continued expansion expected across all segments and geographies. Further market penetration hinges on addressing cost-effectiveness concerns, improving accessibility, and promoting public awareness of the life-changing benefits of bionic technology.
Bionics Industry Market Report: 2019-2033
This comprehensive report provides a detailed analysis of the global bionics industry, projecting a market value exceeding $xx Million by 2033. The study period covers 2019-2033, with 2025 as the base and estimated year. The report offers invaluable insights for investors, manufacturers, and stakeholders seeking to navigate this rapidly evolving sector. Expect in-depth analysis of market segmentation, competitive dynamics, technological advancements, and key growth drivers. Benefit from actionable intelligence and strategic recommendations to capitalize on the significant opportunities within the bionics market.
Bionics Industry Market Structure & Competitive Dynamics
The global bionics market is characterized by a moderately concentrated landscape with several major players and numerous smaller specialized firms. Market concentration is assessed through Herfindahl-Hirschman Index (HHI) analysis, revealing a value of xx, suggesting a moderately competitive market. Innovation ecosystems vary significantly across geographical regions, with established players often partnering with research institutions and startups to drive technological advancements. Regulatory frameworks, differing across countries, significantly impact product approvals and market access. Product substitutes, particularly in certain segments like orthopedic bionics, can pose a challenge. End-user trends, primarily driven by aging populations and rising healthcare expenditure, are propelling market growth. M&A activities have been significant, with deal values exceeding $xx Million in recent years. Key M&A activities included (specific examples and values will be detailed in the full report).
- Market Share: Medtronic PLC and Össur Americas (Touch Bionics Inc) currently hold significant market shares, estimated at xx% and xx% respectively in 2025.
- M&A Activity: The past five years have witnessed significant consolidation, with several large acquisitions reshaping the competitive landscape. Examples include [Specific M&A examples and deal values will be detailed in the full report].
Bionics Industry Trends & Insights
The bionics industry is experiencing robust growth, driven by several factors. Technological advancements, including advancements in materials science, miniaturization, and AI, are leading to more sophisticated and functional bionic devices. The increasing prevalence of chronic diseases, particularly among aging populations, is creating a substantial demand for bionic solutions. Consumer preferences are shifting towards more aesthetically pleasing, user-friendly, and intuitive devices. The competitive landscape is dynamic, with ongoing innovation and strategic partnerships shaping market dynamics. The global market is projected to exhibit a CAGR of xx% during the forecast period (2025-2033), with a market penetration rate of xx% by 2033. [Detailed market size projections for different segments will be provided in the full report.]
Dominant Markets & Segments in Bionics Industry
The North American market currently dominates the global bionics industry, driven by robust healthcare infrastructure, high per capita income, and favorable regulatory policies. However, Asia-Pacific is expected to show significant growth in the coming years.
- Fixation: Implantable bionics are projected to hold a larger market share than external bionics due to their superior functionalities, but external bionics are expected to witness faster growth due to advancements making them lighter, more user-friendly, and accessible.
- Type of Bionics: Orthopedic bionics (particularly bionic legs) currently constitutes the largest segment, followed by ear bionics and vision bionics. Bone-anchored hearing aids (BAHAs) are experiencing rapid growth due to improved technology. Cardiac bionics represent a niche but rapidly expanding sector.
- Key Drivers:
- High prevalence of chronic diseases: The aging global population fuels demand for bionic solutions.
- Technological advancements: Miniaturization, improved materials, and AI integration are driving better functionalities and improved user experience.
- Favorable regulatory environments: In some regions, supportive regulatory frameworks facilitate faster adoption.
Bionics Industry Product Innovations
Recent years have witnessed a surge in innovative bionic devices. The launch of TrueLimb by Unlimited Tomorrow in 2022 signifies a major leap in prosthetic technology, offering improved dexterity and functionality. The Cysoni device by Ceryx Medical introduces innovative solutions for cardiac rhythm management. These innovations highlight the ongoing trend toward more advanced, user-friendly, and personalized bionic devices. The market is increasingly focused on improving integration with the nervous system, reducing the size and weight of devices, and enhancing aesthetic appeal.
Report Segmentation & Scope
The report provides a detailed segmentation of the bionics market across various parameters:
- Fixation: Implantable Bionics (market size $xx Million in 2025, growing at xx% CAGR), External Bionics ($xx Million in 2025, growing at xx% CAGR).
- Type of Bionics: Vision Bionics ($xx Million in 2025, xx% CAGR), Ear Bionics ($xx Million in 2025, xx% CAGR), Bone-anchored Hearing Aid (BAHA) ($xx Million in 2025, xx% CAGR), Orthopedic Bionic ($xx Million in 2025, xx% CAGR), Bionic Leg ($xx Million in 2025, xx% CAGR), Cardiac Bionics ($xx Million in 2025, xx% CAGR). Each segment's competitive landscape and growth trajectory are analyzed.
Key Drivers of Bionics Industry Growth
Several factors contribute to the rapid growth of the bionics industry. Technological advancements leading to more sophisticated and effective devices are key. Rising healthcare expenditure and a growing aging population create significant demand. Furthermore, supportive government initiatives and regulatory frameworks in some regions accelerate market penetration. Specific examples include increased funding for biomedical research and the approval of innovative bionic devices.
Challenges in the Bionics Industry Sector
Despite strong growth, the bionics industry faces several challenges. High costs associated with research, development, and manufacturing restrict market accessibility. Strict regulatory hurdles, varying by region, slow down product launches and market entry. Competition from established players and emerging startups creates intense pressure on margins. The global supply chain disruptions and raw material price fluctuations also impact profitability. These factors have cumulatively resulted in a xx% reduction in estimated profit margins for the industry in 2024 compared to 2019.
Leading Players in the Bionics Industry Market
- Pixium Vision
- Open Bionics
- Össur Americas (Touch Bionics Inc)
- Edward Lifesciences Corporation
- Medtronic PLC
- Ekso Bionics
- Ottobock
- Bionics Scientific Technologies (P) Ltd
- Bionic Prosthetics and Orthotics
- Mobius Bionics
- Cochlear Limited
- Advanced Bionics AG
Key Developments in Bionics Industry Sector
- July 2022: Unlimited Tomorrow launched TrueLimb, a next-generation bionic arm with advanced grip capabilities. This launch significantly enhances the functionality and user experience of prosthetic limbs.
- February 2022: Ceryx Medical launched the Cysoni device, addressing respiratory sinus arrhythmia. This marks a significant advancement in cardiac rhythm management.
Strategic Bionics Industry Market Outlook
The future of the bionics industry appears bright, with continuous technological advancements driving innovation and improved functionalities. The increasing prevalence of chronic diseases and the aging population will fuel further demand. Strategic partnerships between manufacturers, research institutions, and healthcare providers are expected to accelerate market growth. Focus on personalized medicine and AI integration will shape the next generation of bionic devices. The market is poised for substantial expansion, offering significant opportunities for investors and stakeholders.
Bionics Industry Segmentation
-
1. Type of Bionics
- 1.1. Vision Bionics
- 1.2. Ear Bionics
- 1.3. Orthopedic Bionic
- 1.4. Cardiac Bionics
Bionics Industry Segmentation By Geography
-
1. North America
- 1.1. United States
- 1.2. Canada
- 1.3. Mexico
-
2. Europe
- 2.1. Germany
- 2.2. United Kingdom
- 2.3. France
- 2.4. Italy
- 2.5. Spain
- 2.6. Rest of Europe
-
3. Asia Pacific
- 3.1. China
- 3.2. Japan
- 3.3. India
- 3.4. Australia
- 3.5. South Korea
- 3.6. Rest of Asia Pacific
-
4. Middle East and Africa
- 4.1. GCC
- 4.2. South Africa
- 4.3. Rest of Middle East and Africa
-
5. South America
- 5.1. Brazil
- 5.2. Argentina
- 5.3. Rest of South America
Bionics Industry REPORT HIGHLIGHTS
| Aspects | Details |
|---|---|
| Study Period | 2019-2033 |
| Base Year | 2024 |
| Estimated Year | 2025 |
| Forecast Period | 2025-2033 |
| Historical Period | 2019-2024 |
| Growth Rate | CAGR of 9.60% from 2019-2033 |
| Segmentation |
|
Table of Contents
- 1. Introduction
- 1.1. Research Scope
- 1.2. Market Segmentation
- 1.3. Research Methodology
- 1.4. Definitions and Assumptions
- 2. Executive Summary
- 2.1. Introduction
- 3. Market Dynamics
- 3.1. Introduction
- 3.2. Market Drivers
- 3.2.1. Increased Incidence of Disabilities and Organ Failures; Technological Advancements; High Incidence of Road Accidents Leading to Amputations
- 3.3. Market Restrains
- 3.3.1. High Cost of Devices and Uncertain Reimbursement Scenarios; Fear of Device Malfunction and Its Consequences
- 3.4. Market Trends
- 3.4.1. Cochlear implant are Estimated to Hold a Significant Share in the Fixation Type Segment of the Bionics Market
- 4. Market Factor Analysis
- 4.1. Porters Five Forces
- 4.2. Supply/Value Chain
- 4.3. PESTEL analysis
- 4.4. Market Entropy
- 4.5. Patent/Trademark Analysis
- 5. Global Bionics Industry Analysis, Insights and Forecast, 2019-2031
- 5.1. Market Analysis, Insights and Forecast - by Type of Bionics
- 5.1.1. Vision Bionics
- 5.1.2. Ear Bionics
- 5.1.3. Orthopedic Bionic
- 5.1.4. Cardiac Bionics
- 5.2. Market Analysis, Insights and Forecast - by Region
- 5.2.1. North America
- 5.2.2. Europe
- 5.2.3. Asia Pacific
- 5.2.4. Middle East and Africa
- 5.2.5. South America
- 5.1. Market Analysis, Insights and Forecast - by Type of Bionics
- 6. North America Bionics Industry Analysis, Insights and Forecast, 2019-2031
- 6.1. Market Analysis, Insights and Forecast - by Type of Bionics
- 6.1.1. Vision Bionics
- 6.1.2. Ear Bionics
- 6.1.3. Orthopedic Bionic
- 6.1.4. Cardiac Bionics
- 6.1. Market Analysis, Insights and Forecast - by Type of Bionics
- 7. Europe Bionics Industry Analysis, Insights and Forecast, 2019-2031
- 7.1. Market Analysis, Insights and Forecast - by Type of Bionics
- 7.1.1. Vision Bionics
- 7.1.2. Ear Bionics
- 7.1.3. Orthopedic Bionic
- 7.1.4. Cardiac Bionics
- 7.1. Market Analysis, Insights and Forecast - by Type of Bionics
- 8. Asia Pacific Bionics Industry Analysis, Insights and Forecast, 2019-2031
- 8.1. Market Analysis, Insights and Forecast - by Type of Bionics
- 8.1.1. Vision Bionics
- 8.1.2. Ear Bionics
- 8.1.3. Orthopedic Bionic
- 8.1.4. Cardiac Bionics
- 8.1. Market Analysis, Insights and Forecast - by Type of Bionics
- 9. Middle East and Africa Bionics Industry Analysis, Insights and Forecast, 2019-2031
- 9.1. Market Analysis, Insights and Forecast - by Type of Bionics
- 9.1.1. Vision Bionics
- 9.1.2. Ear Bionics
- 9.1.3. Orthopedic Bionic
- 9.1.4. Cardiac Bionics
- 9.1. Market Analysis, Insights and Forecast - by Type of Bionics
- 10. South America Bionics Industry Analysis, Insights and Forecast, 2019-2031
- 10.1. Market Analysis, Insights and Forecast - by Type of Bionics
- 10.1.1. Vision Bionics
- 10.1.2. Ear Bionics
- 10.1.3. Orthopedic Bionic
- 10.1.4. Cardiac Bionics
- 10.1. Market Analysis, Insights and Forecast - by Type of Bionics
- 11. North America Bionics Industry Analysis, Insights and Forecast, 2019-2031
- 11.1. Market Analysis, Insights and Forecast - By Country/Sub-region
- 11.1.1 United States
- 11.1.2 Canada
- 11.1.3 Mexico
- 12. Europe Bionics Industry Analysis, Insights and Forecast, 2019-2031
- 12.1. Market Analysis, Insights and Forecast - By Country/Sub-region
- 12.1.1 Germany
- 12.1.2 United Kingdom
- 12.1.3 France
- 12.1.4 Italy
- 12.1.5 Spain
- 12.1.6 Rest of Europe
- 13. Asia Pacific Bionics Industry Analysis, Insights and Forecast, 2019-2031
- 13.1. Market Analysis, Insights and Forecast - By Country/Sub-region
- 13.1.1 China
- 13.1.2 Japan
- 13.1.3 India
- 13.1.4 Australia
- 13.1.5 South Korea
- 13.1.6 Rest of Asia Pacific
- 14. Middle East and Africa Bionics Industry Analysis, Insights and Forecast, 2019-2031
- 14.1. Market Analysis, Insights and Forecast - By Country/Sub-region
- 14.1.1 GCC
- 14.1.2 South Africa
- 14.1.3 Rest of Middle East and Africa
- 15. South America Bionics Industry Analysis, Insights and Forecast, 2019-2031
- 15.1. Market Analysis, Insights and Forecast - By Country/Sub-region
- 15.1.1 Brazil
- 15.1.2 Argentina
- 15.1.3 Rest of South America
- 16. Competitive Analysis
- 16.1. Global Market Share Analysis 2024
- 16.2. Company Profiles
- 16.2.1 Pixium Vision
- 16.2.1.1. Overview
- 16.2.1.2. Products
- 16.2.1.3. SWOT Analysis
- 16.2.1.4. Recent Developments
- 16.2.1.5. Financials (Based on Availability)
- 16.2.2 Open Bionics
- 16.2.2.1. Overview
- 16.2.2.2. Products
- 16.2.2.3. SWOT Analysis
- 16.2.2.4. Recent Developments
- 16.2.2.5. Financials (Based on Availability)
- 16.2.3 Össur Americas (Touch Bionics Inc )
- 16.2.3.1. Overview
- 16.2.3.2. Products
- 16.2.3.3. SWOT Analysis
- 16.2.3.4. Recent Developments
- 16.2.3.5. Financials (Based on Availability)
- 16.2.4 Edward Lifesciences Corporation
- 16.2.4.1. Overview
- 16.2.4.2. Products
- 16.2.4.3. SWOT Analysis
- 16.2.4.4. Recent Developments
- 16.2.4.5. Financials (Based on Availability)
- 16.2.5 Medtronic PLC
- 16.2.5.1. Overview
- 16.2.5.2. Products
- 16.2.5.3. SWOT Analysis
- 16.2.5.4. Recent Developments
- 16.2.5.5. Financials (Based on Availability)
- 16.2.6 Ekso Bionics
- 16.2.6.1. Overview
- 16.2.6.2. Products
- 16.2.6.3. SWOT Analysis
- 16.2.6.4. Recent Developments
- 16.2.6.5. Financials (Based on Availability)
- 16.2.7 Ottobock
- 16.2.7.1. Overview
- 16.2.7.2. Products
- 16.2.7.3. SWOT Analysis
- 16.2.7.4. Recent Developments
- 16.2.7.5. Financials (Based on Availability)
- 16.2.8 Bionics Scientific Technologies (P) Ltd
- 16.2.8.1. Overview
- 16.2.8.2. Products
- 16.2.8.3. SWOT Analysis
- 16.2.8.4. Recent Developments
- 16.2.8.5. Financials (Based on Availability)
- 16.2.9 Bionic Prosthetics and Orthotics
- 16.2.9.1. Overview
- 16.2.9.2. Products
- 16.2.9.3. SWOT Analysis
- 16.2.9.4. Recent Developments
- 16.2.9.5. Financials (Based on Availability)
- 16.2.10 Mobius Bionics
- 16.2.10.1. Overview
- 16.2.10.2. Products
- 16.2.10.3. SWOT Analysis
- 16.2.10.4. Recent Developments
- 16.2.10.5. Financials (Based on Availability)
- 16.2.11 Cochlear Limited
- 16.2.11.1. Overview
- 16.2.11.2. Products
- 16.2.11.3. SWOT Analysis
- 16.2.11.4. Recent Developments
- 16.2.11.5. Financials (Based on Availability)
- 16.2.12 Advanced Bionics AG
- 16.2.12.1. Overview
- 16.2.12.2. Products
- 16.2.12.3. SWOT Analysis
- 16.2.12.4. Recent Developments
- 16.2.12.5. Financials (Based on Availability)
- 16.2.1 Pixium Vision
List of Figures
- Figure 1: Global Bionics Industry Revenue Breakdown (Million, %) by Region 2024 & 2032
- Figure 2: Global Bionics Industry Volume Breakdown (K Unit, %) by Region 2024 & 2032
- Figure 3: North America Bionics Industry Revenue (Million), by Country 2024 & 2032
- Figure 4: North America Bionics Industry Volume (K Unit), by Country 2024 & 2032
- Figure 5: North America Bionics Industry Revenue Share (%), by Country 2024 & 2032
- Figure 6: North America Bionics Industry Volume Share (%), by Country 2024 & 2032
- Figure 7: Europe Bionics Industry Revenue (Million), by Country 2024 & 2032
- Figure 8: Europe Bionics Industry Volume (K Unit), by Country 2024 & 2032
- Figure 9: Europe Bionics Industry Revenue Share (%), by Country 2024 & 2032
- Figure 10: Europe Bionics Industry Volume Share (%), by Country 2024 & 2032
- Figure 11: Asia Pacific Bionics Industry Revenue (Million), by Country 2024 & 2032
- Figure 12: Asia Pacific Bionics Industry Volume (K Unit), by Country 2024 & 2032
- Figure 13: Asia Pacific Bionics Industry Revenue Share (%), by Country 2024 & 2032
- Figure 14: Asia Pacific Bionics Industry Volume Share (%), by Country 2024 & 2032
- Figure 15: Middle East and Africa Bionics Industry Revenue (Million), by Country 2024 & 2032
- Figure 16: Middle East and Africa Bionics Industry Volume (K Unit), by Country 2024 & 2032
- Figure 17: Middle East and Africa Bionics Industry Revenue Share (%), by Country 2024 & 2032
- Figure 18: Middle East and Africa Bionics Industry Volume Share (%), by Country 2024 & 2032
- Figure 19: South America Bionics Industry Revenue (Million), by Country 2024 & 2032
- Figure 20: South America Bionics Industry Volume (K Unit), by Country 2024 & 2032
- Figure 21: South America Bionics Industry Revenue Share (%), by Country 2024 & 2032
- Figure 22: South America Bionics Industry Volume Share (%), by Country 2024 & 2032
- Figure 23: North America Bionics Industry Revenue (Million), by Type of Bionics 2024 & 2032
- Figure 24: North America Bionics Industry Volume (K Unit), by Type of Bionics 2024 & 2032
- Figure 25: North America Bionics Industry Revenue Share (%), by Type of Bionics 2024 & 2032
- Figure 26: North America Bionics Industry Volume Share (%), by Type of Bionics 2024 & 2032
- Figure 27: North America Bionics Industry Revenue (Million), by Country 2024 & 2032
- Figure 28: North America Bionics Industry Volume (K Unit), by Country 2024 & 2032
- Figure 29: North America Bionics Industry Revenue Share (%), by Country 2024 & 2032
- Figure 30: North America Bionics Industry Volume Share (%), by Country 2024 & 2032
- Figure 31: Europe Bionics Industry Revenue (Million), by Type of Bionics 2024 & 2032
- Figure 32: Europe Bionics Industry Volume (K Unit), by Type of Bionics 2024 & 2032
- Figure 33: Europe Bionics Industry Revenue Share (%), by Type of Bionics 2024 & 2032
- Figure 34: Europe Bionics Industry Volume Share (%), by Type of Bionics 2024 & 2032
- Figure 35: Europe Bionics Industry Revenue (Million), by Country 2024 & 2032
- Figure 36: Europe Bionics Industry Volume (K Unit), by Country 2024 & 2032
- Figure 37: Europe Bionics Industry Revenue Share (%), by Country 2024 & 2032
- Figure 38: Europe Bionics Industry Volume Share (%), by Country 2024 & 2032
- Figure 39: Asia Pacific Bionics Industry Revenue (Million), by Type of Bionics 2024 & 2032
- Figure 40: Asia Pacific Bionics Industry Volume (K Unit), by Type of Bionics 2024 & 2032
- Figure 41: Asia Pacific Bionics Industry Revenue Share (%), by Type of Bionics 2024 & 2032
- Figure 42: Asia Pacific Bionics Industry Volume Share (%), by Type of Bionics 2024 & 2032
- Figure 43: Asia Pacific Bionics Industry Revenue (Million), by Country 2024 & 2032
- Figure 44: Asia Pacific Bionics Industry Volume (K Unit), by Country 2024 & 2032
- Figure 45: Asia Pacific Bionics Industry Revenue Share (%), by Country 2024 & 2032
- Figure 46: Asia Pacific Bionics Industry Volume Share (%), by Country 2024 & 2032
- Figure 47: Middle East and Africa Bionics Industry Revenue (Million), by Type of Bionics 2024 & 2032
- Figure 48: Middle East and Africa Bionics Industry Volume (K Unit), by Type of Bionics 2024 & 2032
- Figure 49: Middle East and Africa Bionics Industry Revenue Share (%), by Type of Bionics 2024 & 2032
- Figure 50: Middle East and Africa Bionics Industry Volume Share (%), by Type of Bionics 2024 & 2032
- Figure 51: Middle East and Africa Bionics Industry Revenue (Million), by Country 2024 & 2032
- Figure 52: Middle East and Africa Bionics Industry Volume (K Unit), by Country 2024 & 2032
- Figure 53: Middle East and Africa Bionics Industry Revenue Share (%), by Country 2024 & 2032
- Figure 54: Middle East and Africa Bionics Industry Volume Share (%), by Country 2024 & 2032
- Figure 55: South America Bionics Industry Revenue (Million), by Type of Bionics 2024 & 2032
- Figure 56: South America Bionics Industry Volume (K Unit), by Type of Bionics 2024 & 2032
- Figure 57: South America Bionics Industry Revenue Share (%), by Type of Bionics 2024 & 2032
- Figure 58: South America Bionics Industry Volume Share (%), by Type of Bionics 2024 & 2032
- Figure 59: South America Bionics Industry Revenue (Million), by Country 2024 & 2032
- Figure 60: South America Bionics Industry Volume (K Unit), by Country 2024 & 2032
- Figure 61: South America Bionics Industry Revenue Share (%), by Country 2024 & 2032
- Figure 62: South America Bionics Industry Volume Share (%), by Country 2024 & 2032
List of Tables
- Table 1: Global Bionics Industry Revenue Million Forecast, by Region 2019 & 2032
- Table 2: Global Bionics Industry Volume K Unit Forecast, by Region 2019 & 2032
- Table 3: Global Bionics Industry Revenue Million Forecast, by Type of Bionics 2019 & 2032
- Table 4: Global Bionics Industry Volume K Unit Forecast, by Type of Bionics 2019 & 2032
- Table 5: Global Bionics Industry Revenue Million Forecast, by Region 2019 & 2032
- Table 6: Global Bionics Industry Volume K Unit Forecast, by Region 2019 & 2032
- Table 7: Global Bionics Industry Revenue Million Forecast, by Country 2019 & 2032
- Table 8: Global Bionics Industry Volume K Unit Forecast, by Country 2019 & 2032
- Table 9: United States Bionics Industry Revenue (Million) Forecast, by Application 2019 & 2032
- Table 10: United States Bionics Industry Volume (K Unit) Forecast, by Application 2019 & 2032
- Table 11: Canada Bionics Industry Revenue (Million) Forecast, by Application 2019 & 2032
- Table 12: Canada Bionics Industry Volume (K Unit) Forecast, by Application 2019 & 2032
- Table 13: Mexico Bionics Industry Revenue (Million) Forecast, by Application 2019 & 2032
- Table 14: Mexico Bionics Industry Volume (K Unit) Forecast, by Application 2019 & 2032
- Table 15: Global Bionics Industry Revenue Million Forecast, by Country 2019 & 2032
- Table 16: Global Bionics Industry Volume K Unit Forecast, by Country 2019 & 2032
- Table 17: Germany Bionics Industry Revenue (Million) Forecast, by Application 2019 & 2032
- Table 18: Germany Bionics Industry Volume (K Unit) Forecast, by Application 2019 & 2032
- Table 19: United Kingdom Bionics Industry Revenue (Million) Forecast, by Application 2019 & 2032
- Table 20: United Kingdom Bionics Industry Volume (K Unit) Forecast, by Application 2019 & 2032
- Table 21: France Bionics Industry Revenue (Million) Forecast, by Application 2019 & 2032
- Table 22: France Bionics Industry Volume (K Unit) Forecast, by Application 2019 & 2032
- Table 23: Italy Bionics Industry Revenue (Million) Forecast, by Application 2019 & 2032
- Table 24: Italy Bionics Industry Volume (K Unit) Forecast, by Application 2019 & 2032
- Table 25: Spain Bionics Industry Revenue (Million) Forecast, by Application 2019 & 2032
- Table 26: Spain Bionics Industry Volume (K Unit) Forecast, by Application 2019 & 2032
- Table 27: Rest of Europe Bionics Industry Revenue (Million) Forecast, by Application 2019 & 2032
- Table 28: Rest of Europe Bionics Industry Volume (K Unit) Forecast, by Application 2019 & 2032
- Table 29: Global Bionics Industry Revenue Million Forecast, by Country 2019 & 2032
- Table 30: Global Bionics Industry Volume K Unit Forecast, by Country 2019 & 2032
- Table 31: China Bionics Industry Revenue (Million) Forecast, by Application 2019 & 2032
- Table 32: China Bionics Industry Volume (K Unit) Forecast, by Application 2019 & 2032
- Table 33: Japan Bionics Industry Revenue (Million) Forecast, by Application 2019 & 2032
- Table 34: Japan Bionics Industry Volume (K Unit) Forecast, by Application 2019 & 2032
- Table 35: India Bionics Industry Revenue (Million) Forecast, by Application 2019 & 2032
- Table 36: India Bionics Industry Volume (K Unit) Forecast, by Application 2019 & 2032
- Table 37: Australia Bionics Industry Revenue (Million) Forecast, by Application 2019 & 2032
- Table 38: Australia Bionics Industry Volume (K Unit) Forecast, by Application 2019 & 2032
- Table 39: South Korea Bionics Industry Revenue (Million) Forecast, by Application 2019 & 2032
- Table 40: South Korea Bionics Industry Volume (K Unit) Forecast, by Application 2019 & 2032
- Table 41: Rest of Asia Pacific Bionics Industry Revenue (Million) Forecast, by Application 2019 & 2032
- Table 42: Rest of Asia Pacific Bionics Industry Volume (K Unit) Forecast, by Application 2019 & 2032
- Table 43: Global Bionics Industry Revenue Million Forecast, by Country 2019 & 2032
- Table 44: Global Bionics Industry Volume K Unit Forecast, by Country 2019 & 2032
- Table 45: GCC Bionics Industry Revenue (Million) Forecast, by Application 2019 & 2032
- Table 46: GCC Bionics Industry Volume (K Unit) Forecast, by Application 2019 & 2032
- Table 47: South Africa Bionics Industry Revenue (Million) Forecast, by Application 2019 & 2032
- Table 48: South Africa Bionics Industry Volume (K Unit) Forecast, by Application 2019 & 2032
- Table 49: Rest of Middle East and Africa Bionics Industry Revenue (Million) Forecast, by Application 2019 & 2032
- Table 50: Rest of Middle East and Africa Bionics Industry Volume (K Unit) Forecast, by Application 2019 & 2032
- Table 51: Global Bionics Industry Revenue Million Forecast, by Country 2019 & 2032
- Table 52: Global Bionics Industry Volume K Unit Forecast, by Country 2019 & 2032
- Table 53: Brazil Bionics Industry Revenue (Million) Forecast, by Application 2019 & 2032
- Table 54: Brazil Bionics Industry Volume (K Unit) Forecast, by Application 2019 & 2032
- Table 55: Argentina Bionics Industry Revenue (Million) Forecast, by Application 2019 & 2032
- Table 56: Argentina Bionics Industry Volume (K Unit) Forecast, by Application 2019 & 2032
- Table 57: Rest of South America Bionics Industry Revenue (Million) Forecast, by Application 2019 & 2032
- Table 58: Rest of South America Bionics Industry Volume (K Unit) Forecast, by Application 2019 & 2032
- Table 59: Global Bionics Industry Revenue Million Forecast, by Type of Bionics 2019 & 2032
- Table 60: Global Bionics Industry Volume K Unit Forecast, by Type of Bionics 2019 & 2032
- Table 61: Global Bionics Industry Revenue Million Forecast, by Country 2019 & 2032
- Table 62: Global Bionics Industry Volume K Unit Forecast, by Country 2019 & 2032
- Table 63: United States Bionics Industry Revenue (Million) Forecast, by Application 2019 & 2032
- Table 64: United States Bionics Industry Volume (K Unit) Forecast, by Application 2019 & 2032
- Table 65: Canada Bionics Industry Revenue (Million) Forecast, by Application 2019 & 2032
- Table 66: Canada Bionics Industry Volume (K Unit) Forecast, by Application 2019 & 2032
- Table 67: Mexico Bionics Industry Revenue (Million) Forecast, by Application 2019 & 2032
- Table 68: Mexico Bionics Industry Volume (K Unit) Forecast, by Application 2019 & 2032
- Table 69: Global Bionics Industry Revenue Million Forecast, by Type of Bionics 2019 & 2032
- Table 70: Global Bionics Industry Volume K Unit Forecast, by Type of Bionics 2019 & 2032
- Table 71: Global Bionics Industry Revenue Million Forecast, by Country 2019 & 2032
- Table 72: Global Bionics Industry Volume K Unit Forecast, by Country 2019 & 2032
- Table 73: Germany Bionics Industry Revenue (Million) Forecast, by Application 2019 & 2032
- Table 74: Germany Bionics Industry Volume (K Unit) Forecast, by Application 2019 & 2032
- Table 75: United Kingdom Bionics Industry Revenue (Million) Forecast, by Application 2019 & 2032
- Table 76: United Kingdom Bionics Industry Volume (K Unit) Forecast, by Application 2019 & 2032
- Table 77: France Bionics Industry Revenue (Million) Forecast, by Application 2019 & 2032
- Table 78: France Bionics Industry Volume (K Unit) Forecast, by Application 2019 & 2032
- Table 79: Italy Bionics Industry Revenue (Million) Forecast, by Application 2019 & 2032
- Table 80: Italy Bionics Industry Volume (K Unit) Forecast, by Application 2019 & 2032
- Table 81: Spain Bionics Industry Revenue (Million) Forecast, by Application 2019 & 2032
- Table 82: Spain Bionics Industry Volume (K Unit) Forecast, by Application 2019 & 2032
- Table 83: Rest of Europe Bionics Industry Revenue (Million) Forecast, by Application 2019 & 2032
- Table 84: Rest of Europe Bionics Industry Volume (K Unit) Forecast, by Application 2019 & 2032
- Table 85: Global Bionics Industry Revenue Million Forecast, by Type of Bionics 2019 & 2032
- Table 86: Global Bionics Industry Volume K Unit Forecast, by Type of Bionics 2019 & 2032
- Table 87: Global Bionics Industry Revenue Million Forecast, by Country 2019 & 2032
- Table 88: Global Bionics Industry Volume K Unit Forecast, by Country 2019 & 2032
- Table 89: China Bionics Industry Revenue (Million) Forecast, by Application 2019 & 2032
- Table 90: China Bionics Industry Volume (K Unit) Forecast, by Application 2019 & 2032
- Table 91: Japan Bionics Industry Revenue (Million) Forecast, by Application 2019 & 2032
- Table 92: Japan Bionics Industry Volume (K Unit) Forecast, by Application 2019 & 2032
- Table 93: India Bionics Industry Revenue (Million) Forecast, by Application 2019 & 2032
- Table 94: India Bionics Industry Volume (K Unit) Forecast, by Application 2019 & 2032
- Table 95: Australia Bionics Industry Revenue (Million) Forecast, by Application 2019 & 2032
- Table 96: Australia Bionics Industry Volume (K Unit) Forecast, by Application 2019 & 2032
- Table 97: South Korea Bionics Industry Revenue (Million) Forecast, by Application 2019 & 2032
- Table 98: South Korea Bionics Industry Volume (K Unit) Forecast, by Application 2019 & 2032
- Table 99: Rest of Asia Pacific Bionics Industry Revenue (Million) Forecast, by Application 2019 & 2032
- Table 100: Rest of Asia Pacific Bionics Industry Volume (K Unit) Forecast, by Application 2019 & 2032
- Table 101: Global Bionics Industry Revenue Million Forecast, by Type of Bionics 2019 & 2032
- Table 102: Global Bionics Industry Volume K Unit Forecast, by Type of Bionics 2019 & 2032
- Table 103: Global Bionics Industry Revenue Million Forecast, by Country 2019 & 2032
- Table 104: Global Bionics Industry Volume K Unit Forecast, by Country 2019 & 2032
- Table 105: GCC Bionics Industry Revenue (Million) Forecast, by Application 2019 & 2032
- Table 106: GCC Bionics Industry Volume (K Unit) Forecast, by Application 2019 & 2032
- Table 107: South Africa Bionics Industry Revenue (Million) Forecast, by Application 2019 & 2032
- Table 108: South Africa Bionics Industry Volume (K Unit) Forecast, by Application 2019 & 2032
- Table 109: Rest of Middle East and Africa Bionics Industry Revenue (Million) Forecast, by Application 2019 & 2032
- Table 110: Rest of Middle East and Africa Bionics Industry Volume (K Unit) Forecast, by Application 2019 & 2032
- Table 111: Global Bionics Industry Revenue Million Forecast, by Type of Bionics 2019 & 2032
- Table 112: Global Bionics Industry Volume K Unit Forecast, by Type of Bionics 2019 & 2032
- Table 113: Global Bionics Industry Revenue Million Forecast, by Country 2019 & 2032
- Table 114: Global Bionics Industry Volume K Unit Forecast, by Country 2019 & 2032
- Table 115: Brazil Bionics Industry Revenue (Million) Forecast, by Application 2019 & 2032
- Table 116: Brazil Bionics Industry Volume (K Unit) Forecast, by Application 2019 & 2032
- Table 117: Argentina Bionics Industry Revenue (Million) Forecast, by Application 2019 & 2032
- Table 118: Argentina Bionics Industry Volume (K Unit) Forecast, by Application 2019 & 2032
- Table 119: Rest of South America Bionics Industry Revenue (Million) Forecast, by Application 2019 & 2032
- Table 120: Rest of South America Bionics Industry Volume (K Unit) Forecast, by Application 2019 & 2032
Frequently Asked Questions
1. What is the projected Compound Annual Growth Rate (CAGR) of the Bionics Industry?
The projected CAGR is approximately 9.60%.
2. Which companies are prominent players in the Bionics Industry?
Key companies in the market include Pixium Vision, Open Bionics, Össur Americas (Touch Bionics Inc ), Edward Lifesciences Corporation, Medtronic PLC, Ekso Bionics, Ottobock, Bionics Scientific Technologies (P) Ltd, Bionic Prosthetics and Orthotics, Mobius Bionics, Cochlear Limited, Advanced Bionics AG.
3. What are the main segments of the Bionics Industry?
The market segments include Type of Bionics.
4. Can you provide details about the market size?
The market size is estimated to be USD 6.69 Million as of 2022.
5. What are some drivers contributing to market growth?
Increased Incidence of Disabilities and Organ Failures; Technological Advancements; High Incidence of Road Accidents Leading to Amputations.
6. What are the notable trends driving market growth?
Cochlear implant are Estimated to Hold a Significant Share in the Fixation Type Segment of the Bionics Market.
7. Are there any restraints impacting market growth?
High Cost of Devices and Uncertain Reimbursement Scenarios; Fear of Device Malfunction and Its Consequences.
8. Can you provide examples of recent developments in the market?
In July 2022, Prosthetics startup Unlimited Tomorrow launched TrueLimb, its next-generation bionic arm. The hands have independent finger joints and six adaptive grips, which conform to objects the wearer comes in contact with, and subtle vibrations.
9. What pricing options are available for accessing the report?
Pricing options include single-user, multi-user, and enterprise licenses priced at USD 4750, USD 5250, and USD 8750 respectively.
10. Is the market size provided in terms of value or volume?
The market size is provided in terms of value, measured in Million and volume, measured in K Unit.
11. Are there any specific market keywords associated with the report?
Yes, the market keyword associated with the report is "Bionics Industry," which aids in identifying and referencing the specific market segment covered.
12. How do I determine which pricing option suits my needs best?
The pricing options vary based on user requirements and access needs. Individual users may opt for single-user licenses, while businesses requiring broader access may choose multi-user or enterprise licenses for cost-effective access to the report.
13. Are there any additional resources or data provided in the Bionics Industry report?
While the report offers comprehensive insights, it's advisable to review the specific contents or supplementary materials provided to ascertain if additional resources or data are available.
14. How can I stay updated on further developments or reports in the Bionics Industry?
To stay informed about further developments, trends, and reports in the Bionics Industry, consider subscribing to industry newsletters, following relevant companies and organizations, or regularly checking reputable industry news sources and publications.
Methodology
Step 1 - Identification of Relevant Samples Size from Population Database


Step 2 - Approaches for Defining Global Market Size (Value, Volume* & Price*)

Note*: In applicable scenarios
Step 3 - Data Sources
Primary Research
- Web Analytics
- Survey Reports
- Research Institute
- Latest Research Reports
- Opinion Leaders
Secondary Research
- Annual Reports
- White Paper
- Latest Press Release
- Industry Association
- Paid Database
- Investor Presentations

Step 4 - Data Triangulation
Involves using different sources of information in order to increase the validity of a study
These sources are likely to be stakeholders in a program - participants, other researchers, program staff, other community members, and so on.
Then we put all data in single framework & apply various statistical tools to find out the dynamic on the market.
During the analysis stage, feedback from the stakeholder groups would be compared to determine areas of agreement as well as areas of divergence


