
Key Insights
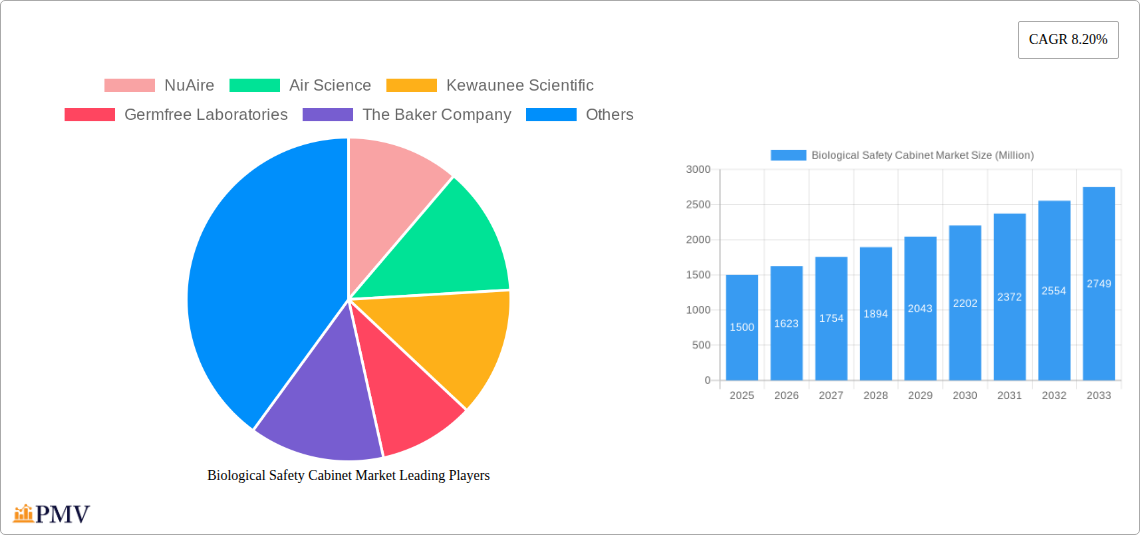
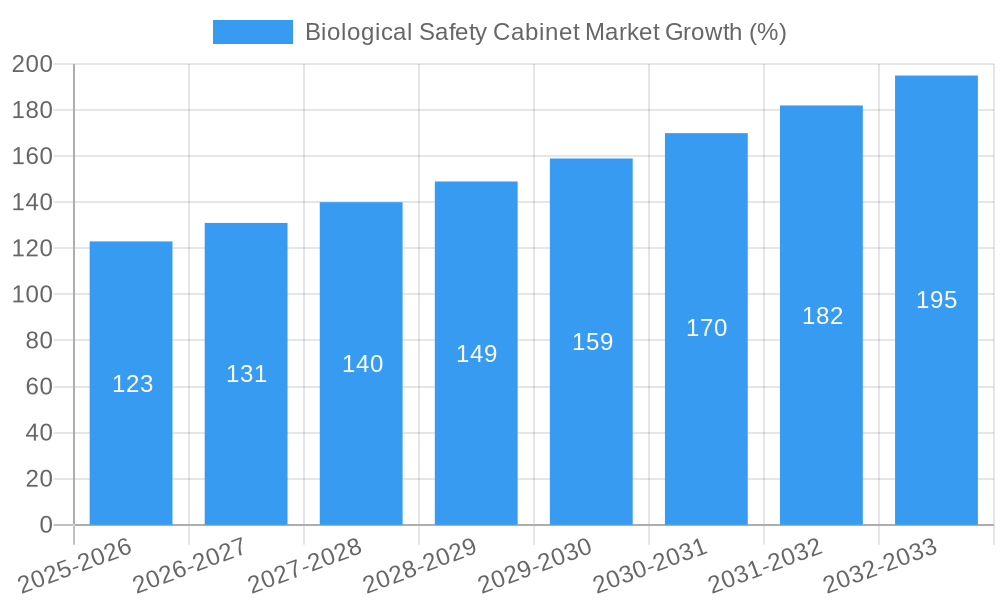
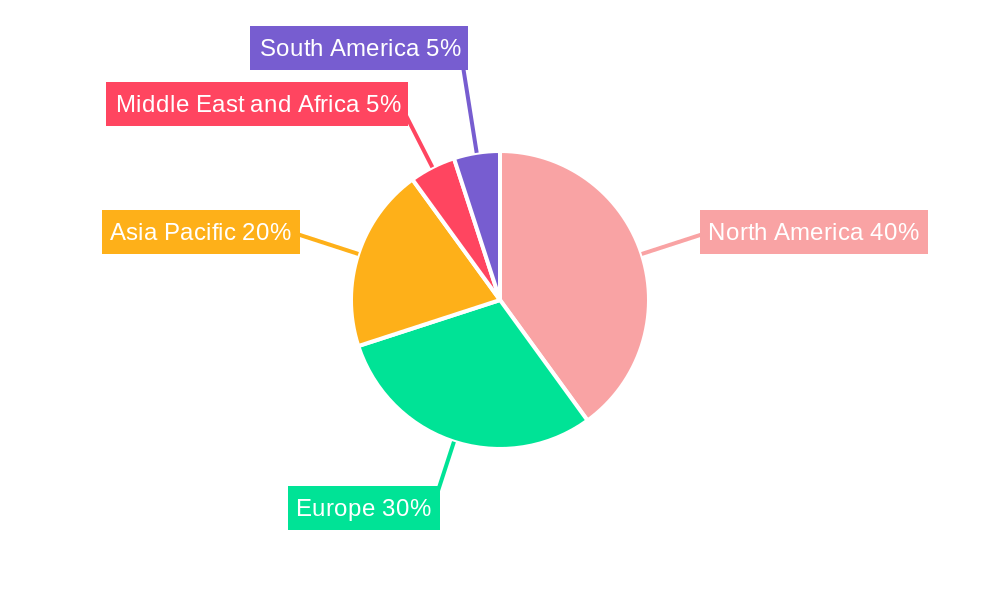
The global Biological Safety Cabinet (BSC) market, valued at approximately $1.5 billion in 2025, is projected to experience robust growth, exhibiting a compound annual growth rate (CAGR) of 8.20% from 2025 to 2033. This expansion is driven by several key factors. The burgeoning pharmaceutical and biotechnology industries, fueled by advancements in drug discovery and development, are significant consumers of BSCs, necessitating increased investment in laboratory infrastructure. Furthermore, a rising global prevalence of infectious diseases, coupled with stringent biosafety regulations enforced across various research sectors, underscores the critical need for effective containment solutions like BSCs. The expanding academic and research sectors, particularly in developing economies, are also contributing to market growth as they invest in advanced research facilities. Technological advancements leading to the development of more efficient and sophisticated BSCs, such as those incorporating improved HEPA filtration systems and enhanced safety features, further stimulate demand. Segmentation reveals a significant market share held by Class II BSCs, reflecting their versatile application across diverse research and industrial settings. North America and Europe currently dominate the market, driven by established research infrastructure and robust regulatory frameworks. However, the Asia-Pacific region is poised for significant growth, fueled by expanding healthcare infrastructure and increasing research and development activities.
Despite the positive outlook, the market faces certain restraints. High initial investment costs associated with purchasing and maintaining BSCs can be a barrier, particularly for smaller laboratories and research facilities in emerging markets. Moreover, fluctuations in government funding allocated to research and development initiatives can impact market growth. Competitive intensity among established and emerging manufacturers necessitates innovation and cost-effective solutions to maintain a competitive edge. Nonetheless, the long-term growth trajectory of the BSC market remains positive, propelled by sustained demand from key end-users and ongoing technological advancements. The market is likely to witness increased adoption of advanced features such as automated monitoring systems and improved ergonomics to optimize safety and operational efficiency.
Biological Safety Cabinet Market: A Comprehensive Report (2019-2033)
This comprehensive report provides an in-depth analysis of the Biological Safety Cabinet (BSC) market, offering invaluable insights for stakeholders across the pharmaceutical, biotechnology, academic, and research sectors. Covering the period from 2019 to 2033, with a focus on 2025, this report delivers a detailed understanding of market dynamics, competitive landscapes, and future growth prospects. The global Biological Safety Cabinet market size is estimated at xx Million in 2025 and is projected to reach xx Million by 2033, exhibiting a CAGR of xx% during the forecast period (2025-2033).
Biological Safety Cabinet Market Structure & Competitive Dynamics
The Biological Safety Cabinet market is moderately concentrated, with key players like NuAire, Air Science, Kewaunee Scientific, Germfree Laboratories, The Baker Company, Esco Micro, BIOBASE, Labconco, Thermo Fisher Scientific, and Cruma holding significant market share. The market exhibits a dynamic innovation ecosystem, driven by ongoing technological advancements in biosafety features and user-friendly designs. Stringent regulatory frameworks, particularly concerning safety standards and certifications, significantly influence market dynamics. Product substitutes, such as laminar flow hoods and isolators, present competitive pressures. However, the rising demand for enhanced biosafety in research and pharmaceutical settings fuels market growth. End-user trends, particularly a shift towards sophisticated cabinets with advanced features, further shape the market landscape. M&A activities have been moderate in recent years, with deal values averaging xx Million per transaction, consolidating market share and driving innovation. For example, the acquisition of smaller BSC manufacturers by larger players improves product portfolios and expands market reach. Market share distribution among the top players is approximately as follows: Thermo Fisher Scientific (xx%), NuAire (xx%), Esco Micro (xx%), and others (xx%).
Biological Safety Cabinet Market Industry Trends & Insights
The Biological Safety Cabinet market is witnessing robust growth, primarily fueled by the increasing prevalence of infectious diseases and the expanding pharmaceutical and biotechnology sectors. Technological advancements such as the integration of advanced filtration systems, improved monitoring capabilities, and user-friendly interfaces are driving market penetration. Consumer preferences are shifting towards energy-efficient, user-friendly, and technologically advanced cabinets, impacting product design and development. The market's competitive dynamics are characterized by product innovation, strategic partnerships, and regional expansion strategies. The historical period (2019-2024) saw a CAGR of xx%, largely driven by the increased focus on biosafety and research investments in developed economies. The forecast period (2025-2033) is projected to witness continued growth, although at a slightly moderated pace, influenced by factors such as economic conditions and technological saturation in certain segments. Market penetration rates are increasing steadily, with a projected xx% market penetration by 2033 in key regions.
Dominant Markets & Segments in Biological Safety Cabinet Market
Dominant Regions & Segments:
By End-User: The pharmaceutical and biotechnology sector represents the largest segment of the BSC market, driven by stringent regulatory requirements and the increasing demand for advanced biosafety measures in drug development and manufacturing. Key drivers include substantial R&D investments, stringent regulatory compliance needs, and the growing number of biopharmaceutical companies. Academic and research laboratories also constitute a significant market segment, fueled by increased research activities globally. The "Others" segment includes healthcare institutions and industrial settings with specific biosafety needs.
By Type: Class II BSCs dominate the market, owing to their versatility and ability to handle various biological agents. Class I cabinets are used for basic protection and are a smaller market segment. Class III BSCs are specialized cabinets for handling high-risk agents, with a comparatively smaller but consistently growing market due to their superior protection capabilities.
Geographic Dominance: North America and Europe currently hold the largest market shares in the BSC market due to well-established healthcare infrastructures, robust R&D activities, and stringent safety regulations. Asia-Pacific is predicted to show significant growth in the forecast period due to increasing healthcare investments and an expanding pharmaceutical and biotechnology sector.
Biological Safety Cabinet Market Product Innovations
Recent product developments include the launch of cabinets with enhanced safety features such as improved airflow management, improved user interfaces, and automated controls. These innovations address the need for enhanced biosafety, simplified operation, and energy efficiency. For example, the integration of intelligent monitoring systems allows for real-time performance tracking and proactive maintenance, thus ensuring continuous operation and safety. These advancements meet market needs for reliable and technologically advanced solutions.
Report Segmentation & Scope
This report segments the Biological Safety Cabinet market by end-user (pharmaceutical and biotechnology companies, academic and research laboratories, others) and by type (Class I, Class II, Class III). Each segment is analyzed for its growth projections, market size, and competitive dynamics. The pharmaceutical and biotechnology segment projects the highest growth due to expanding R&D activities and stringent regulatory standards. The academic and research sector presents consistent demand driven by increased research funding. The Class II BSC segment holds the largest market share due to its versatility, while Class III BSCs are anticipated to witness significant growth driven by specialized needs in high-containment laboratories.
Key Drivers of Biological Safety Cabinet Market Growth
Several factors drive the growth of the Biological Safety Cabinet market. The rising prevalence of infectious diseases necessitates advanced biosafety solutions, pushing demand for BSCs. Stringent regulatory frameworks mandate the use of BSCs in research and pharmaceutical settings. Increased investments in R&D activities globally fuel the demand for high-quality biosafety cabinets. Advances in technology, such as integrated monitoring systems and improved airflow management, are improving safety, efficiency, and user experience, further propelling market expansion.
Challenges in the Biological Safety Cabinet Market Sector
The BSC market faces several challenges. High initial investment costs can be a barrier to adoption, particularly for smaller laboratories. The complexity of BSC technology and the need for specialized maintenance can pose operational challenges. Stringent regulatory compliance requirements and their variations across regions may increase compliance costs. Furthermore, competition from manufacturers offering similar but lower-cost solutions impacts pricing and profitability for major players.
Leading Players in the Biological Safety Cabinet Market
- NuAire
- Air Science
- Kewaunee Scientific
- Germfree Laboratories
- The Baker Company
- Esco Micro
- BIOBASE
- Labconco
- Thermo Fisher Scientific
- Cruma
Key Developments in Biological Safety Cabinet Market Sector
May 2021: Labconco launched the Purifier Axiom Biosafety Cabinet, featuring an upgraded MyLogic OS and enhanced safety features like Active Protection Protocol (APP). This launch significantly impacted the market by offering improved safety and user experience.
April 2021: Thermo Fisher Scientific launched the Thermo Scientific 1300 Series Class II, Type A2 Biological Safety Cabinet Packages, including a cabinet, stand, UV light, and armrests. This package offered a comprehensive solution for laboratories.
Strategic Biological Safety Cabinet Market Outlook
The Biological Safety Cabinet market holds significant future potential, driven by sustained growth in the pharmaceutical, biotechnology, and research sectors. Strategic opportunities exist in developing innovative BSC designs with enhanced safety features, improved energy efficiency, and user-friendly interfaces. Expanding into emerging markets, particularly in Asia-Pacific, presents substantial growth potential. Strategic partnerships and acquisitions will play a crucial role in shaping the market's competitive landscape and driving further innovation in this critical sector.
Biological Safety Cabinet Market Segmentation
-
1. Type
- 1.1. Class I
- 1.2. Class II
- 1.3. Class III
-
2. End-User
- 2.1. Pharmaceutical and Biotechnology Companies
- 2.2. Academic and Research Laboratories
- 2.3. Others
Biological Safety Cabinet Market Segmentation By Geography
-
1. North America
- 1.1. United States
- 1.2. Canada
- 1.3. Mexico
-
2. Europe
- 2.1. Germany
- 2.2. United Kingdom
- 2.3. France
- 2.4. Italy
- 2.5. Spain
- 2.6. Rest of Europe
-
3. Asia Pacific
- 3.1. China
- 3.2. Japan
- 3.3. India
- 3.4. Australia
- 3.5. South Korea
- 3.6. Rest of Asia Pacific
-
4. Middle East and Africa
- 4.1. GCC
- 4.2. South Africa
- 4.3. Rest of Middle East and Africa
-
5. South America
- 5.1. Brazil
- 5.2. Argentina
- 5.3. Rest of South America
Biological Safety Cabinet Market REPORT HIGHLIGHTS
| Aspects | Details |
|---|---|
| Study Period | 2019-2033 |
| Base Year | 2024 |
| Estimated Year | 2025 |
| Forecast Period | 2025-2033 |
| Historical Period | 2019-2024 |
| Growth Rate | CAGR of 8.20% from 2019-2033 |
| Segmentation |
|
Table of Contents
- 1. Introduction
- 1.1. Research Scope
- 1.2. Market Segmentation
- 1.3. Research Methodology
- 1.4. Definitions and Assumptions
- 2. Executive Summary
- 2.1. Introduction
- 3. Market Dynamics
- 3.1. Introduction
- 3.2. Market Drivers
- 3.2.1. Increasing R&D Activities in Pharmaceutical and Biotechnology Industries; Increased Risk of Pandemics and Communicable Diseases; Rising Demand for Effective and Advance Technology-based Products
- 3.3. Market Restrains
- 3.3.1. High Cost Associated with the Biological Safety Cabinets
- 3.4. Market Trends
- 3.4.1. Pharmaceutical and Biotechnology Segment is Expected to Hold a Major Market Share in the Biological Safety Cabinet Market
- 4. Market Factor Analysis
- 4.1. Porters Five Forces
- 4.2. Supply/Value Chain
- 4.3. PESTEL analysis
- 4.4. Market Entropy
- 4.5. Patent/Trademark Analysis
- 5. Global Biological Safety Cabinet Market Analysis, Insights and Forecast, 2019-2031
- 5.1. Market Analysis, Insights and Forecast - by Type
- 5.1.1. Class I
- 5.1.2. Class II
- 5.1.3. Class III
- 5.2. Market Analysis, Insights and Forecast - by End-User
- 5.2.1. Pharmaceutical and Biotechnology Companies
- 5.2.2. Academic and Research Laboratories
- 5.2.3. Others
- 5.3. Market Analysis, Insights and Forecast - by Region
- 5.3.1. North America
- 5.3.2. Europe
- 5.3.3. Asia Pacific
- 5.3.4. Middle East and Africa
- 5.3.5. South America
- 5.1. Market Analysis, Insights and Forecast - by Type
- 6. North America Biological Safety Cabinet Market Analysis, Insights and Forecast, 2019-2031
- 6.1. Market Analysis, Insights and Forecast - by Type
- 6.1.1. Class I
- 6.1.2. Class II
- 6.1.3. Class III
- 6.2. Market Analysis, Insights and Forecast - by End-User
- 6.2.1. Pharmaceutical and Biotechnology Companies
- 6.2.2. Academic and Research Laboratories
- 6.2.3. Others
- 6.1. Market Analysis, Insights and Forecast - by Type
- 7. Europe Biological Safety Cabinet Market Analysis, Insights and Forecast, 2019-2031
- 7.1. Market Analysis, Insights and Forecast - by Type
- 7.1.1. Class I
- 7.1.2. Class II
- 7.1.3. Class III
- 7.2. Market Analysis, Insights and Forecast - by End-User
- 7.2.1. Pharmaceutical and Biotechnology Companies
- 7.2.2. Academic and Research Laboratories
- 7.2.3. Others
- 7.1. Market Analysis, Insights and Forecast - by Type
- 8. Asia Pacific Biological Safety Cabinet Market Analysis, Insights and Forecast, 2019-2031
- 8.1. Market Analysis, Insights and Forecast - by Type
- 8.1.1. Class I
- 8.1.2. Class II
- 8.1.3. Class III
- 8.2. Market Analysis, Insights and Forecast - by End-User
- 8.2.1. Pharmaceutical and Biotechnology Companies
- 8.2.2. Academic and Research Laboratories
- 8.2.3. Others
- 8.1. Market Analysis, Insights and Forecast - by Type
- 9. Middle East and Africa Biological Safety Cabinet Market Analysis, Insights and Forecast, 2019-2031
- 9.1. Market Analysis, Insights and Forecast - by Type
- 9.1.1. Class I
- 9.1.2. Class II
- 9.1.3. Class III
- 9.2. Market Analysis, Insights and Forecast - by End-User
- 9.2.1. Pharmaceutical and Biotechnology Companies
- 9.2.2. Academic and Research Laboratories
- 9.2.3. Others
- 9.1. Market Analysis, Insights and Forecast - by Type
- 10. South America Biological Safety Cabinet Market Analysis, Insights and Forecast, 2019-2031
- 10.1. Market Analysis, Insights and Forecast - by Type
- 10.1.1. Class I
- 10.1.2. Class II
- 10.1.3. Class III
- 10.2. Market Analysis, Insights and Forecast - by End-User
- 10.2.1. Pharmaceutical and Biotechnology Companies
- 10.2.2. Academic and Research Laboratories
- 10.2.3. Others
- 10.1. Market Analysis, Insights and Forecast - by Type
- 11. North America Biological Safety Cabinet Market Analysis, Insights and Forecast, 2019-2031
- 11.1. Market Analysis, Insights and Forecast - By Country/Sub-region
- 11.1.1 United States
- 11.1.2 Canada
- 11.1.3 Mexico
- 12. Europe Biological Safety Cabinet Market Analysis, Insights and Forecast, 2019-2031
- 12.1. Market Analysis, Insights and Forecast - By Country/Sub-region
- 12.1.1 Germany
- 12.1.2 United Kingdom
- 12.1.3 France
- 12.1.4 Italy
- 12.1.5 Spain
- 12.1.6 Rest of Europe
- 13. Asia Pacific Biological Safety Cabinet Market Analysis, Insights and Forecast, 2019-2031
- 13.1. Market Analysis, Insights and Forecast - By Country/Sub-region
- 13.1.1 China
- 13.1.2 Japan
- 13.1.3 India
- 13.1.4 Australia
- 13.1.5 South Korea
- 13.1.6 Rest of Asia Pacific
- 14. Middle East and Africa Biological Safety Cabinet Market Analysis, Insights and Forecast, 2019-2031
- 14.1. Market Analysis, Insights and Forecast - By Country/Sub-region
- 14.1.1 GCC
- 14.1.2 South Africa
- 14.1.3 Rest of Middle East and Africa
- 15. South America Biological Safety Cabinet Market Analysis, Insights and Forecast, 2019-2031
- 15.1. Market Analysis, Insights and Forecast - By Country/Sub-region
- 15.1.1 Brazil
- 15.1.2 Argentina
- 15.1.3 Rest of South America
- 16. Competitive Analysis
- 16.1. Global Market Share Analysis 2024
- 16.2. Company Profiles
- 16.2.1 NuAire
- 16.2.1.1. Overview
- 16.2.1.2. Products
- 16.2.1.3. SWOT Analysis
- 16.2.1.4. Recent Developments
- 16.2.1.5. Financials (Based on Availability)
- 16.2.2 Air Science
- 16.2.2.1. Overview
- 16.2.2.2. Products
- 16.2.2.3. SWOT Analysis
- 16.2.2.4. Recent Developments
- 16.2.2.5. Financials (Based on Availability)
- 16.2.3 Kewaunee Scientific
- 16.2.3.1. Overview
- 16.2.3.2. Products
- 16.2.3.3. SWOT Analysis
- 16.2.3.4. Recent Developments
- 16.2.3.5. Financials (Based on Availability)
- 16.2.4 Germfree Laboratories
- 16.2.4.1. Overview
- 16.2.4.2. Products
- 16.2.4.3. SWOT Analysis
- 16.2.4.4. Recent Developments
- 16.2.4.5. Financials (Based on Availability)
- 16.2.5 The Baker Company
- 16.2.5.1. Overview
- 16.2.5.2. Products
- 16.2.5.3. SWOT Analysis
- 16.2.5.4. Recent Developments
- 16.2.5.5. Financials (Based on Availability)
- 16.2.6 Esco Micro
- 16.2.6.1. Overview
- 16.2.6.2. Products
- 16.2.6.3. SWOT Analysis
- 16.2.6.4. Recent Developments
- 16.2.6.5. Financials (Based on Availability)
- 16.2.7 BIOBASE
- 16.2.7.1. Overview
- 16.2.7.2. Products
- 16.2.7.3. SWOT Analysis
- 16.2.7.4. Recent Developments
- 16.2.7.5. Financials (Based on Availability)
- 16.2.8 Labconco
- 16.2.8.1. Overview
- 16.2.8.2. Products
- 16.2.8.3. SWOT Analysis
- 16.2.8.4. Recent Developments
- 16.2.8.5. Financials (Based on Availability)
- 16.2.9 Thermo Fisher Scientific
- 16.2.9.1. Overview
- 16.2.9.2. Products
- 16.2.9.3. SWOT Analysis
- 16.2.9.4. Recent Developments
- 16.2.9.5. Financials (Based on Availability)
- 16.2.10 Cruma
- 16.2.10.1. Overview
- 16.2.10.2. Products
- 16.2.10.3. SWOT Analysis
- 16.2.10.4. Recent Developments
- 16.2.10.5. Financials (Based on Availability)
- 16.2.1 NuAire
List of Figures
- Figure 1: Global Biological Safety Cabinet Market Revenue Breakdown (Million, %) by Region 2024 & 2032
- Figure 2: Global Biological Safety Cabinet Market Volume Breakdown (K Unit, %) by Region 2024 & 2032
- Figure 3: North America Biological Safety Cabinet Market Revenue (Million), by Country 2024 & 2032
- Figure 4: North America Biological Safety Cabinet Market Volume (K Unit), by Country 2024 & 2032
- Figure 5: North America Biological Safety Cabinet Market Revenue Share (%), by Country 2024 & 2032
- Figure 6: North America Biological Safety Cabinet Market Volume Share (%), by Country 2024 & 2032
- Figure 7: Europe Biological Safety Cabinet Market Revenue (Million), by Country 2024 & 2032
- Figure 8: Europe Biological Safety Cabinet Market Volume (K Unit), by Country 2024 & 2032
- Figure 9: Europe Biological Safety Cabinet Market Revenue Share (%), by Country 2024 & 2032
- Figure 10: Europe Biological Safety Cabinet Market Volume Share (%), by Country 2024 & 2032
- Figure 11: Asia Pacific Biological Safety Cabinet Market Revenue (Million), by Country 2024 & 2032
- Figure 12: Asia Pacific Biological Safety Cabinet Market Volume (K Unit), by Country 2024 & 2032
- Figure 13: Asia Pacific Biological Safety Cabinet Market Revenue Share (%), by Country 2024 & 2032
- Figure 14: Asia Pacific Biological Safety Cabinet Market Volume Share (%), by Country 2024 & 2032
- Figure 15: Middle East and Africa Biological Safety Cabinet Market Revenue (Million), by Country 2024 & 2032
- Figure 16: Middle East and Africa Biological Safety Cabinet Market Volume (K Unit), by Country 2024 & 2032
- Figure 17: Middle East and Africa Biological Safety Cabinet Market Revenue Share (%), by Country 2024 & 2032
- Figure 18: Middle East and Africa Biological Safety Cabinet Market Volume Share (%), by Country 2024 & 2032
- Figure 19: South America Biological Safety Cabinet Market Revenue (Million), by Country 2024 & 2032
- Figure 20: South America Biological Safety Cabinet Market Volume (K Unit), by Country 2024 & 2032
- Figure 21: South America Biological Safety Cabinet Market Revenue Share (%), by Country 2024 & 2032
- Figure 22: South America Biological Safety Cabinet Market Volume Share (%), by Country 2024 & 2032
- Figure 23: North America Biological Safety Cabinet Market Revenue (Million), by Type 2024 & 2032
- Figure 24: North America Biological Safety Cabinet Market Volume (K Unit), by Type 2024 & 2032
- Figure 25: North America Biological Safety Cabinet Market Revenue Share (%), by Type 2024 & 2032
- Figure 26: North America Biological Safety Cabinet Market Volume Share (%), by Type 2024 & 2032
- Figure 27: North America Biological Safety Cabinet Market Revenue (Million), by End-User 2024 & 2032
- Figure 28: North America Biological Safety Cabinet Market Volume (K Unit), by End-User 2024 & 2032
- Figure 29: North America Biological Safety Cabinet Market Revenue Share (%), by End-User 2024 & 2032
- Figure 30: North America Biological Safety Cabinet Market Volume Share (%), by End-User 2024 & 2032
- Figure 31: North America Biological Safety Cabinet Market Revenue (Million), by Country 2024 & 2032
- Figure 32: North America Biological Safety Cabinet Market Volume (K Unit), by Country 2024 & 2032
- Figure 33: North America Biological Safety Cabinet Market Revenue Share (%), by Country 2024 & 2032
- Figure 34: North America Biological Safety Cabinet Market Volume Share (%), by Country 2024 & 2032
- Figure 35: Europe Biological Safety Cabinet Market Revenue (Million), by Type 2024 & 2032
- Figure 36: Europe Biological Safety Cabinet Market Volume (K Unit), by Type 2024 & 2032
- Figure 37: Europe Biological Safety Cabinet Market Revenue Share (%), by Type 2024 & 2032
- Figure 38: Europe Biological Safety Cabinet Market Volume Share (%), by Type 2024 & 2032
- Figure 39: Europe Biological Safety Cabinet Market Revenue (Million), by End-User 2024 & 2032
- Figure 40: Europe Biological Safety Cabinet Market Volume (K Unit), by End-User 2024 & 2032
- Figure 41: Europe Biological Safety Cabinet Market Revenue Share (%), by End-User 2024 & 2032
- Figure 42: Europe Biological Safety Cabinet Market Volume Share (%), by End-User 2024 & 2032
- Figure 43: Europe Biological Safety Cabinet Market Revenue (Million), by Country 2024 & 2032
- Figure 44: Europe Biological Safety Cabinet Market Volume (K Unit), by Country 2024 & 2032
- Figure 45: Europe Biological Safety Cabinet Market Revenue Share (%), by Country 2024 & 2032
- Figure 46: Europe Biological Safety Cabinet Market Volume Share (%), by Country 2024 & 2032
- Figure 47: Asia Pacific Biological Safety Cabinet Market Revenue (Million), by Type 2024 & 2032
- Figure 48: Asia Pacific Biological Safety Cabinet Market Volume (K Unit), by Type 2024 & 2032
- Figure 49: Asia Pacific Biological Safety Cabinet Market Revenue Share (%), by Type 2024 & 2032
- Figure 50: Asia Pacific Biological Safety Cabinet Market Volume Share (%), by Type 2024 & 2032
- Figure 51: Asia Pacific Biological Safety Cabinet Market Revenue (Million), by End-User 2024 & 2032
- Figure 52: Asia Pacific Biological Safety Cabinet Market Volume (K Unit), by End-User 2024 & 2032
- Figure 53: Asia Pacific Biological Safety Cabinet Market Revenue Share (%), by End-User 2024 & 2032
- Figure 54: Asia Pacific Biological Safety Cabinet Market Volume Share (%), by End-User 2024 & 2032
- Figure 55: Asia Pacific Biological Safety Cabinet Market Revenue (Million), by Country 2024 & 2032
- Figure 56: Asia Pacific Biological Safety Cabinet Market Volume (K Unit), by Country 2024 & 2032
- Figure 57: Asia Pacific Biological Safety Cabinet Market Revenue Share (%), by Country 2024 & 2032
- Figure 58: Asia Pacific Biological Safety Cabinet Market Volume Share (%), by Country 2024 & 2032
- Figure 59: Middle East and Africa Biological Safety Cabinet Market Revenue (Million), by Type 2024 & 2032
- Figure 60: Middle East and Africa Biological Safety Cabinet Market Volume (K Unit), by Type 2024 & 2032
- Figure 61: Middle East and Africa Biological Safety Cabinet Market Revenue Share (%), by Type 2024 & 2032
- Figure 62: Middle East and Africa Biological Safety Cabinet Market Volume Share (%), by Type 2024 & 2032
- Figure 63: Middle East and Africa Biological Safety Cabinet Market Revenue (Million), by End-User 2024 & 2032
- Figure 64: Middle East and Africa Biological Safety Cabinet Market Volume (K Unit), by End-User 2024 & 2032
- Figure 65: Middle East and Africa Biological Safety Cabinet Market Revenue Share (%), by End-User 2024 & 2032
- Figure 66: Middle East and Africa Biological Safety Cabinet Market Volume Share (%), by End-User 2024 & 2032
- Figure 67: Middle East and Africa Biological Safety Cabinet Market Revenue (Million), by Country 2024 & 2032
- Figure 68: Middle East and Africa Biological Safety Cabinet Market Volume (K Unit), by Country 2024 & 2032
- Figure 69: Middle East and Africa Biological Safety Cabinet Market Revenue Share (%), by Country 2024 & 2032
- Figure 70: Middle East and Africa Biological Safety Cabinet Market Volume Share (%), by Country 2024 & 2032
- Figure 71: South America Biological Safety Cabinet Market Revenue (Million), by Type 2024 & 2032
- Figure 72: South America Biological Safety Cabinet Market Volume (K Unit), by Type 2024 & 2032
- Figure 73: South America Biological Safety Cabinet Market Revenue Share (%), by Type 2024 & 2032
- Figure 74: South America Biological Safety Cabinet Market Volume Share (%), by Type 2024 & 2032
- Figure 75: South America Biological Safety Cabinet Market Revenue (Million), by End-User 2024 & 2032
- Figure 76: South America Biological Safety Cabinet Market Volume (K Unit), by End-User 2024 & 2032
- Figure 77: South America Biological Safety Cabinet Market Revenue Share (%), by End-User 2024 & 2032
- Figure 78: South America Biological Safety Cabinet Market Volume Share (%), by End-User 2024 & 2032
- Figure 79: South America Biological Safety Cabinet Market Revenue (Million), by Country 2024 & 2032
- Figure 80: South America Biological Safety Cabinet Market Volume (K Unit), by Country 2024 & 2032
- Figure 81: South America Biological Safety Cabinet Market Revenue Share (%), by Country 2024 & 2032
- Figure 82: South America Biological Safety Cabinet Market Volume Share (%), by Country 2024 & 2032
List of Tables
- Table 1: Global Biological Safety Cabinet Market Revenue Million Forecast, by Region 2019 & 2032
- Table 2: Global Biological Safety Cabinet Market Volume K Unit Forecast, by Region 2019 & 2032
- Table 3: Global Biological Safety Cabinet Market Revenue Million Forecast, by Type 2019 & 2032
- Table 4: Global Biological Safety Cabinet Market Volume K Unit Forecast, by Type 2019 & 2032
- Table 5: Global Biological Safety Cabinet Market Revenue Million Forecast, by End-User 2019 & 2032
- Table 6: Global Biological Safety Cabinet Market Volume K Unit Forecast, by End-User 2019 & 2032
- Table 7: Global Biological Safety Cabinet Market Revenue Million Forecast, by Region 2019 & 2032
- Table 8: Global Biological Safety Cabinet Market Volume K Unit Forecast, by Region 2019 & 2032
- Table 9: Global Biological Safety Cabinet Market Revenue Million Forecast, by Country 2019 & 2032
- Table 10: Global Biological Safety Cabinet Market Volume K Unit Forecast, by Country 2019 & 2032
- Table 11: United States Biological Safety Cabinet Market Revenue (Million) Forecast, by Application 2019 & 2032
- Table 12: United States Biological Safety Cabinet Market Volume (K Unit) Forecast, by Application 2019 & 2032
- Table 13: Canada Biological Safety Cabinet Market Revenue (Million) Forecast, by Application 2019 & 2032
- Table 14: Canada Biological Safety Cabinet Market Volume (K Unit) Forecast, by Application 2019 & 2032
- Table 15: Mexico Biological Safety Cabinet Market Revenue (Million) Forecast, by Application 2019 & 2032
- Table 16: Mexico Biological Safety Cabinet Market Volume (K Unit) Forecast, by Application 2019 & 2032
- Table 17: Global Biological Safety Cabinet Market Revenue Million Forecast, by Country 2019 & 2032
- Table 18: Global Biological Safety Cabinet Market Volume K Unit Forecast, by Country 2019 & 2032
- Table 19: Germany Biological Safety Cabinet Market Revenue (Million) Forecast, by Application 2019 & 2032
- Table 20: Germany Biological Safety Cabinet Market Volume (K Unit) Forecast, by Application 2019 & 2032
- Table 21: United Kingdom Biological Safety Cabinet Market Revenue (Million) Forecast, by Application 2019 & 2032
- Table 22: United Kingdom Biological Safety Cabinet Market Volume (K Unit) Forecast, by Application 2019 & 2032
- Table 23: France Biological Safety Cabinet Market Revenue (Million) Forecast, by Application 2019 & 2032
- Table 24: France Biological Safety Cabinet Market Volume (K Unit) Forecast, by Application 2019 & 2032
- Table 25: Italy Biological Safety Cabinet Market Revenue (Million) Forecast, by Application 2019 & 2032
- Table 26: Italy Biological Safety Cabinet Market Volume (K Unit) Forecast, by Application 2019 & 2032
- Table 27: Spain Biological Safety Cabinet Market Revenue (Million) Forecast, by Application 2019 & 2032
- Table 28: Spain Biological Safety Cabinet Market Volume (K Unit) Forecast, by Application 2019 & 2032
- Table 29: Rest of Europe Biological Safety Cabinet Market Revenue (Million) Forecast, by Application 2019 & 2032
- Table 30: Rest of Europe Biological Safety Cabinet Market Volume (K Unit) Forecast, by Application 2019 & 2032
- Table 31: Global Biological Safety Cabinet Market Revenue Million Forecast, by Country 2019 & 2032
- Table 32: Global Biological Safety Cabinet Market Volume K Unit Forecast, by Country 2019 & 2032
- Table 33: China Biological Safety Cabinet Market Revenue (Million) Forecast, by Application 2019 & 2032
- Table 34: China Biological Safety Cabinet Market Volume (K Unit) Forecast, by Application 2019 & 2032
- Table 35: Japan Biological Safety Cabinet Market Revenue (Million) Forecast, by Application 2019 & 2032
- Table 36: Japan Biological Safety Cabinet Market Volume (K Unit) Forecast, by Application 2019 & 2032
- Table 37: India Biological Safety Cabinet Market Revenue (Million) Forecast, by Application 2019 & 2032
- Table 38: India Biological Safety Cabinet Market Volume (K Unit) Forecast, by Application 2019 & 2032
- Table 39: Australia Biological Safety Cabinet Market Revenue (Million) Forecast, by Application 2019 & 2032
- Table 40: Australia Biological Safety Cabinet Market Volume (K Unit) Forecast, by Application 2019 & 2032
- Table 41: South Korea Biological Safety Cabinet Market Revenue (Million) Forecast, by Application 2019 & 2032
- Table 42: South Korea Biological Safety Cabinet Market Volume (K Unit) Forecast, by Application 2019 & 2032
- Table 43: Rest of Asia Pacific Biological Safety Cabinet Market Revenue (Million) Forecast, by Application 2019 & 2032
- Table 44: Rest of Asia Pacific Biological Safety Cabinet Market Volume (K Unit) Forecast, by Application 2019 & 2032
- Table 45: Global Biological Safety Cabinet Market Revenue Million Forecast, by Country 2019 & 2032
- Table 46: Global Biological Safety Cabinet Market Volume K Unit Forecast, by Country 2019 & 2032
- Table 47: GCC Biological Safety Cabinet Market Revenue (Million) Forecast, by Application 2019 & 2032
- Table 48: GCC Biological Safety Cabinet Market Volume (K Unit) Forecast, by Application 2019 & 2032
- Table 49: South Africa Biological Safety Cabinet Market Revenue (Million) Forecast, by Application 2019 & 2032
- Table 50: South Africa Biological Safety Cabinet Market Volume (K Unit) Forecast, by Application 2019 & 2032
- Table 51: Rest of Middle East and Africa Biological Safety Cabinet Market Revenue (Million) Forecast, by Application 2019 & 2032
- Table 52: Rest of Middle East and Africa Biological Safety Cabinet Market Volume (K Unit) Forecast, by Application 2019 & 2032
- Table 53: Global Biological Safety Cabinet Market Revenue Million Forecast, by Country 2019 & 2032
- Table 54: Global Biological Safety Cabinet Market Volume K Unit Forecast, by Country 2019 & 2032
- Table 55: Brazil Biological Safety Cabinet Market Revenue (Million) Forecast, by Application 2019 & 2032
- Table 56: Brazil Biological Safety Cabinet Market Volume (K Unit) Forecast, by Application 2019 & 2032
- Table 57: Argentina Biological Safety Cabinet Market Revenue (Million) Forecast, by Application 2019 & 2032
- Table 58: Argentina Biological Safety Cabinet Market Volume (K Unit) Forecast, by Application 2019 & 2032
- Table 59: Rest of South America Biological Safety Cabinet Market Revenue (Million) Forecast, by Application 2019 & 2032
- Table 60: Rest of South America Biological Safety Cabinet Market Volume (K Unit) Forecast, by Application 2019 & 2032
- Table 61: Global Biological Safety Cabinet Market Revenue Million Forecast, by Type 2019 & 2032
- Table 62: Global Biological Safety Cabinet Market Volume K Unit Forecast, by Type 2019 & 2032
- Table 63: Global Biological Safety Cabinet Market Revenue Million Forecast, by End-User 2019 & 2032
- Table 64: Global Biological Safety Cabinet Market Volume K Unit Forecast, by End-User 2019 & 2032
- Table 65: Global Biological Safety Cabinet Market Revenue Million Forecast, by Country 2019 & 2032
- Table 66: Global Biological Safety Cabinet Market Volume K Unit Forecast, by Country 2019 & 2032
- Table 67: United States Biological Safety Cabinet Market Revenue (Million) Forecast, by Application 2019 & 2032
- Table 68: United States Biological Safety Cabinet Market Volume (K Unit) Forecast, by Application 2019 & 2032
- Table 69: Canada Biological Safety Cabinet Market Revenue (Million) Forecast, by Application 2019 & 2032
- Table 70: Canada Biological Safety Cabinet Market Volume (K Unit) Forecast, by Application 2019 & 2032
- Table 71: Mexico Biological Safety Cabinet Market Revenue (Million) Forecast, by Application 2019 & 2032
- Table 72: Mexico Biological Safety Cabinet Market Volume (K Unit) Forecast, by Application 2019 & 2032
- Table 73: Global Biological Safety Cabinet Market Revenue Million Forecast, by Type 2019 & 2032
- Table 74: Global Biological Safety Cabinet Market Volume K Unit Forecast, by Type 2019 & 2032
- Table 75: Global Biological Safety Cabinet Market Revenue Million Forecast, by End-User 2019 & 2032
- Table 76: Global Biological Safety Cabinet Market Volume K Unit Forecast, by End-User 2019 & 2032
- Table 77: Global Biological Safety Cabinet Market Revenue Million Forecast, by Country 2019 & 2032
- Table 78: Global Biological Safety Cabinet Market Volume K Unit Forecast, by Country 2019 & 2032
- Table 79: Germany Biological Safety Cabinet Market Revenue (Million) Forecast, by Application 2019 & 2032
- Table 80: Germany Biological Safety Cabinet Market Volume (K Unit) Forecast, by Application 2019 & 2032
- Table 81: United Kingdom Biological Safety Cabinet Market Revenue (Million) Forecast, by Application 2019 & 2032
- Table 82: United Kingdom Biological Safety Cabinet Market Volume (K Unit) Forecast, by Application 2019 & 2032
- Table 83: France Biological Safety Cabinet Market Revenue (Million) Forecast, by Application 2019 & 2032
- Table 84: France Biological Safety Cabinet Market Volume (K Unit) Forecast, by Application 2019 & 2032
- Table 85: Italy Biological Safety Cabinet Market Revenue (Million) Forecast, by Application 2019 & 2032
- Table 86: Italy Biological Safety Cabinet Market Volume (K Unit) Forecast, by Application 2019 & 2032
- Table 87: Spain Biological Safety Cabinet Market Revenue (Million) Forecast, by Application 2019 & 2032
- Table 88: Spain Biological Safety Cabinet Market Volume (K Unit) Forecast, by Application 2019 & 2032
- Table 89: Rest of Europe Biological Safety Cabinet Market Revenue (Million) Forecast, by Application 2019 & 2032
- Table 90: Rest of Europe Biological Safety Cabinet Market Volume (K Unit) Forecast, by Application 2019 & 2032
- Table 91: Global Biological Safety Cabinet Market Revenue Million Forecast, by Type 2019 & 2032
- Table 92: Global Biological Safety Cabinet Market Volume K Unit Forecast, by Type 2019 & 2032
- Table 93: Global Biological Safety Cabinet Market Revenue Million Forecast, by End-User 2019 & 2032
- Table 94: Global Biological Safety Cabinet Market Volume K Unit Forecast, by End-User 2019 & 2032
- Table 95: Global Biological Safety Cabinet Market Revenue Million Forecast, by Country 2019 & 2032
- Table 96: Global Biological Safety Cabinet Market Volume K Unit Forecast, by Country 2019 & 2032
- Table 97: China Biological Safety Cabinet Market Revenue (Million) Forecast, by Application 2019 & 2032
- Table 98: China Biological Safety Cabinet Market Volume (K Unit) Forecast, by Application 2019 & 2032
- Table 99: Japan Biological Safety Cabinet Market Revenue (Million) Forecast, by Application 2019 & 2032
- Table 100: Japan Biological Safety Cabinet Market Volume (K Unit) Forecast, by Application 2019 & 2032
- Table 101: India Biological Safety Cabinet Market Revenue (Million) Forecast, by Application 2019 & 2032
- Table 102: India Biological Safety Cabinet Market Volume (K Unit) Forecast, by Application 2019 & 2032
- Table 103: Australia Biological Safety Cabinet Market Revenue (Million) Forecast, by Application 2019 & 2032
- Table 104: Australia Biological Safety Cabinet Market Volume (K Unit) Forecast, by Application 2019 & 2032
- Table 105: South Korea Biological Safety Cabinet Market Revenue (Million) Forecast, by Application 2019 & 2032
- Table 106: South Korea Biological Safety Cabinet Market Volume (K Unit) Forecast, by Application 2019 & 2032
- Table 107: Rest of Asia Pacific Biological Safety Cabinet Market Revenue (Million) Forecast, by Application 2019 & 2032
- Table 108: Rest of Asia Pacific Biological Safety Cabinet Market Volume (K Unit) Forecast, by Application 2019 & 2032
- Table 109: Global Biological Safety Cabinet Market Revenue Million Forecast, by Type 2019 & 2032
- Table 110: Global Biological Safety Cabinet Market Volume K Unit Forecast, by Type 2019 & 2032
- Table 111: Global Biological Safety Cabinet Market Revenue Million Forecast, by End-User 2019 & 2032
- Table 112: Global Biological Safety Cabinet Market Volume K Unit Forecast, by End-User 2019 & 2032
- Table 113: Global Biological Safety Cabinet Market Revenue Million Forecast, by Country 2019 & 2032
- Table 114: Global Biological Safety Cabinet Market Volume K Unit Forecast, by Country 2019 & 2032
- Table 115: GCC Biological Safety Cabinet Market Revenue (Million) Forecast, by Application 2019 & 2032
- Table 116: GCC Biological Safety Cabinet Market Volume (K Unit) Forecast, by Application 2019 & 2032
- Table 117: South Africa Biological Safety Cabinet Market Revenue (Million) Forecast, by Application 2019 & 2032
- Table 118: South Africa Biological Safety Cabinet Market Volume (K Unit) Forecast, by Application 2019 & 2032
- Table 119: Rest of Middle East and Africa Biological Safety Cabinet Market Revenue (Million) Forecast, by Application 2019 & 2032
- Table 120: Rest of Middle East and Africa Biological Safety Cabinet Market Volume (K Unit) Forecast, by Application 2019 & 2032
- Table 121: Global Biological Safety Cabinet Market Revenue Million Forecast, by Type 2019 & 2032
- Table 122: Global Biological Safety Cabinet Market Volume K Unit Forecast, by Type 2019 & 2032
- Table 123: Global Biological Safety Cabinet Market Revenue Million Forecast, by End-User 2019 & 2032
- Table 124: Global Biological Safety Cabinet Market Volume K Unit Forecast, by End-User 2019 & 2032
- Table 125: Global Biological Safety Cabinet Market Revenue Million Forecast, by Country 2019 & 2032
- Table 126: Global Biological Safety Cabinet Market Volume K Unit Forecast, by Country 2019 & 2032
- Table 127: Brazil Biological Safety Cabinet Market Revenue (Million) Forecast, by Application 2019 & 2032
- Table 128: Brazil Biological Safety Cabinet Market Volume (K Unit) Forecast, by Application 2019 & 2032
- Table 129: Argentina Biological Safety Cabinet Market Revenue (Million) Forecast, by Application 2019 & 2032
- Table 130: Argentina Biological Safety Cabinet Market Volume (K Unit) Forecast, by Application 2019 & 2032
- Table 131: Rest of South America Biological Safety Cabinet Market Revenue (Million) Forecast, by Application 2019 & 2032
- Table 132: Rest of South America Biological Safety Cabinet Market Volume (K Unit) Forecast, by Application 2019 & 2032
Frequently Asked Questions
1. What is the projected Compound Annual Growth Rate (CAGR) of the Biological Safety Cabinet Market?
The projected CAGR is approximately 8.20%.
2. Which companies are prominent players in the Biological Safety Cabinet Market?
Key companies in the market include NuAire, Air Science, Kewaunee Scientific, Germfree Laboratories, The Baker Company, Esco Micro, BIOBASE, Labconco, Thermo Fisher Scientific, Cruma.
3. What are the main segments of the Biological Safety Cabinet Market?
The market segments include Type, End-User.
4. Can you provide details about the market size?
The market size is estimated to be USD XX Million as of 2022.
5. What are some drivers contributing to market growth?
Increasing R&D Activities in Pharmaceutical and Biotechnology Industries; Increased Risk of Pandemics and Communicable Diseases; Rising Demand for Effective and Advance Technology-based Products.
6. What are the notable trends driving market growth?
Pharmaceutical and Biotechnology Segment is Expected to Hold a Major Market Share in the Biological Safety Cabinet Market.
7. Are there any restraints impacting market growth?
High Cost Associated with the Biological Safety Cabinets.
8. Can you provide examples of recent developments in the market?
In May 2021, Labconco has launched Purifier Axiom Biosafety Cabinet. The Axiom biosafety cabinets have upgraded the MyLogic OS operating system and enhanced their legendary safety features, such as Active Protection Protocol (APP) for the Axiom and Omni-Flex.
9. What pricing options are available for accessing the report?
Pricing options include single-user, multi-user, and enterprise licenses priced at USD 4750, USD 5250, and USD 8750 respectively.
10. Is the market size provided in terms of value or volume?
The market size is provided in terms of value, measured in Million and volume, measured in K Unit.
11. Are there any specific market keywords associated with the report?
Yes, the market keyword associated with the report is "Biological Safety Cabinet Market," which aids in identifying and referencing the specific market segment covered.
12. How do I determine which pricing option suits my needs best?
The pricing options vary based on user requirements and access needs. Individual users may opt for single-user licenses, while businesses requiring broader access may choose multi-user or enterprise licenses for cost-effective access to the report.
13. Are there any additional resources or data provided in the Biological Safety Cabinet Market report?
While the report offers comprehensive insights, it's advisable to review the specific contents or supplementary materials provided to ascertain if additional resources or data are available.
14. How can I stay updated on further developments or reports in the Biological Safety Cabinet Market?
To stay informed about further developments, trends, and reports in the Biological Safety Cabinet Market, consider subscribing to industry newsletters, following relevant companies and organizations, or regularly checking reputable industry news sources and publications.
Methodology
Step 1 - Identification of Relevant Samples Size from Population Database


Step 2 - Approaches for Defining Global Market Size (Value, Volume* & Price*)

Note*: In applicable scenarios
Step 3 - Data Sources
Primary Research
- Web Analytics
- Survey Reports
- Research Institute
- Latest Research Reports
- Opinion Leaders
Secondary Research
- Annual Reports
- White Paper
- Latest Press Release
- Industry Association
- Paid Database
- Investor Presentations

Step 4 - Data Triangulation
Involves using different sources of information in order to increase the validity of a study
These sources are likely to be stakeholders in a program - participants, other researchers, program staff, other community members, and so on.
Then we put all data in single framework & apply various statistical tools to find out the dynamic on the market.
During the analysis stage, feedback from the stakeholder groups would be compared to determine areas of agreement as well as areas of divergence


