
Key Insights
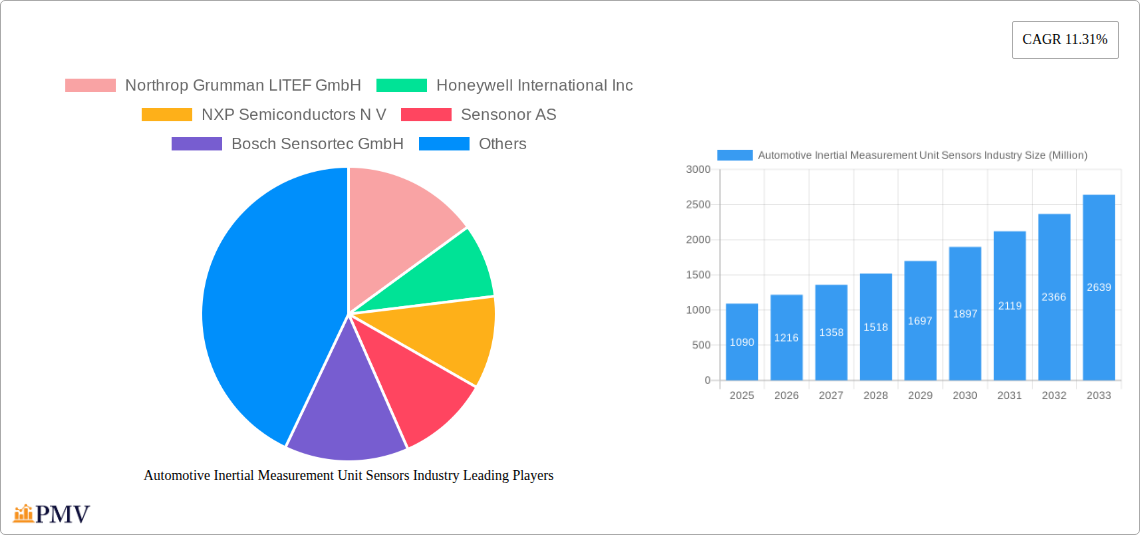
The Automotive Inertial Measurement Unit (IMU) Sensors market is experiencing robust growth, projected to reach $1.09 billion in 2025 and exhibiting a Compound Annual Growth Rate (CAGR) of 11.31% from 2025 to 2033. This expansion is fueled by several key factors. The increasing integration of advanced driver-assistance systems (ADAS) and autonomous driving technologies necessitates highly accurate and reliable IMU sensors for navigation, stability control, and collision avoidance. The rising demand for enhanced vehicle safety features, such as electronic stability control (ESC) and lane departure warning (LDW), further contributes to market growth. Furthermore, the automotive industry's ongoing trend towards lightweighting vehicles to improve fuel efficiency is driving demand for smaller, more energy-efficient IMU sensors. The market is segmented by end-user industry, with significant contributions from passenger cars, commercial vehicles, and electric vehicles. Competition is intense, with key players such as Bosch Sensortec, STMicroelectronics, and Analog Devices vying for market share through technological innovation and strategic partnerships. Geographic growth is expected to be robust across all regions, with North America and Asia Pacific representing significant market opportunities.
The market's continued growth is projected to be influenced by several factors. The development of more sophisticated and cost-effective IMU sensors incorporating MEMS (Microelectromechanical Systems) technology will drive adoption. Advancements in sensor fusion techniques, which combine data from multiple sensors to enhance accuracy and reliability, are also contributing to market expansion. However, challenges remain. High initial investment costs for advanced IMU sensor technology and the need for robust quality control and testing processes to ensure sensor reliability could act as potential restraints. Nevertheless, the long-term outlook remains positive given the increasing demand for advanced safety features and autonomous driving capabilities in vehicles worldwide. The increasing adoption of electric and hybrid vehicles will also positively impact the market.
Automotive Inertial Measurement Unit (IMU) Sensors Industry Market Report: 2019-2033
This comprehensive report provides a detailed analysis of the Automotive Inertial Measurement Unit (IMU) Sensors market, offering invaluable insights for industry stakeholders. Covering the period from 2019 to 2033, with a focus on 2025, this report meticulously examines market structure, competitive dynamics, technological advancements, and future growth potential. The report uses Million as the unit for all values.
Automotive Inertial Measurement Unit Sensors Industry Market Structure & Competitive Dynamics
The Automotive IMU sensor market is characterized by a moderately consolidated structure with several key players vying for market share. Market concentration is influenced by factors such as technological innovation, regulatory compliance, and the strategic acquisition of smaller companies. The industry witnesses continuous innovation, driven by the demand for higher accuracy, miniaturization, and improved power efficiency. Stringent automotive safety regulations play a crucial role in shaping the market landscape, favoring companies with robust quality control and certification processes. Product substitutes, such as GPS and other positioning technologies, exist but often lack the real-time precision and reliability of IMU sensors in dynamic environments. End-user trends, especially the increasing adoption of advanced driver-assistance systems (ADAS) and autonomous driving technologies, are significantly impacting market growth. The past five years have seen several M&A activities, with deal values averaging xx Million annually. Key players’ market share fluctuates but generally remains within the range of xx% for the top five players.
Key Players Market Share (Estimated 2025):
- Bosch Sensortec GmbH: xx%
- STMicroelectronics N V: xx%
- Analog Devices Inc: xx%
- Honeywell International Inc: xx%
- Others: xx%
Recent M&A Activity: While specific deal values are confidential, significant consolidation is observed within the industry, with larger players acquiring smaller specialized firms to expand their product portfolios and technological capabilities.
Automotive Inertial Measurement Unit Sensors Industry Industry Trends & Insights
The Automotive IMU sensor market is experiencing robust growth, driven primarily by the burgeoning demand for ADAS and autonomous vehicles. The increasing integration of IMU sensors in various automotive applications, such as electronic stability control (ESC), anti-lock braking systems (ABS), and advanced driver-assistance systems (ADAS), fuels market expansion. Technological disruptions, including the shift towards MEMS-based IMU sensors and the development of sensor fusion technologies, are shaping the industry landscape. Consumer preferences are increasingly geared towards enhanced safety features and improved driving experiences, further boosting market demand. The competitive dynamics are intensifying, with companies investing heavily in R&D to develop more sophisticated and cost-effective IMU sensors. The market is projected to achieve a Compound Annual Growth Rate (CAGR) of xx% during the forecast period (2025-2033), with market penetration increasing from xx% in 2025 to xx% by 2033. The increasing adoption of electric vehicles (EVs) also presents a substantial growth opportunity.

Dominant Markets & Segments in Automotive Inertial Measurement Unit Sensors Industry
The automotive segment dominates the IMU sensor market, driven by the high volume of sensor deployment in modern vehicles. Geographically, the market is concentrated in North America, Europe, and Asia-Pacific, reflecting the high penetration of automobiles and advanced driver-assistance systems (ADAS) in these regions.
- Key Drivers for Automotive Segment Dominance:
- Technological Advancements: Continuous innovation in MEMS technology leads to smaller, more efficient, and more precise IMU sensors.
- Safety Regulations: Stringent government regulations mandating the use of IMU sensors in safety-critical applications.
- ADAS and Autonomous Vehicle Development: Rapid growth in the ADAS and autonomous driving technologies significantly increases demand.
- Increased Vehicle Production: Rising global vehicle production directly impacts IMU sensor demand.
Dominant Region: North America and Europe currently hold the largest market share, due to the high adoption rate of advanced driver assistance systems (ADAS). However, Asia-Pacific is predicted to witness significant growth in the coming years, driven by increasing vehicle production and a growing demand for sophisticated safety features.
Automotive Inertial Measurement Unit Sensors Industry Product Innovations
Recent product innovations include the development of highly integrated IMU sensors with enhanced accuracy, improved temperature stability, and reduced power consumption. These advancements are driven by the growing need for reliable and precise positioning information in various automotive applications. Sensor fusion technology, combining IMU data with data from other sensors such as GPS and cameras, is gaining traction, enhancing overall system accuracy and reliability. The development of smaller form-factor sensors further facilitates integration into space-constrained automotive applications. The focus is shifting towards cost-effective solutions catering to a wider range of automotive segments, including non-safety-critical applications.
Report Segmentation & Scope
This report segments the Automotive IMU sensor market based on End-user Industry:
Consumer Electronics: This segment includes applications in smartphones, wearables, and gaming devices, which are showing moderate growth. Market size is estimated at xx Million in 2025.
Automotive: This is the dominant segment, with high growth expected due to the increasing adoption of ADAS and autonomous driving technologies. Market size is estimated at xx Million in 2025.
Medical: Growth in this segment is driven by the use of IMU sensors in medical devices and rehabilitation equipment. Market size is estimated at xx Million in 2025.
Aerospace & Defense: This segment exhibits steady growth driven by the demand for high-precision navigation systems. Market size is estimated at xx Million in 2025.
Industrial: This segment shows moderate growth, driven by applications in robotics and industrial automation. Market size is estimated at xx Million in 2025.
Others: This category includes various applications, showing a combined moderate growth rate. Market size is estimated at xx Million in 2025.
Key Drivers of Automotive Inertial Measurement Unit Sensors Industry Growth
Several factors fuel the growth of the Automotive IMU sensor market. Firstly, the rapid expansion of the ADAS and autonomous driving market is a significant driver. Secondly, stringent safety regulations globally mandate the inclusion of IMU sensors in vehicles, enhancing market demand. Thirdly, technological advancements, such as the development of MEMS-based IMU sensors, are leading to more cost-effective and efficient solutions. Fourthly, the increasing demand for enhanced vehicle stability and improved driving experiences contributes significantly to the market's expansion. Finally, the growing integration of IMU sensors in various automotive applications ensures sustained market growth.
Challenges in the Automotive Inertial Measurement Unit Sensors Industry Sector
The Automotive IMU sensor market faces challenges such as the high cost of development and manufacturing, particularly for high-precision sensors. The complexity of integrating IMU sensors with other automotive systems presents integration challenges. Supply chain disruptions can impact sensor availability and prices. Intense competition among major players necessitates continuous innovation and cost optimization. The need to meet stringent safety and quality standards adds to the operational cost and complexity. Finally, fluctuations in raw material prices can affect overall profitability.
Leading Players in the Automotive Inertial Measurement Unit Sensors Industry Market
- Northrop Grumman LITEF GmbH
- Honeywell International Inc
- NXP Semiconductors N V
- Sensonor AS
- Bosch Sensortec GmbH
- STMicroelectronics N V
- MEMSIC Inc
- Xsens Technologies B V
- Silicon Sensing Systems Limited
- TDK Corporation
- Murata Manufacturing Co Ltd
- Analog Devices Inc
Key Developments in Automotive Inertial Measurement Unit Sensors Industry Sector
- December 2021: TDK Corporation introduced the InvenSense IAM-20680HT high-temperature automotive monolithic 6-Axis Motion Tracking sensor platform solution for non-safety automotive applications.
- February 2022: SBG Systems announced the Pulse-40 MEMS-based Inertial Navigation Systems, offering unmatched performance in harsh conditions.
Strategic Automotive Inertial Measurement Unit Sensors Industry Market Outlook
The Automotive IMU sensor market is poised for continued strong growth, driven by the increasing adoption of ADAS and autonomous driving technologies. The market presents significant opportunities for companies specializing in high-precision, cost-effective, and energy-efficient IMU sensors. Strategic partnerships and collaborations among sensor manufacturers, automotive OEMs, and technology providers are expected to shape the industry landscape. Focus on sensor fusion and the development of innovative applications will drive future growth. The market is expected to witness substantial expansion, presenting lucrative investment opportunities for stakeholders.
Automotive Inertial Measurement Unit Sensors Industry Segmentation
-
1. End-user Industry
- 1.1. Consumer
- 1.2. Automotive
- 1.3. Medical
- 1.4. Aerospace & Defense
- 1.5. Industrial
- 1.6. Others End-user Industries
Automotive Inertial Measurement Unit Sensors Industry Segmentation By Geography
- 1. North America
- 2. Europe
- 3. Asia Pacific
- 4. Rest of the World

Automotive Inertial Measurement Unit Sensors Industry REPORT HIGHLIGHTS
| Aspects | Details |
|---|---|
| Study Period | 2019-2033 |
| Base Year | 2024 |
| Estimated Year | 2025 |
| Forecast Period | 2025-2033 |
| Historical Period | 2019-2024 |
| Growth Rate | CAGR of 11.31% from 2019-2033 |
| Segmentation |
|
Table of Contents
- 1. Introduction
- 1.1. Research Scope
- 1.2. Market Segmentation
- 1.3. Research Methodology
- 1.4. Definitions and Assumptions
- 2. Executive Summary
- 2.1. Introduction
- 3. Market Dynamics
- 3.1. Introduction
- 3.2. Market Drivers
- 3.2.1 Increasing Number of Emerging Applications (IoT Devices
- 3.2.2 Robotic Cars
- 3.2.3 etc.); Increasing Adoption of Low-cost MEMS-based IMUs
- 3.3. Market Restrains
- 3.3.1. Keeping Pace with the Changing Consumer Demand
- 3.4. Market Trends
- 3.4.1. Automotive Sector is to Hold Significant Market Share
- 4. Market Factor Analysis
- 4.1. Porters Five Forces
- 4.2. Supply/Value Chain
- 4.3. PESTEL analysis
- 4.4. Market Entropy
- 4.5. Patent/Trademark Analysis
- 5. Global Automotive Inertial Measurement Unit Sensors Industry Analysis, Insights and Forecast, 2019-2031
- 5.1. Market Analysis, Insights and Forecast - by End-user Industry
- 5.1.1. Consumer
- 5.1.2. Automotive
- 5.1.3. Medical
- 5.1.4. Aerospace & Defense
- 5.1.5. Industrial
- 5.1.6. Others End-user Industries
- 5.2. Market Analysis, Insights and Forecast - by Region
- 5.2.1. North America
- 5.2.2. Europe
- 5.2.3. Asia Pacific
- 5.2.4. Rest of the World
- 5.1. Market Analysis, Insights and Forecast - by End-user Industry
- 6. North America Automotive Inertial Measurement Unit Sensors Industry Analysis, Insights and Forecast, 2019-2031
- 6.1. Market Analysis, Insights and Forecast - by End-user Industry
- 6.1.1. Consumer
- 6.1.2. Automotive
- 6.1.3. Medical
- 6.1.4. Aerospace & Defense
- 6.1.5. Industrial
- 6.1.6. Others End-user Industries
- 6.1. Market Analysis, Insights and Forecast - by End-user Industry
- 7. Europe Automotive Inertial Measurement Unit Sensors Industry Analysis, Insights and Forecast, 2019-2031
- 7.1. Market Analysis, Insights and Forecast - by End-user Industry
- 7.1.1. Consumer
- 7.1.2. Automotive
- 7.1.3. Medical
- 7.1.4. Aerospace & Defense
- 7.1.5. Industrial
- 7.1.6. Others End-user Industries
- 7.1. Market Analysis, Insights and Forecast - by End-user Industry
- 8. Asia Pacific Automotive Inertial Measurement Unit Sensors Industry Analysis, Insights and Forecast, 2019-2031
- 8.1. Market Analysis, Insights and Forecast - by End-user Industry
- 8.1.1. Consumer
- 8.1.2. Automotive
- 8.1.3. Medical
- 8.1.4. Aerospace & Defense
- 8.1.5. Industrial
- 8.1.6. Others End-user Industries
- 8.1. Market Analysis, Insights and Forecast - by End-user Industry
- 9. Rest of the World Automotive Inertial Measurement Unit Sensors Industry Analysis, Insights and Forecast, 2019-2031
- 9.1. Market Analysis, Insights and Forecast - by End-user Industry
- 9.1.1. Consumer
- 9.1.2. Automotive
- 9.1.3. Medical
- 9.1.4. Aerospace & Defense
- 9.1.5. Industrial
- 9.1.6. Others End-user Industries
- 9.1. Market Analysis, Insights and Forecast - by End-user Industry
- 10. North America Automotive Inertial Measurement Unit Sensors Industry Analysis, Insights and Forecast, 2019-2031
- 10.1. Market Analysis, Insights and Forecast - By Country/Sub-region
- 10.1.1 United States
- 10.1.2 Canada
- 10.1.3 Mexico
- 11. Europe Automotive Inertial Measurement Unit Sensors Industry Analysis, Insights and Forecast, 2019-2031
- 11.1. Market Analysis, Insights and Forecast - By Country/Sub-region
- 11.1.1 Germany
- 11.1.2 United Kingdom
- 11.1.3 France
- 11.1.4 Spain
- 11.1.5 Italy
- 11.1.6 Spain
- 11.1.7 Belgium
- 11.1.8 Netherland
- 11.1.9 Nordics
- 11.1.10 Rest of Europe
- 12. Asia Pacific Automotive Inertial Measurement Unit Sensors Industry Analysis, Insights and Forecast, 2019-2031
- 12.1. Market Analysis, Insights and Forecast - By Country/Sub-region
- 12.1.1 China
- 12.1.2 Japan
- 12.1.3 India
- 12.1.4 South Korea
- 12.1.5 Southeast Asia
- 12.1.6 Australia
- 12.1.7 Indonesia
- 12.1.8 Phillipes
- 12.1.9 Singapore
- 12.1.10 Thailandc
- 12.1.11 Rest of Asia Pacific
- 13. South America Automotive Inertial Measurement Unit Sensors Industry Analysis, Insights and Forecast, 2019-2031
- 13.1. Market Analysis, Insights and Forecast - By Country/Sub-region
- 13.1.1 Brazil
- 13.1.2 Argentina
- 13.1.3 Peru
- 13.1.4 Chile
- 13.1.5 Colombia
- 13.1.6 Ecuador
- 13.1.7 Venezuela
- 13.1.8 Rest of South America
- 14. North America Automotive Inertial Measurement Unit Sensors Industry Analysis, Insights and Forecast, 2019-2031
- 14.1. Market Analysis, Insights and Forecast - By Country/Sub-region
- 14.1.1 United States
- 14.1.2 Canada
- 14.1.3 Mexico
- 15. MEA Automotive Inertial Measurement Unit Sensors Industry Analysis, Insights and Forecast, 2019-2031
- 15.1. Market Analysis, Insights and Forecast - By Country/Sub-region
- 15.1.1 United Arab Emirates
- 15.1.2 Saudi Arabia
- 15.1.3 South Africa
- 15.1.4 Rest of Middle East and Africa
- 16. Competitive Analysis
- 16.1. Global Market Share Analysis 2024
- 16.2. Company Profiles
- 16.2.1 Northrop Grumman LITEF GmbH
- 16.2.1.1. Overview
- 16.2.1.2. Products
- 16.2.1.3. SWOT Analysis
- 16.2.1.4. Recent Developments
- 16.2.1.5. Financials (Based on Availability)
- 16.2.2 Honeywell International Inc
- 16.2.2.1. Overview
- 16.2.2.2. Products
- 16.2.2.3. SWOT Analysis
- 16.2.2.4. Recent Developments
- 16.2.2.5. Financials (Based on Availability)
- 16.2.3 NXP Semiconductors N V
- 16.2.3.1. Overview
- 16.2.3.2. Products
- 16.2.3.3. SWOT Analysis
- 16.2.3.4. Recent Developments
- 16.2.3.5. Financials (Based on Availability)
- 16.2.4 Sensonor AS
- 16.2.4.1. Overview
- 16.2.4.2. Products
- 16.2.4.3. SWOT Analysis
- 16.2.4.4. Recent Developments
- 16.2.4.5. Financials (Based on Availability)
- 16.2.5 Bosch Sensortec GmbH
- 16.2.5.1. Overview
- 16.2.5.2. Products
- 16.2.5.3. SWOT Analysis
- 16.2.5.4. Recent Developments
- 16.2.5.5. Financials (Based on Availability)
- 16.2.6 STMicroelectronics N V
- 16.2.6.1. Overview
- 16.2.6.2. Products
- 16.2.6.3. SWOT Analysis
- 16.2.6.4. Recent Developments
- 16.2.6.5. Financials (Based on Availability)
- 16.2.7 MEMSIC Inc *List Not Exhaustive
- 16.2.7.1. Overview
- 16.2.7.2. Products
- 16.2.7.3. SWOT Analysis
- 16.2.7.4. Recent Developments
- 16.2.7.5. Financials (Based on Availability)
- 16.2.8 Xsens Technologies B V
- 16.2.8.1. Overview
- 16.2.8.2. Products
- 16.2.8.3. SWOT Analysis
- 16.2.8.4. Recent Developments
- 16.2.8.5. Financials (Based on Availability)
- 16.2.9 Silicon Sensing Systems Limited
- 16.2.9.1. Overview
- 16.2.9.2. Products
- 16.2.9.3. SWOT Analysis
- 16.2.9.4. Recent Developments
- 16.2.9.5. Financials (Based on Availability)
- 16.2.10 TDK Corporation
- 16.2.10.1. Overview
- 16.2.10.2. Products
- 16.2.10.3. SWOT Analysis
- 16.2.10.4. Recent Developments
- 16.2.10.5. Financials (Based on Availability)
- 16.2.11 Murata Manufacturing Co Ltd
- 16.2.11.1. Overview
- 16.2.11.2. Products
- 16.2.11.3. SWOT Analysis
- 16.2.11.4. Recent Developments
- 16.2.11.5. Financials (Based on Availability)
- 16.2.12 Analog Devices Inc
- 16.2.12.1. Overview
- 16.2.12.2. Products
- 16.2.12.3. SWOT Analysis
- 16.2.12.4. Recent Developments
- 16.2.12.5. Financials (Based on Availability)
- 16.2.1 Northrop Grumman LITEF GmbH
List of Figures
- Figure 1: Global Automotive Inertial Measurement Unit Sensors Industry Revenue Breakdown (Million, %) by Region 2024 & 2032
- Figure 2: North America Automotive Inertial Measurement Unit Sensors Industry Revenue (Million), by Country 2024 & 2032
- Figure 3: North America Automotive Inertial Measurement Unit Sensors Industry Revenue Share (%), by Country 2024 & 2032
- Figure 4: Europe Automotive Inertial Measurement Unit Sensors Industry Revenue (Million), by Country 2024 & 2032
- Figure 5: Europe Automotive Inertial Measurement Unit Sensors Industry Revenue Share (%), by Country 2024 & 2032
- Figure 6: Asia Pacific Automotive Inertial Measurement Unit Sensors Industry Revenue (Million), by Country 2024 & 2032
- Figure 7: Asia Pacific Automotive Inertial Measurement Unit Sensors Industry Revenue Share (%), by Country 2024 & 2032
- Figure 8: South America Automotive Inertial Measurement Unit Sensors Industry Revenue (Million), by Country 2024 & 2032
- Figure 9: South America Automotive Inertial Measurement Unit Sensors Industry Revenue Share (%), by Country 2024 & 2032
- Figure 10: North America Automotive Inertial Measurement Unit Sensors Industry Revenue (Million), by Country 2024 & 2032
- Figure 11: North America Automotive Inertial Measurement Unit Sensors Industry Revenue Share (%), by Country 2024 & 2032
- Figure 12: MEA Automotive Inertial Measurement Unit Sensors Industry Revenue (Million), by Country 2024 & 2032
- Figure 13: MEA Automotive Inertial Measurement Unit Sensors Industry Revenue Share (%), by Country 2024 & 2032
- Figure 14: North America Automotive Inertial Measurement Unit Sensors Industry Revenue (Million), by End-user Industry 2024 & 2032
- Figure 15: North America Automotive Inertial Measurement Unit Sensors Industry Revenue Share (%), by End-user Industry 2024 & 2032
- Figure 16: North America Automotive Inertial Measurement Unit Sensors Industry Revenue (Million), by Country 2024 & 2032
- Figure 17: North America Automotive Inertial Measurement Unit Sensors Industry Revenue Share (%), by Country 2024 & 2032
- Figure 18: Europe Automotive Inertial Measurement Unit Sensors Industry Revenue (Million), by End-user Industry 2024 & 2032
- Figure 19: Europe Automotive Inertial Measurement Unit Sensors Industry Revenue Share (%), by End-user Industry 2024 & 2032
- Figure 20: Europe Automotive Inertial Measurement Unit Sensors Industry Revenue (Million), by Country 2024 & 2032
- Figure 21: Europe Automotive Inertial Measurement Unit Sensors Industry Revenue Share (%), by Country 2024 & 2032
- Figure 22: Asia Pacific Automotive Inertial Measurement Unit Sensors Industry Revenue (Million), by End-user Industry 2024 & 2032
- Figure 23: Asia Pacific Automotive Inertial Measurement Unit Sensors Industry Revenue Share (%), by End-user Industry 2024 & 2032
- Figure 24: Asia Pacific Automotive Inertial Measurement Unit Sensors Industry Revenue (Million), by Country 2024 & 2032
- Figure 25: Asia Pacific Automotive Inertial Measurement Unit Sensors Industry Revenue Share (%), by Country 2024 & 2032
- Figure 26: Rest of the World Automotive Inertial Measurement Unit Sensors Industry Revenue (Million), by End-user Industry 2024 & 2032
- Figure 27: Rest of the World Automotive Inertial Measurement Unit Sensors Industry Revenue Share (%), by End-user Industry 2024 & 2032
- Figure 28: Rest of the World Automotive Inertial Measurement Unit Sensors Industry Revenue (Million), by Country 2024 & 2032
- Figure 29: Rest of the World Automotive Inertial Measurement Unit Sensors Industry Revenue Share (%), by Country 2024 & 2032
List of Tables
- Table 1: Global Automotive Inertial Measurement Unit Sensors Industry Revenue Million Forecast, by Region 2019 & 2032
- Table 2: Global Automotive Inertial Measurement Unit Sensors Industry Revenue Million Forecast, by End-user Industry 2019 & 2032
- Table 3: Global Automotive Inertial Measurement Unit Sensors Industry Revenue Million Forecast, by Region 2019 & 2032
- Table 4: Global Automotive Inertial Measurement Unit Sensors Industry Revenue Million Forecast, by Country 2019 & 2032
- Table 5: United States Automotive Inertial Measurement Unit Sensors Industry Revenue (Million) Forecast, by Application 2019 & 2032
- Table 6: Canada Automotive Inertial Measurement Unit Sensors Industry Revenue (Million) Forecast, by Application 2019 & 2032
- Table 7: Mexico Automotive Inertial Measurement Unit Sensors Industry Revenue (Million) Forecast, by Application 2019 & 2032
- Table 8: Global Automotive Inertial Measurement Unit Sensors Industry Revenue Million Forecast, by Country 2019 & 2032
- Table 9: Germany Automotive Inertial Measurement Unit Sensors Industry Revenue (Million) Forecast, by Application 2019 & 2032
- Table 10: United Kingdom Automotive Inertial Measurement Unit Sensors Industry Revenue (Million) Forecast, by Application 2019 & 2032
- Table 11: France Automotive Inertial Measurement Unit Sensors Industry Revenue (Million) Forecast, by Application 2019 & 2032
- Table 12: Spain Automotive Inertial Measurement Unit Sensors Industry Revenue (Million) Forecast, by Application 2019 & 2032
- Table 13: Italy Automotive Inertial Measurement Unit Sensors Industry Revenue (Million) Forecast, by Application 2019 & 2032
- Table 14: Spain Automotive Inertial Measurement Unit Sensors Industry Revenue (Million) Forecast, by Application 2019 & 2032
- Table 15: Belgium Automotive Inertial Measurement Unit Sensors Industry Revenue (Million) Forecast, by Application 2019 & 2032
- Table 16: Netherland Automotive Inertial Measurement Unit Sensors Industry Revenue (Million) Forecast, by Application 2019 & 2032
- Table 17: Nordics Automotive Inertial Measurement Unit Sensors Industry Revenue (Million) Forecast, by Application 2019 & 2032
- Table 18: Rest of Europe Automotive Inertial Measurement Unit Sensors Industry Revenue (Million) Forecast, by Application 2019 & 2032
- Table 19: Global Automotive Inertial Measurement Unit Sensors Industry Revenue Million Forecast, by Country 2019 & 2032
- Table 20: China Automotive Inertial Measurement Unit Sensors Industry Revenue (Million) Forecast, by Application 2019 & 2032
- Table 21: Japan Automotive Inertial Measurement Unit Sensors Industry Revenue (Million) Forecast, by Application 2019 & 2032
- Table 22: India Automotive Inertial Measurement Unit Sensors Industry Revenue (Million) Forecast, by Application 2019 & 2032
- Table 23: South Korea Automotive Inertial Measurement Unit Sensors Industry Revenue (Million) Forecast, by Application 2019 & 2032
- Table 24: Southeast Asia Automotive Inertial Measurement Unit Sensors Industry Revenue (Million) Forecast, by Application 2019 & 2032
- Table 25: Australia Automotive Inertial Measurement Unit Sensors Industry Revenue (Million) Forecast, by Application 2019 & 2032
- Table 26: Indonesia Automotive Inertial Measurement Unit Sensors Industry Revenue (Million) Forecast, by Application 2019 & 2032
- Table 27: Phillipes Automotive Inertial Measurement Unit Sensors Industry Revenue (Million) Forecast, by Application 2019 & 2032
- Table 28: Singapore Automotive Inertial Measurement Unit Sensors Industry Revenue (Million) Forecast, by Application 2019 & 2032
- Table 29: Thailandc Automotive Inertial Measurement Unit Sensors Industry Revenue (Million) Forecast, by Application 2019 & 2032
- Table 30: Rest of Asia Pacific Automotive Inertial Measurement Unit Sensors Industry Revenue (Million) Forecast, by Application 2019 & 2032
- Table 31: Global Automotive Inertial Measurement Unit Sensors Industry Revenue Million Forecast, by Country 2019 & 2032
- Table 32: Brazil Automotive Inertial Measurement Unit Sensors Industry Revenue (Million) Forecast, by Application 2019 & 2032
- Table 33: Argentina Automotive Inertial Measurement Unit Sensors Industry Revenue (Million) Forecast, by Application 2019 & 2032
- Table 34: Peru Automotive Inertial Measurement Unit Sensors Industry Revenue (Million) Forecast, by Application 2019 & 2032
- Table 35: Chile Automotive Inertial Measurement Unit Sensors Industry Revenue (Million) Forecast, by Application 2019 & 2032
- Table 36: Colombia Automotive Inertial Measurement Unit Sensors Industry Revenue (Million) Forecast, by Application 2019 & 2032
- Table 37: Ecuador Automotive Inertial Measurement Unit Sensors Industry Revenue (Million) Forecast, by Application 2019 & 2032
- Table 38: Venezuela Automotive Inertial Measurement Unit Sensors Industry Revenue (Million) Forecast, by Application 2019 & 2032
- Table 39: Rest of South America Automotive Inertial Measurement Unit Sensors Industry Revenue (Million) Forecast, by Application 2019 & 2032
- Table 40: Global Automotive Inertial Measurement Unit Sensors Industry Revenue Million Forecast, by Country 2019 & 2032
- Table 41: United States Automotive Inertial Measurement Unit Sensors Industry Revenue (Million) Forecast, by Application 2019 & 2032
- Table 42: Canada Automotive Inertial Measurement Unit Sensors Industry Revenue (Million) Forecast, by Application 2019 & 2032
- Table 43: Mexico Automotive Inertial Measurement Unit Sensors Industry Revenue (Million) Forecast, by Application 2019 & 2032
- Table 44: Global Automotive Inertial Measurement Unit Sensors Industry Revenue Million Forecast, by Country 2019 & 2032
- Table 45: United Arab Emirates Automotive Inertial Measurement Unit Sensors Industry Revenue (Million) Forecast, by Application 2019 & 2032
- Table 46: Saudi Arabia Automotive Inertial Measurement Unit Sensors Industry Revenue (Million) Forecast, by Application 2019 & 2032
- Table 47: South Africa Automotive Inertial Measurement Unit Sensors Industry Revenue (Million) Forecast, by Application 2019 & 2032
- Table 48: Rest of Middle East and Africa Automotive Inertial Measurement Unit Sensors Industry Revenue (Million) Forecast, by Application 2019 & 2032
- Table 49: Global Automotive Inertial Measurement Unit Sensors Industry Revenue Million Forecast, by End-user Industry 2019 & 2032
- Table 50: Global Automotive Inertial Measurement Unit Sensors Industry Revenue Million Forecast, by Country 2019 & 2032
- Table 51: Global Automotive Inertial Measurement Unit Sensors Industry Revenue Million Forecast, by End-user Industry 2019 & 2032
- Table 52: Global Automotive Inertial Measurement Unit Sensors Industry Revenue Million Forecast, by Country 2019 & 2032
- Table 53: Global Automotive Inertial Measurement Unit Sensors Industry Revenue Million Forecast, by End-user Industry 2019 & 2032
- Table 54: Global Automotive Inertial Measurement Unit Sensors Industry Revenue Million Forecast, by Country 2019 & 2032
- Table 55: Global Automotive Inertial Measurement Unit Sensors Industry Revenue Million Forecast, by End-user Industry 2019 & 2032
- Table 56: Global Automotive Inertial Measurement Unit Sensors Industry Revenue Million Forecast, by Country 2019 & 2032
Frequently Asked Questions
1. What is the projected Compound Annual Growth Rate (CAGR) of the Automotive Inertial Measurement Unit Sensors Industry?
The projected CAGR is approximately 11.31%.
2. Which companies are prominent players in the Automotive Inertial Measurement Unit Sensors Industry?
Key companies in the market include Northrop Grumman LITEF GmbH, Honeywell International Inc, NXP Semiconductors N V, Sensonor AS, Bosch Sensortec GmbH, STMicroelectronics N V, MEMSIC Inc *List Not Exhaustive, Xsens Technologies B V, Silicon Sensing Systems Limited, TDK Corporation, Murata Manufacturing Co Ltd, Analog Devices Inc.
3. What are the main segments of the Automotive Inertial Measurement Unit Sensors Industry?
The market segments include End-user Industry.
4. Can you provide details about the market size?
The market size is estimated to be USD 1.09 Million as of 2022.
5. What are some drivers contributing to market growth?
Increasing Number of Emerging Applications (IoT Devices. Robotic Cars. etc.); Increasing Adoption of Low-cost MEMS-based IMUs.
6. What are the notable trends driving market growth?
Automotive Sector is to Hold Significant Market Share.
7. Are there any restraints impacting market growth?
Keeping Pace with the Changing Consumer Demand.
8. Can you provide examples of recent developments in the market?
February 2022 - SBG Systems announced the Pulse-40 MEMS-based Inertial Navigation Systems. It offers unmatched performance in harsh conditions in a miniaturized size for applications where precision and robustness matter in all states.
9. What pricing options are available for accessing the report?
Pricing options include single-user, multi-user, and enterprise licenses priced at USD 4750, USD 5250, and USD 8750 respectively.
10. Is the market size provided in terms of value or volume?
The market size is provided in terms of value, measured in Million.
11. Are there any specific market keywords associated with the report?
Yes, the market keyword associated with the report is "Automotive Inertial Measurement Unit Sensors Industry," which aids in identifying and referencing the specific market segment covered.
12. How do I determine which pricing option suits my needs best?
The pricing options vary based on user requirements and access needs. Individual users may opt for single-user licenses, while businesses requiring broader access may choose multi-user or enterprise licenses for cost-effective access to the report.
13. Are there any additional resources or data provided in the Automotive Inertial Measurement Unit Sensors Industry report?
While the report offers comprehensive insights, it's advisable to review the specific contents or supplementary materials provided to ascertain if additional resources or data are available.
14. How can I stay updated on further developments or reports in the Automotive Inertial Measurement Unit Sensors Industry?
To stay informed about further developments, trends, and reports in the Automotive Inertial Measurement Unit Sensors Industry, consider subscribing to industry newsletters, following relevant companies and organizations, or regularly checking reputable industry news sources and publications.
Methodology
Step 1 - Identification of Relevant Samples Size from Population Database


Step 2 - Approaches for Defining Global Market Size (Value, Volume* & Price*)

Note*: In applicable scenarios
Step 3 - Data Sources
Primary Research
- Web Analytics
- Survey Reports
- Research Institute
- Latest Research Reports
- Opinion Leaders
Secondary Research
- Annual Reports
- White Paper
- Latest Press Release
- Industry Association
- Paid Database
- Investor Presentations

Step 4 - Data Triangulation
Involves using different sources of information in order to increase the validity of a study
These sources are likely to be stakeholders in a program - participants, other researchers, program staff, other community members, and so on.
Then we put all data in single framework & apply various statistical tools to find out the dynamic on the market.
During the analysis stage, feedback from the stakeholder groups would be compared to determine areas of agreement as well as areas of divergence


