
Key Insights
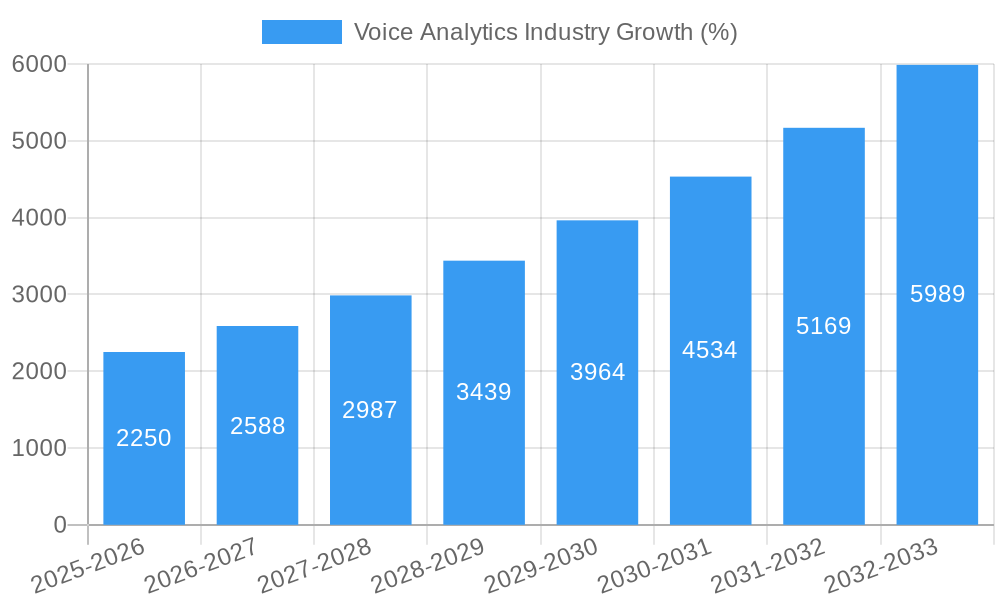
The global voice analytics market is experiencing robust growth, projected to reach a substantial size driven by the increasing adoption of cloud-based solutions and the expanding applications across various sectors. The market's Compound Annual Growth Rate (CAGR) of 15% from 2019-2033 indicates significant potential. Key drivers include the need for enhanced customer experience, improved operational efficiency, and the rising demand for data-driven insights in decision-making across industries. The healthcare, BFSI (Banking, Financial Services, and Insurance), and retail sectors are significant contributors, leveraging voice analytics for applications such as sentiment analysis to understand customer feedback, fraud detection to mitigate financial risks, and call monitoring for quality assurance. The solution segment currently dominates the market, offering a range of tools and platforms for voice data analysis, however, the services segment is experiencing rapid growth due to the increasing need for customized solutions and expert support in data interpretation and implementation. While cloud deployment is preferred for scalability and cost-effectiveness, on-premise solutions remain relevant for businesses with stringent data security requirements. Large enterprises lead in adoption, but the adoption rate among SMEs is also increasing, fueled by the availability of affordable and user-friendly solutions.
The market's growth trajectory is expected to remain strong throughout the forecast period (2025-2033), influenced by technological advancements like AI-powered natural language processing (NLP) which improves accuracy and efficiency of voice analysis. However, challenges remain, including data privacy concerns, the need for skilled professionals to interpret the data effectively, and the high initial investment required for implementation. Despite these, the continued proliferation of voice-enabled devices and the increasing volume of voice data generated daily are expected to fuel further expansion. The competitive landscape is dynamic, with established players and innovative startups vying for market share. Regional growth is uneven, with North America and Europe currently dominating, but Asia-Pacific is poised for significant growth in the coming years due to increasing digitization and rising adoption of advanced technologies.

Voice Analytics Industry Market Report: 2019-2033
This comprehensive report provides a detailed analysis of the Voice Analytics industry, offering invaluable insights for businesses, investors, and stakeholders. Covering the period 2019-2033, with a base year of 2025 and a forecast period of 2025-2033, this report unveils the market's structure, competitive landscape, and future trajectory. The global market size is estimated at xx Million in 2025 and is projected to reach xx Million by 2033, exhibiting a CAGR of xx%.
Voice Analytics Industry Market Structure & Competitive Dynamics
The Voice Analytics market is characterized by a moderately consolidated structure, with several key players holding significant market share. The industry's innovation ecosystem is dynamic, driven by advancements in artificial intelligence (AI), machine learning (ML), and natural language processing (NLP). Regulatory frameworks, varying by region, impact data privacy and security, shaping market dynamics. Product substitutes, such as traditional call recording and manual analysis, are increasingly challenged by the efficiency and insights offered by voice analytics solutions. End-user trends show a growing preference for cloud-based solutions and integrated platforms offering comprehensive functionalities. Mergers and acquisitions (M&A) activity has been notable, with deal values exceeding xx Million in recent years. Key examples include:
- Consolidation: Larger players are acquiring smaller companies to expand their product portfolio and market reach.
- Market Share: The top five players collectively hold approximately xx% of the market share in 2025.
- M&A Activity: The total value of M&A deals in the Voice Analytics sector between 2019 and 2024 was approximately xx Million.
Voice Analytics Industry Industry Trends & Insights
The Voice Analytics market is experiencing robust growth, fueled by several key factors. The increasing adoption of cloud-based solutions, driven by scalability and cost-effectiveness, is a major trend. Technological advancements in AI and ML are enhancing the accuracy and efficiency of voice analytics platforms, leading to improved insights. Consumer preference for personalized experiences is driving demand for voice analytics in various sectors, including customer service and marketing. The competitive landscape remains dynamic, with companies continuously innovating to differentiate their offerings. The market penetration of voice analytics is steadily increasing across various industries, with a notable surge in adoption among large enterprises.
Dominant Markets & Segments in Voice Analytics Industry
The North American region currently dominates the Voice Analytics market, driven by strong technological advancements and high adoption rates across various sectors. Within specific segments:
- Application: Sales & Marketing and Risk & Fraud Detection segments are experiencing the fastest growth, with projected market values of xx Million and xx Million respectively by 2033. This is due to the significant value proposition in improving customer experiences and mitigating financial risks.
- End-user Vertical: The BFSI (Banking, Financial Services, and Insurance) sector shows high growth potential, driven by the need for improved customer service and fraud detection. The Healthcare and Retail & E-commerce verticals also present significant opportunities.
- Component: The solution segment holds the largest market share due to the comprehensive functionality it provides.
- Deployment: Cloud deployment is gaining popularity, with approximately xx% of the market share in 2025.
- Organization Size: Large enterprises represent a significant portion of the market due to their substantial investment capacity and higher data volume needs.
Key Drivers:
- Technological advancements: AI, ML, and NLP are central to innovation.
- Economic growth: Increased investment in digital technologies fuels adoption.
- Robust regulatory frameworks: Data privacy regulations drive demand for secure solutions.
Voice Analytics Industry Product Innovations
Recent innovations in Voice Analytics focus on enhanced AI-powered features for sentiment analysis, real-time transcription, and advanced reporting capabilities. Companies are integrating these technologies into their platforms, creating seamless user experiences and providing comprehensive insights to businesses. The market is seeing a shift towards more affordable and accessible solutions, catering to a wider range of businesses.
Report Segmentation & Scope
This report segments the Voice Analytics market based on application (Health Monitoring, Sentiment Analysis, Sales & Marketing, Risk & Fraud Detection, Call monitoring), end-user vertical (Retail & E-commerce, Telecom & IT, BFSI, Healthcare, Government & Defence, Other End-user Verticals), component (Solution, Services), deployment (Cloud, On-premise), and organization size (Small and Medium-sized Enterprises, Large Enterprises). Each segment’s growth projections, market size estimations, and competitive dynamics are comprehensively analyzed. Growth rates vary across segments, reflecting differing adoption rates and market maturity levels.
Key Drivers of Voice Analytics Industry Growth
Several factors propel the growth of the Voice Analytics industry. Technological advancements in AI, ML, and NLP constantly improve the accuracy and efficiency of voice analysis. The increasing need for customer experience enhancement and improved operational efficiency across multiple sectors drives market demand. Government regulations regarding data privacy are shaping the market, pushing companies towards secure and compliant solutions.
Challenges in the Voice Analytics Industry Sector
The Voice Analytics sector faces challenges including data privacy concerns, high implementation costs, the need for skilled professionals, and the complexity of integrating these solutions with existing systems. Competitive pressures, including pricing wars and technological disruptions, further impact industry profitability. These factors cumulatively contribute to a slower growth rate compared to certain other technology sectors.
Leading Players in the Voice Analytics Industry Market
- Beyond Verbal
- Avaya
- VoiceSense Ltd
- SESTEK
- ThoughtSpot Inc
- Invoca Inc
- Talkdesk
- Verint Systems
- audEERING GmbH
- VoiceBase Inc
- RankMiner Inc
- Uniphore
Key Developments in Voice Analytics Industry Sector
- September 2022: Observe.AI launched Conversation Intelligence Consulting Services, enhancing contact center AI capabilities.
- June 2022: QuadraByte, LLC partnered with Vonage, integrating Voice API for improved calling experiences.
Strategic Voice Analytics Industry Market Outlook
The Voice Analytics market presents substantial growth potential, driven by continuous technological advancements and expanding adoption across various sectors. Strategic opportunities exist in developing advanced AI-powered solutions, focusing on specific industry verticals, and expanding into emerging markets. Companies focusing on data security and privacy compliance will gain a competitive advantage. The future holds promising prospects for innovative solutions catering to personalized customer experiences and improved operational efficiency.
Voice Analytics Industry Segmentation
-
1. Component
- 1.1. Solution
- 1.2. Services
-
2. Deployment
- 2.1. Cloud
- 2.2. On-premise
-
3. Organization Size
- 3.1. Small and Medium-sized Enterprises
- 3.2. Large Enterprises
-
4. Application
- 4.1. Health Monitoring
- 4.2. Sentiment Analysis
- 4.3. Sales & Marketing
- 4.4. Risk & Fraud Detection
- 4.5. Call monitoring
-
5. End-user Vertical
- 5.1. Retail & E-commerce
- 5.2. Telecom & IT
- 5.3. BFSI
- 5.4. Healthcare
- 5.5. Government & Defence
- 5.6. Other End-user Verticals
Voice Analytics Industry Segmentation By Geography
-
1. North America
- 1.1. United States
- 1.2. Canada
-
2. Europe
- 2.1. Germany
- 2.2. United Kingdom
- 2.3. France
- 2.4. Rest of Europe
-
3. Asia Pacific
- 3.1. India
- 3.2. China
- 3.3. Japan
- 3.4. Rest of Asia Pacific
-
4. Latin America
- 4.1. Brazil
- 4.2. Argentina
- 4.3. Rest of Latin America
-
5. Middle East and Africa
- 5.1. United Arab Emirates
- 5.2. Saudi Arabia
- 5.3. Rest of Middle East and Africa

Voice Analytics Industry REPORT HIGHLIGHTS
| Aspects | Details |
|---|---|
| Study Period | 2019-2033 |
| Base Year | 2024 |
| Estimated Year | 2025 |
| Forecast Period | 2025-2033 |
| Historical Period | 2019-2024 |
| Growth Rate | CAGR of 15.00% from 2019-2033 |
| Segmentation |
|
Table of Contents
- 1. Introduction
- 1.1. Research Scope
- 1.2. Market Segmentation
- 1.3. Research Methodology
- 1.4. Definitions and Assumptions
- 2. Executive Summary
- 2.1. Introduction
- 3. Market Dynamics
- 3.1. Introduction
- 3.2. Market Drivers
- 3.2.1. Increasing Investments in Optical Fiber Communication Infrastructure
- 3.3. Market Restrains
- 3.3.1. Instant Loss of Liquidity
- 3.4. Market Trends
- 3.4.1. Applications driving the growth of the market
- 4. Market Factor Analysis
- 4.1. Porters Five Forces
- 4.2. Supply/Value Chain
- 4.3. PESTEL analysis
- 4.4. Market Entropy
- 4.5. Patent/Trademark Analysis
- 5. Global Voice Analytics Industry Analysis, Insights and Forecast, 2019-2031
- 5.1. Market Analysis, Insights and Forecast - by Component
- 5.1.1. Solution
- 5.1.2. Services
- 5.2. Market Analysis, Insights and Forecast - by Deployment
- 5.2.1. Cloud
- 5.2.2. On-premise
- 5.3. Market Analysis, Insights and Forecast - by Organization Size
- 5.3.1. Small and Medium-sized Enterprises
- 5.3.2. Large Enterprises
- 5.4. Market Analysis, Insights and Forecast - by Application
- 5.4.1. Health Monitoring
- 5.4.2. Sentiment Analysis
- 5.4.3. Sales & Marketing
- 5.4.4. Risk & Fraud Detection
- 5.4.5. Call monitoring
- 5.5. Market Analysis, Insights and Forecast - by End-user Vertical
- 5.5.1. Retail & E-commerce
- 5.5.2. Telecom & IT
- 5.5.3. BFSI
- 5.5.4. Healthcare
- 5.5.5. Government & Defence
- 5.5.6. Other End-user Verticals
- 5.6. Market Analysis, Insights and Forecast - by Region
- 5.6.1. North America
- 5.6.2. Europe
- 5.6.3. Asia Pacific
- 5.6.4. Latin America
- 5.6.5. Middle East and Africa
- 5.1. Market Analysis, Insights and Forecast - by Component
- 6. North America Voice Analytics Industry Analysis, Insights and Forecast, 2019-2031
- 6.1. Market Analysis, Insights and Forecast - by Component
- 6.1.1. Solution
- 6.1.2. Services
- 6.2. Market Analysis, Insights and Forecast - by Deployment
- 6.2.1. Cloud
- 6.2.2. On-premise
- 6.3. Market Analysis, Insights and Forecast - by Organization Size
- 6.3.1. Small and Medium-sized Enterprises
- 6.3.2. Large Enterprises
- 6.4. Market Analysis, Insights and Forecast - by Application
- 6.4.1. Health Monitoring
- 6.4.2. Sentiment Analysis
- 6.4.3. Sales & Marketing
- 6.4.4. Risk & Fraud Detection
- 6.4.5. Call monitoring
- 6.5. Market Analysis, Insights and Forecast - by End-user Vertical
- 6.5.1. Retail & E-commerce
- 6.5.2. Telecom & IT
- 6.5.3. BFSI
- 6.5.4. Healthcare
- 6.5.5. Government & Defence
- 6.5.6. Other End-user Verticals
- 6.1. Market Analysis, Insights and Forecast - by Component
- 7. Europe Voice Analytics Industry Analysis, Insights and Forecast, 2019-2031
- 7.1. Market Analysis, Insights and Forecast - by Component
- 7.1.1. Solution
- 7.1.2. Services
- 7.2. Market Analysis, Insights and Forecast - by Deployment
- 7.2.1. Cloud
- 7.2.2. On-premise
- 7.3. Market Analysis, Insights and Forecast - by Organization Size
- 7.3.1. Small and Medium-sized Enterprises
- 7.3.2. Large Enterprises
- 7.4. Market Analysis, Insights and Forecast - by Application
- 7.4.1. Health Monitoring
- 7.4.2. Sentiment Analysis
- 7.4.3. Sales & Marketing
- 7.4.4. Risk & Fraud Detection
- 7.4.5. Call monitoring
- 7.5. Market Analysis, Insights and Forecast - by End-user Vertical
- 7.5.1. Retail & E-commerce
- 7.5.2. Telecom & IT
- 7.5.3. BFSI
- 7.5.4. Healthcare
- 7.5.5. Government & Defence
- 7.5.6. Other End-user Verticals
- 7.1. Market Analysis, Insights and Forecast - by Component
- 8. Asia Pacific Voice Analytics Industry Analysis, Insights and Forecast, 2019-2031
- 8.1. Market Analysis, Insights and Forecast - by Component
- 8.1.1. Solution
- 8.1.2. Services
- 8.2. Market Analysis, Insights and Forecast - by Deployment
- 8.2.1. Cloud
- 8.2.2. On-premise
- 8.3. Market Analysis, Insights and Forecast - by Organization Size
- 8.3.1. Small and Medium-sized Enterprises
- 8.3.2. Large Enterprises
- 8.4. Market Analysis, Insights and Forecast - by Application
- 8.4.1. Health Monitoring
- 8.4.2. Sentiment Analysis
- 8.4.3. Sales & Marketing
- 8.4.4. Risk & Fraud Detection
- 8.4.5. Call monitoring
- 8.5. Market Analysis, Insights and Forecast - by End-user Vertical
- 8.5.1. Retail & E-commerce
- 8.5.2. Telecom & IT
- 8.5.3. BFSI
- 8.5.4. Healthcare
- 8.5.5. Government & Defence
- 8.5.6. Other End-user Verticals
- 8.1. Market Analysis, Insights and Forecast - by Component
- 9. Latin America Voice Analytics Industry Analysis, Insights and Forecast, 2019-2031
- 9.1. Market Analysis, Insights and Forecast - by Component
- 9.1.1. Solution
- 9.1.2. Services
- 9.2. Market Analysis, Insights and Forecast - by Deployment
- 9.2.1. Cloud
- 9.2.2. On-premise
- 9.3. Market Analysis, Insights and Forecast - by Organization Size
- 9.3.1. Small and Medium-sized Enterprises
- 9.3.2. Large Enterprises
- 9.4. Market Analysis, Insights and Forecast - by Application
- 9.4.1. Health Monitoring
- 9.4.2. Sentiment Analysis
- 9.4.3. Sales & Marketing
- 9.4.4. Risk & Fraud Detection
- 9.4.5. Call monitoring
- 9.5. Market Analysis, Insights and Forecast - by End-user Vertical
- 9.5.1. Retail & E-commerce
- 9.5.2. Telecom & IT
- 9.5.3. BFSI
- 9.5.4. Healthcare
- 9.5.5. Government & Defence
- 9.5.6. Other End-user Verticals
- 9.1. Market Analysis, Insights and Forecast - by Component
- 10. Middle East and Africa Voice Analytics Industry Analysis, Insights and Forecast, 2019-2031
- 10.1. Market Analysis, Insights and Forecast - by Component
- 10.1.1. Solution
- 10.1.2. Services
- 10.2. Market Analysis, Insights and Forecast - by Deployment
- 10.2.1. Cloud
- 10.2.2. On-premise
- 10.3. Market Analysis, Insights and Forecast - by Organization Size
- 10.3.1. Small and Medium-sized Enterprises
- 10.3.2. Large Enterprises
- 10.4. Market Analysis, Insights and Forecast - by Application
- 10.4.1. Health Monitoring
- 10.4.2. Sentiment Analysis
- 10.4.3. Sales & Marketing
- 10.4.4. Risk & Fraud Detection
- 10.4.5. Call monitoring
- 10.5. Market Analysis, Insights and Forecast - by End-user Vertical
- 10.5.1. Retail & E-commerce
- 10.5.2. Telecom & IT
- 10.5.3. BFSI
- 10.5.4. Healthcare
- 10.5.5. Government & Defence
- 10.5.6. Other End-user Verticals
- 10.1. Market Analysis, Insights and Forecast - by Component
- 11. North America Voice Analytics Industry Analysis, Insights and Forecast, 2019-2031
- 11.1. Market Analysis, Insights and Forecast - By Country/Sub-region
- 11.1.1 United States
- 11.1.2 Canada
- 12. Europe Voice Analytics Industry Analysis, Insights and Forecast, 2019-2031
- 12.1. Market Analysis, Insights and Forecast - By Country/Sub-region
- 12.1.1 Germany
- 12.1.2 United Kingdom
- 12.1.3 France
- 12.1.4 Rest of Europe
- 13. Asia Pacific Voice Analytics Industry Analysis, Insights and Forecast, 2019-2031
- 13.1. Market Analysis, Insights and Forecast - By Country/Sub-region
- 13.1.1 India
- 13.1.2 China
- 13.1.3 Japan
- 13.1.4 Rest of Asia Pacific
- 14. Latin America Voice Analytics Industry Analysis, Insights and Forecast, 2019-2031
- 14.1. Market Analysis, Insights and Forecast - By Country/Sub-region
- 14.1.1 Brazil
- 14.1.2 Argentina
- 14.1.3 Rest of Latin America
- 15. Middle East and Africa Voice Analytics Industry Analysis, Insights and Forecast, 2019-2031
- 15.1. Market Analysis, Insights and Forecast - By Country/Sub-region
- 15.1.1 United Arab Emirates
- 15.1.2 Saudi Arabia
- 15.1.3 Rest of Middle East and Africa
- 16. Competitive Analysis
- 16.1. Global Market Share Analysis 2024
- 16.2. Company Profiles
- 16.2.1 Beyond Verbal
- 16.2.1.1. Overview
- 16.2.1.2. Products
- 16.2.1.3. SWOT Analysis
- 16.2.1.4. Recent Developments
- 16.2.1.5. Financials (Based on Availability)
- 16.2.2 Avaya
- 16.2.2.1. Overview
- 16.2.2.2. Products
- 16.2.2.3. SWOT Analysis
- 16.2.2.4. Recent Developments
- 16.2.2.5. Financials (Based on Availability)
- 16.2.3 VoiceSense Ltd
- 16.2.3.1. Overview
- 16.2.3.2. Products
- 16.2.3.3. SWOT Analysis
- 16.2.3.4. Recent Developments
- 16.2.3.5. Financials (Based on Availability)
- 16.2.4 SESTEK
- 16.2.4.1. Overview
- 16.2.4.2. Products
- 16.2.4.3. SWOT Analysis
- 16.2.4.4. Recent Developments
- 16.2.4.5. Financials (Based on Availability)
- 16.2.5 ThoughtSpot Inc
- 16.2.5.1. Overview
- 16.2.5.2. Products
- 16.2.5.3. SWOT Analysis
- 16.2.5.4. Recent Developments
- 16.2.5.5. Financials (Based on Availability)
- 16.2.6 Invoca Inc *List Not Exhaustive
- 16.2.6.1. Overview
- 16.2.6.2. Products
- 16.2.6.3. SWOT Analysis
- 16.2.6.4. Recent Developments
- 16.2.6.5. Financials (Based on Availability)
- 16.2.7 Talkdesk
- 16.2.7.1. Overview
- 16.2.7.2. Products
- 16.2.7.3. SWOT Analysis
- 16.2.7.4. Recent Developments
- 16.2.7.5. Financials (Based on Availability)
- 16.2.8 Verint Systems
- 16.2.8.1. Overview
- 16.2.8.2. Products
- 16.2.8.3. SWOT Analysis
- 16.2.8.4. Recent Developments
- 16.2.8.5. Financials (Based on Availability)
- 16.2.9 audEERING GmbH
- 16.2.9.1. Overview
- 16.2.9.2. Products
- 16.2.9.3. SWOT Analysis
- 16.2.9.4. Recent Developments
- 16.2.9.5. Financials (Based on Availability)
- 16.2.10 VoiceBase Inc
- 16.2.10.1. Overview
- 16.2.10.2. Products
- 16.2.10.3. SWOT Analysis
- 16.2.10.4. Recent Developments
- 16.2.10.5. Financials (Based on Availability)
- 16.2.11 RankMiner Inc
- 16.2.11.1. Overview
- 16.2.11.2. Products
- 16.2.11.3. SWOT Analysis
- 16.2.11.4. Recent Developments
- 16.2.11.5. Financials (Based on Availability)
- 16.2.12 Uniphore
- 16.2.12.1. Overview
- 16.2.12.2. Products
- 16.2.12.3. SWOT Analysis
- 16.2.12.4. Recent Developments
- 16.2.12.5. Financials (Based on Availability)
- 16.2.1 Beyond Verbal
List of Figures
- Figure 1: Global Voice Analytics Industry Revenue Breakdown (Million, %) by Region 2024 & 2032
- Figure 2: North America Voice Analytics Industry Revenue (Million), by Country 2024 & 2032
- Figure 3: North America Voice Analytics Industry Revenue Share (%), by Country 2024 & 2032
- Figure 4: Europe Voice Analytics Industry Revenue (Million), by Country 2024 & 2032
- Figure 5: Europe Voice Analytics Industry Revenue Share (%), by Country 2024 & 2032
- Figure 6: Asia Pacific Voice Analytics Industry Revenue (Million), by Country 2024 & 2032
- Figure 7: Asia Pacific Voice Analytics Industry Revenue Share (%), by Country 2024 & 2032
- Figure 8: Latin America Voice Analytics Industry Revenue (Million), by Country 2024 & 2032
- Figure 9: Latin America Voice Analytics Industry Revenue Share (%), by Country 2024 & 2032
- Figure 10: Middle East and Africa Voice Analytics Industry Revenue (Million), by Country 2024 & 2032
- Figure 11: Middle East and Africa Voice Analytics Industry Revenue Share (%), by Country 2024 & 2032
- Figure 12: North America Voice Analytics Industry Revenue (Million), by Component 2024 & 2032
- Figure 13: North America Voice Analytics Industry Revenue Share (%), by Component 2024 & 2032
- Figure 14: North America Voice Analytics Industry Revenue (Million), by Deployment 2024 & 2032
- Figure 15: North America Voice Analytics Industry Revenue Share (%), by Deployment 2024 & 2032
- Figure 16: North America Voice Analytics Industry Revenue (Million), by Organization Size 2024 & 2032
- Figure 17: North America Voice Analytics Industry Revenue Share (%), by Organization Size 2024 & 2032
- Figure 18: North America Voice Analytics Industry Revenue (Million), by Application 2024 & 2032
- Figure 19: North America Voice Analytics Industry Revenue Share (%), by Application 2024 & 2032
- Figure 20: North America Voice Analytics Industry Revenue (Million), by End-user Vertical 2024 & 2032
- Figure 21: North America Voice Analytics Industry Revenue Share (%), by End-user Vertical 2024 & 2032
- Figure 22: North America Voice Analytics Industry Revenue (Million), by Country 2024 & 2032
- Figure 23: North America Voice Analytics Industry Revenue Share (%), by Country 2024 & 2032
- Figure 24: Europe Voice Analytics Industry Revenue (Million), by Component 2024 & 2032
- Figure 25: Europe Voice Analytics Industry Revenue Share (%), by Component 2024 & 2032
- Figure 26: Europe Voice Analytics Industry Revenue (Million), by Deployment 2024 & 2032
- Figure 27: Europe Voice Analytics Industry Revenue Share (%), by Deployment 2024 & 2032
- Figure 28: Europe Voice Analytics Industry Revenue (Million), by Organization Size 2024 & 2032
- Figure 29: Europe Voice Analytics Industry Revenue Share (%), by Organization Size 2024 & 2032
- Figure 30: Europe Voice Analytics Industry Revenue (Million), by Application 2024 & 2032
- Figure 31: Europe Voice Analytics Industry Revenue Share (%), by Application 2024 & 2032
- Figure 32: Europe Voice Analytics Industry Revenue (Million), by End-user Vertical 2024 & 2032
- Figure 33: Europe Voice Analytics Industry Revenue Share (%), by End-user Vertical 2024 & 2032
- Figure 34: Europe Voice Analytics Industry Revenue (Million), by Country 2024 & 2032
- Figure 35: Europe Voice Analytics Industry Revenue Share (%), by Country 2024 & 2032
- Figure 36: Asia Pacific Voice Analytics Industry Revenue (Million), by Component 2024 & 2032
- Figure 37: Asia Pacific Voice Analytics Industry Revenue Share (%), by Component 2024 & 2032
- Figure 38: Asia Pacific Voice Analytics Industry Revenue (Million), by Deployment 2024 & 2032
- Figure 39: Asia Pacific Voice Analytics Industry Revenue Share (%), by Deployment 2024 & 2032
- Figure 40: Asia Pacific Voice Analytics Industry Revenue (Million), by Organization Size 2024 & 2032
- Figure 41: Asia Pacific Voice Analytics Industry Revenue Share (%), by Organization Size 2024 & 2032
- Figure 42: Asia Pacific Voice Analytics Industry Revenue (Million), by Application 2024 & 2032
- Figure 43: Asia Pacific Voice Analytics Industry Revenue Share (%), by Application 2024 & 2032
- Figure 44: Asia Pacific Voice Analytics Industry Revenue (Million), by End-user Vertical 2024 & 2032
- Figure 45: Asia Pacific Voice Analytics Industry Revenue Share (%), by End-user Vertical 2024 & 2032
- Figure 46: Asia Pacific Voice Analytics Industry Revenue (Million), by Country 2024 & 2032
- Figure 47: Asia Pacific Voice Analytics Industry Revenue Share (%), by Country 2024 & 2032
- Figure 48: Latin America Voice Analytics Industry Revenue (Million), by Component 2024 & 2032
- Figure 49: Latin America Voice Analytics Industry Revenue Share (%), by Component 2024 & 2032
- Figure 50: Latin America Voice Analytics Industry Revenue (Million), by Deployment 2024 & 2032
- Figure 51: Latin America Voice Analytics Industry Revenue Share (%), by Deployment 2024 & 2032
- Figure 52: Latin America Voice Analytics Industry Revenue (Million), by Organization Size 2024 & 2032
- Figure 53: Latin America Voice Analytics Industry Revenue Share (%), by Organization Size 2024 & 2032
- Figure 54: Latin America Voice Analytics Industry Revenue (Million), by Application 2024 & 2032
- Figure 55: Latin America Voice Analytics Industry Revenue Share (%), by Application 2024 & 2032
- Figure 56: Latin America Voice Analytics Industry Revenue (Million), by End-user Vertical 2024 & 2032
- Figure 57: Latin America Voice Analytics Industry Revenue Share (%), by End-user Vertical 2024 & 2032
- Figure 58: Latin America Voice Analytics Industry Revenue (Million), by Country 2024 & 2032
- Figure 59: Latin America Voice Analytics Industry Revenue Share (%), by Country 2024 & 2032
- Figure 60: Middle East and Africa Voice Analytics Industry Revenue (Million), by Component 2024 & 2032
- Figure 61: Middle East and Africa Voice Analytics Industry Revenue Share (%), by Component 2024 & 2032
- Figure 62: Middle East and Africa Voice Analytics Industry Revenue (Million), by Deployment 2024 & 2032
- Figure 63: Middle East and Africa Voice Analytics Industry Revenue Share (%), by Deployment 2024 & 2032
- Figure 64: Middle East and Africa Voice Analytics Industry Revenue (Million), by Organization Size 2024 & 2032
- Figure 65: Middle East and Africa Voice Analytics Industry Revenue Share (%), by Organization Size 2024 & 2032
- Figure 66: Middle East and Africa Voice Analytics Industry Revenue (Million), by Application 2024 & 2032
- Figure 67: Middle East and Africa Voice Analytics Industry Revenue Share (%), by Application 2024 & 2032
- Figure 68: Middle East and Africa Voice Analytics Industry Revenue (Million), by End-user Vertical 2024 & 2032
- Figure 69: Middle East and Africa Voice Analytics Industry Revenue Share (%), by End-user Vertical 2024 & 2032
- Figure 70: Middle East and Africa Voice Analytics Industry Revenue (Million), by Country 2024 & 2032
- Figure 71: Middle East and Africa Voice Analytics Industry Revenue Share (%), by Country 2024 & 2032
List of Tables
- Table 1: Global Voice Analytics Industry Revenue Million Forecast, by Region 2019 & 2032
- Table 2: Global Voice Analytics Industry Revenue Million Forecast, by Component 2019 & 2032
- Table 3: Global Voice Analytics Industry Revenue Million Forecast, by Deployment 2019 & 2032
- Table 4: Global Voice Analytics Industry Revenue Million Forecast, by Organization Size 2019 & 2032
- Table 5: Global Voice Analytics Industry Revenue Million Forecast, by Application 2019 & 2032
- Table 6: Global Voice Analytics Industry Revenue Million Forecast, by End-user Vertical 2019 & 2032
- Table 7: Global Voice Analytics Industry Revenue Million Forecast, by Region 2019 & 2032
- Table 8: Global Voice Analytics Industry Revenue Million Forecast, by Country 2019 & 2032
- Table 9: United States Voice Analytics Industry Revenue (Million) Forecast, by Application 2019 & 2032
- Table 10: Canada Voice Analytics Industry Revenue (Million) Forecast, by Application 2019 & 2032
- Table 11: Global Voice Analytics Industry Revenue Million Forecast, by Country 2019 & 2032
- Table 12: Germany Voice Analytics Industry Revenue (Million) Forecast, by Application 2019 & 2032
- Table 13: United Kingdom Voice Analytics Industry Revenue (Million) Forecast, by Application 2019 & 2032
- Table 14: France Voice Analytics Industry Revenue (Million) Forecast, by Application 2019 & 2032
- Table 15: Rest of Europe Voice Analytics Industry Revenue (Million) Forecast, by Application 2019 & 2032
- Table 16: Global Voice Analytics Industry Revenue Million Forecast, by Country 2019 & 2032
- Table 17: India Voice Analytics Industry Revenue (Million) Forecast, by Application 2019 & 2032
- Table 18: China Voice Analytics Industry Revenue (Million) Forecast, by Application 2019 & 2032
- Table 19: Japan Voice Analytics Industry Revenue (Million) Forecast, by Application 2019 & 2032
- Table 20: Rest of Asia Pacific Voice Analytics Industry Revenue (Million) Forecast, by Application 2019 & 2032
- Table 21: Global Voice Analytics Industry Revenue Million Forecast, by Country 2019 & 2032
- Table 22: Brazil Voice Analytics Industry Revenue (Million) Forecast, by Application 2019 & 2032
- Table 23: Argentina Voice Analytics Industry Revenue (Million) Forecast, by Application 2019 & 2032
- Table 24: Rest of Latin America Voice Analytics Industry Revenue (Million) Forecast, by Application 2019 & 2032
- Table 25: Global Voice Analytics Industry Revenue Million Forecast, by Country 2019 & 2032
- Table 26: United Arab Emirates Voice Analytics Industry Revenue (Million) Forecast, by Application 2019 & 2032
- Table 27: Saudi Arabia Voice Analytics Industry Revenue (Million) Forecast, by Application 2019 & 2032
- Table 28: Rest of Middle East and Africa Voice Analytics Industry Revenue (Million) Forecast, by Application 2019 & 2032
- Table 29: Global Voice Analytics Industry Revenue Million Forecast, by Component 2019 & 2032
- Table 30: Global Voice Analytics Industry Revenue Million Forecast, by Deployment 2019 & 2032
- Table 31: Global Voice Analytics Industry Revenue Million Forecast, by Organization Size 2019 & 2032
- Table 32: Global Voice Analytics Industry Revenue Million Forecast, by Application 2019 & 2032
- Table 33: Global Voice Analytics Industry Revenue Million Forecast, by End-user Vertical 2019 & 2032
- Table 34: Global Voice Analytics Industry Revenue Million Forecast, by Country 2019 & 2032
- Table 35: United States Voice Analytics Industry Revenue (Million) Forecast, by Application 2019 & 2032
- Table 36: Canada Voice Analytics Industry Revenue (Million) Forecast, by Application 2019 & 2032
- Table 37: Global Voice Analytics Industry Revenue Million Forecast, by Component 2019 & 2032
- Table 38: Global Voice Analytics Industry Revenue Million Forecast, by Deployment 2019 & 2032
- Table 39: Global Voice Analytics Industry Revenue Million Forecast, by Organization Size 2019 & 2032
- Table 40: Global Voice Analytics Industry Revenue Million Forecast, by Application 2019 & 2032
- Table 41: Global Voice Analytics Industry Revenue Million Forecast, by End-user Vertical 2019 & 2032
- Table 42: Global Voice Analytics Industry Revenue Million Forecast, by Country 2019 & 2032
- Table 43: Germany Voice Analytics Industry Revenue (Million) Forecast, by Application 2019 & 2032
- Table 44: United Kingdom Voice Analytics Industry Revenue (Million) Forecast, by Application 2019 & 2032
- Table 45: France Voice Analytics Industry Revenue (Million) Forecast, by Application 2019 & 2032
- Table 46: Rest of Europe Voice Analytics Industry Revenue (Million) Forecast, by Application 2019 & 2032
- Table 47: Global Voice Analytics Industry Revenue Million Forecast, by Component 2019 & 2032
- Table 48: Global Voice Analytics Industry Revenue Million Forecast, by Deployment 2019 & 2032
- Table 49: Global Voice Analytics Industry Revenue Million Forecast, by Organization Size 2019 & 2032
- Table 50: Global Voice Analytics Industry Revenue Million Forecast, by Application 2019 & 2032
- Table 51: Global Voice Analytics Industry Revenue Million Forecast, by End-user Vertical 2019 & 2032
- Table 52: Global Voice Analytics Industry Revenue Million Forecast, by Country 2019 & 2032
- Table 53: India Voice Analytics Industry Revenue (Million) Forecast, by Application 2019 & 2032
- Table 54: China Voice Analytics Industry Revenue (Million) Forecast, by Application 2019 & 2032
- Table 55: Japan Voice Analytics Industry Revenue (Million) Forecast, by Application 2019 & 2032
- Table 56: Rest of Asia Pacific Voice Analytics Industry Revenue (Million) Forecast, by Application 2019 & 2032
- Table 57: Global Voice Analytics Industry Revenue Million Forecast, by Component 2019 & 2032
- Table 58: Global Voice Analytics Industry Revenue Million Forecast, by Deployment 2019 & 2032
- Table 59: Global Voice Analytics Industry Revenue Million Forecast, by Organization Size 2019 & 2032
- Table 60: Global Voice Analytics Industry Revenue Million Forecast, by Application 2019 & 2032
- Table 61: Global Voice Analytics Industry Revenue Million Forecast, by End-user Vertical 2019 & 2032
- Table 62: Global Voice Analytics Industry Revenue Million Forecast, by Country 2019 & 2032
- Table 63: Brazil Voice Analytics Industry Revenue (Million) Forecast, by Application 2019 & 2032
- Table 64: Argentina Voice Analytics Industry Revenue (Million) Forecast, by Application 2019 & 2032
- Table 65: Rest of Latin America Voice Analytics Industry Revenue (Million) Forecast, by Application 2019 & 2032
- Table 66: Global Voice Analytics Industry Revenue Million Forecast, by Component 2019 & 2032
- Table 67: Global Voice Analytics Industry Revenue Million Forecast, by Deployment 2019 & 2032
- Table 68: Global Voice Analytics Industry Revenue Million Forecast, by Organization Size 2019 & 2032
- Table 69: Global Voice Analytics Industry Revenue Million Forecast, by Application 2019 & 2032
- Table 70: Global Voice Analytics Industry Revenue Million Forecast, by End-user Vertical 2019 & 2032
- Table 71: Global Voice Analytics Industry Revenue Million Forecast, by Country 2019 & 2032
- Table 72: United Arab Emirates Voice Analytics Industry Revenue (Million) Forecast, by Application 2019 & 2032
- Table 73: Saudi Arabia Voice Analytics Industry Revenue (Million) Forecast, by Application 2019 & 2032
- Table 74: Rest of Middle East and Africa Voice Analytics Industry Revenue (Million) Forecast, by Application 2019 & 2032
Frequently Asked Questions
1. What is the projected Compound Annual Growth Rate (CAGR) of the Voice Analytics Industry?
The projected CAGR is approximately 15.00%.
2. Which companies are prominent players in the Voice Analytics Industry?
Key companies in the market include Beyond Verbal, Avaya, VoiceSense Ltd, SESTEK, ThoughtSpot Inc, Invoca Inc *List Not Exhaustive, Talkdesk, Verint Systems, audEERING GmbH, VoiceBase Inc, RankMiner Inc, Uniphore.
3. What are the main segments of the Voice Analytics Industry?
The market segments include Component, Deployment, Organization Size, Application, End-user Vertical.
4. Can you provide details about the market size?
The market size is estimated to be USD XX Million as of 2022.
5. What are some drivers contributing to market growth?
Increasing Investments in Optical Fiber Communication Infrastructure.
6. What are the notable trends driving market growth?
Applications driving the growth of the market.
7. Are there any restraints impacting market growth?
Instant Loss of Liquidity.
8. Can you provide examples of recent developments in the market?
September 2022: Contact center AI platform Observe.AI launched a new set of tools for determining what the AI's data analysis signifies. The new Conversation Intelligence Consulting Services provides a mechanism for contact centers to integrate better and analyze how user interactions with human and virtual agents are progressing and what can be done to improve them.
9. What pricing options are available for accessing the report?
Pricing options include single-user, multi-user, and enterprise licenses priced at USD 4750, USD 5250, and USD 8750 respectively.
10. Is the market size provided in terms of value or volume?
The market size is provided in terms of value, measured in Million.
11. Are there any specific market keywords associated with the report?
Yes, the market keyword associated with the report is "Voice Analytics Industry," which aids in identifying and referencing the specific market segment covered.
12. How do I determine which pricing option suits my needs best?
The pricing options vary based on user requirements and access needs. Individual users may opt for single-user licenses, while businesses requiring broader access may choose multi-user or enterprise licenses for cost-effective access to the report.
13. Are there any additional resources or data provided in the Voice Analytics Industry report?
While the report offers comprehensive insights, it's advisable to review the specific contents or supplementary materials provided to ascertain if additional resources or data are available.
14. How can I stay updated on further developments or reports in the Voice Analytics Industry?
To stay informed about further developments, trends, and reports in the Voice Analytics Industry, consider subscribing to industry newsletters, following relevant companies and organizations, or regularly checking reputable industry news sources and publications.
Methodology
Step 1 - Identification of Relevant Samples Size from Population Database


Step 2 - Approaches for Defining Global Market Size (Value, Volume* & Price*)

Note*: In applicable scenarios
Step 3 - Data Sources
Primary Research
- Web Analytics
- Survey Reports
- Research Institute
- Latest Research Reports
- Opinion Leaders
Secondary Research
- Annual Reports
- White Paper
- Latest Press Release
- Industry Association
- Paid Database
- Investor Presentations

Step 4 - Data Triangulation
Involves using different sources of information in order to increase the validity of a study
These sources are likely to be stakeholders in a program - participants, other researchers, program staff, other community members, and so on.
Then we put all data in single framework & apply various statistical tools to find out the dynamic on the market.
During the analysis stage, feedback from the stakeholder groups would be compared to determine areas of agreement as well as areas of divergence


