

Key Insights
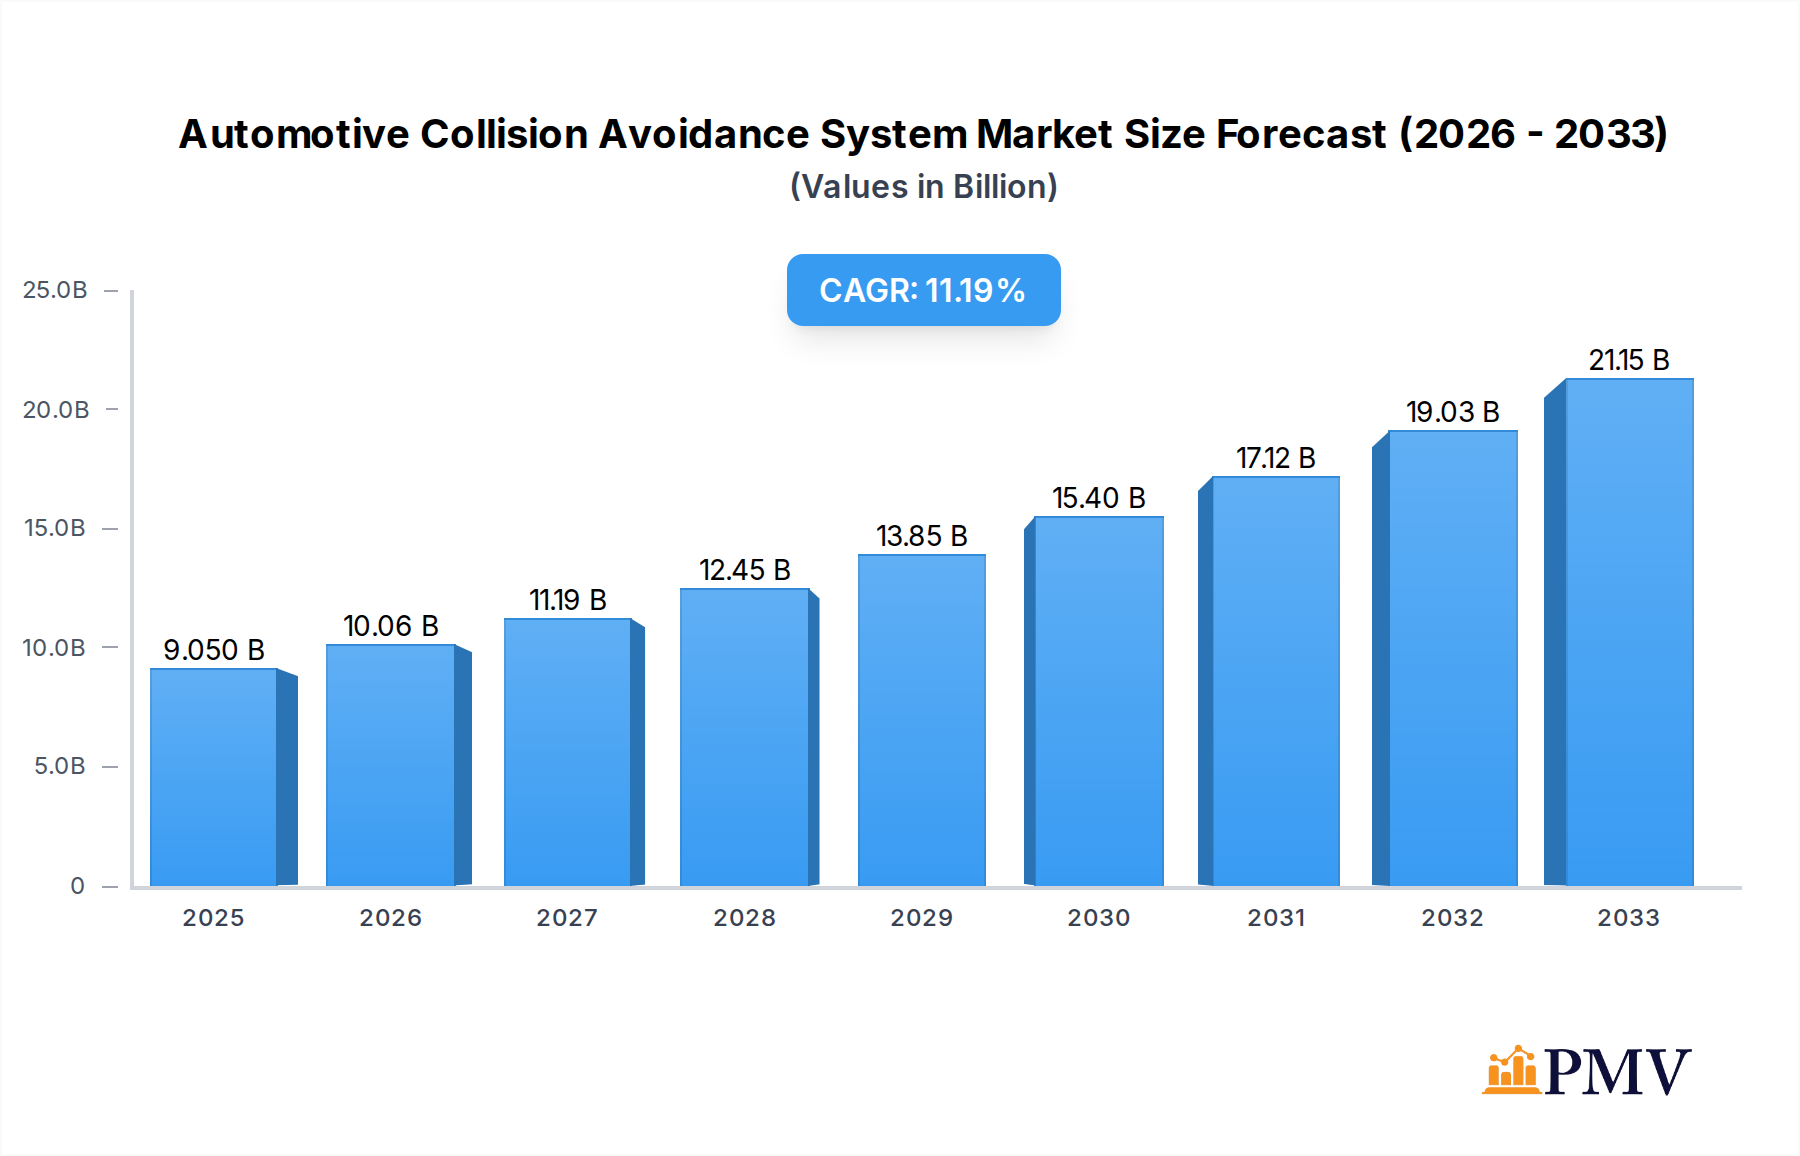
The global Automotive Collision Avoidance System market is poised for significant expansion, projected to reach USD 9.05 billion in 2025 and demonstrating a robust CAGR of 11.3% during the forecast period. This substantial growth is underpinned by a confluence of factors including stringent government safety regulations mandating advanced driver-assistance systems (ADAS) in new vehicles, increasing consumer demand for enhanced vehicle safety features, and the accelerating adoption of autonomous driving technologies. The continuous innovation in sensor technology, such as advancements in radar, lidar, and camera systems, coupled with the integration of sophisticated AI algorithms for real-time threat detection and mitigation, are further fueling market penetration. Applications are broadly segmented into passenger cars and commercial vehicles, with both segments witnessing substantial demand driven by safety imperatives and operational efficiency benefits. The "Others" category, likely encompassing off-road vehicles and specialized industrial equipment, also contributes to the overall market trajectory.

Automotive Collision Avoidance System Market Size (In Billion)
The market's upward momentum is primarily driven by the critical need to reduce road accidents and fatalities. Advancements in sensor fusion, predictive analytics, and vehicle-to-vehicle (V2V) communication technologies are enhancing the efficacy of collision avoidance systems, making them more proactive and precise. However, the market also faces certain restraints, including the high initial cost of these advanced systems, which can impact affordability for entry-level vehicles and certain developing economies. Consumer awareness and understanding of these complex technologies also play a role, requiring ongoing education initiatives. Geographically, North America and Europe are leading the adoption due to early regulatory frameworks and high consumer purchasing power, while the Asia Pacific region is emerging as a rapidly growing market, propelled by increasing vehicle production, improving infrastructure, and rising safety consciousness. Key players are actively investing in R&D to develop more integrated and cost-effective solutions, anticipating a future where collision avoidance systems are standard across all vehicle types.
Automotive Collision Avoidance System Company Market Share
This in-depth report provides a thorough examination of the global Automotive Collision Avoidance System (ACAS) market, encompassing market dynamics, technological advancements, competitive landscape, and future projections. The study covers the historical period from 2019 to 2024, with a base year of 2025 and a forecast period extending to 2033. Leveraging high-ranking keywords such as "autonomous driving," "ADAS technologies," "vehicle safety," "advanced driver-assistance systems," and "road safety solutions," this report is meticulously crafted to enhance search visibility and engage a broad spectrum of industry stakeholders, including automotive manufacturers, technology providers, government bodies, and investors. The projected market size is expected to reach $X billion by 2033, exhibiting a compound annual growth rate (CAGR) of X% during the forecast period.
Automotive Collision Avoidance System Market Structure & Competitive Dynamics
The automotive collision avoidance system market exhibits a dynamic structure characterized by intense competition and a rapidly evolving innovation ecosystem. Market concentration varies across different ACAS technologies and application segments, with leading players often dominating specific niches. Innovation is heavily driven by R&D investments in AI, sensor fusion, and real-time processing. Regulatory frameworks, such as mandates for specific safety features, play a crucial role in shaping market growth and technology adoption. Product substitutes, while nascent, are emerging in the form of advanced software-defined features and integration with other vehicle systems. End-user trends strongly favor enhanced vehicle safety and the adoption of semi-autonomous driving capabilities. Mergers and acquisitions (M&A) activities are prominent, with significant deal values of over $X billion recorded during the historical period, indicating consolidation and strategic expansion among key industry players like Autoliv, Inc. and Robert Bosch GmbH. The pursuit of higher market share and the integration of cutting-edge ADAS technologies remain central to competitive strategies.
- Market Concentration: Moderate to high in established sensor technologies like Radar, with increasing fragmentation in emerging Lidar and AI-driven perception systems.
- Innovation Ecosystems: Driven by collaborations between Tier-1 suppliers, semiconductor manufacturers, and automotive OEMs, fostering rapid development cycles.
- Regulatory Frameworks: Increasing stringency of global vehicle safety standards is a significant catalyst for ACAS adoption.
- Product Substitutes: Primarily limited to software-based enhancements and integration with existing vehicle platforms.
- End-User Trends: Growing consumer demand for safer vehicles and the allure of advanced driver-assistance features.
- M&A Activities: Strategic acquisitions focused on securing intellectual property, expanding technology portfolios, and gaining market access, with aggregated deal values exceeding $X billion.
Automotive Collision Avoidance System Industry Trends & Insights
The automotive collision avoidance system industry is witnessing unprecedented growth, fueled by a confluence of technological advancements, increasing regulatory mandates, and a burgeoning consumer awareness of vehicle safety. The market is experiencing robust expansion, with a projected market penetration of XX% by 2033. Key growth drivers include the escalating demand for autonomous driving features, the continuous refinement of sensor technologies such as radar, lidar, and cameras, and the integration of sophisticated artificial intelligence (AI) algorithms for enhanced perception and decision-making. The implementation of advanced driver-assistance systems (ADAS) is no longer a luxury but a necessity, driven by stringent safety regulations globally, pushing automakers to equip vehicles with robust collision avoidance capabilities. Technological disruptions are evident in the miniaturization of sensors, the development of more powerful and energy-efficient processing units, and the evolution of over-the-air (OTA) software updates for continuous improvement of ACAS performance.
Consumer preferences are increasingly shifting towards vehicles equipped with comprehensive safety suites, viewing them as a primary purchasing criterion. This heightened demand directly translates into a larger market for ACAS. The competitive dynamics within the industry are characterized by significant R&D investments, strategic partnerships, and a keen focus on delivering reliable and cost-effective solutions. The integration of these systems is also expanding beyond passenger cars to commercial vehicles, including trucks and buses, where the potential for accident reduction is immense. The automotive collision avoidance system market size is projected to continue its upward trajectory, driven by these compelling factors. The CAGR for the forecast period is estimated to be X%, a testament to the industry's strong growth potential. The ongoing development of vehicle-to-everything (V2X) communication further promises to enhance the capabilities of ACAS, enabling proactive hazard detection and avoidance. The penetration of Level 2 and Level 3 autonomous driving systems, heavily reliant on ACAS, is a significant indicator of the market's evolution.
Dominant Markets & Segments in Automotive Collision Avoidance System
The automotive collision avoidance system market is experiencing robust growth across various regions and segments, driven by distinct economic policies, infrastructure development, and consumer adoption rates. North America and Europe currently lead the market, owing to stringent safety regulations and a high consumer preference for advanced vehicle safety technologies. Asia-Pacific, particularly China, is emerging as a significant growth engine, spurred by rapid advancements in automotive manufacturing, increasing disposable incomes, and government initiatives promoting smart mobility.
Application Dominance:
- Car: Passenger cars represent the largest and most dominant application segment for ACAS. The high volume of car production globally, coupled with increasing consumer demand for safety features and the integration of ADAS in mainstream models, underpins this dominance. The market size for ACAS in cars is estimated to reach $X billion by 2033, with a CAGR of X%.
- Commercial Vehicle: This segment is exhibiting the fastest growth rate, driven by a strong emphasis on fleet safety, reduced operational costs due to fewer accidents, and regulatory pressures for commercial vehicle safety. The market size for ACAS in commercial vehicles is projected to reach $X billion by 2033, with a CAGR of X%.
- Others: This segment, including specialized vehicles and off-highway equipment, is experiencing steady growth as safety becomes paramount across all modes of transportation.
Type Dominance:
- Camera: Camera-based ACAS systems are widely adopted due to their versatility in detecting visual cues, identifying lane markings, and recognizing pedestrians and other vehicles. They are cost-effective and have seen significant improvements in low-light and adverse weather conditions. The market size for camera-based ACAS is projected to reach $X billion by 2033.
- Radar: Radar systems are crucial for their ability to operate effectively in various weather conditions and detect objects at longer ranges, making them indispensable for adaptive cruise control and forward collision warning. The market size for radar-based ACAS is estimated to reach $X billion by 2033.
- Lidar: Lidar technology is gaining traction, especially for higher levels of autonomy, due to its precision in 3D mapping and object detection. Its adoption is expected to surge as autonomous driving capabilities advance. The market size for lidar-based ACAS is projected to reach $X billion by 2033.
- Ultrasonic: Primarily used for short-range detection, ultrasonic sensors are vital for parking assistance and low-speed maneuvering. The market size for ultrasonic ACAS is estimated to reach $X billion by 2033.
Key drivers of dominance in these segments include technological maturity, cost-effectiveness, integration capabilities, and regulatory support for specific applications.
Automotive Collision Avoidance System Product Innovations
The automotive collision avoidance system market is witnessing rapid product innovation, driving enhanced safety and autonomous capabilities. Key developments include the integration of AI and machine learning for improved object recognition and predictive analysis, the advent of higher-resolution and more compact sensor technologies like solid-state Lidar and advanced radar systems, and the seamless fusion of data from multiple sensor types (sensor fusion) to create a comprehensive environmental model. These innovations offer competitive advantages by enabling more precise, faster, and more reliable detection and mitigation of potential collisions, paving the way for advanced ADAS and ultimately, fully autonomous driving. The market fit is strong, directly addressing the increasing demand for enhanced vehicle safety and driver comfort.
Report Segmentation & Scope
This report meticulously segments the automotive collision avoidance system market to provide granular insights into its diverse landscape. The segmentation is based on key Application and Type categories, allowing stakeholders to understand the market dynamics within specific areas.
- Application: Car: This segment encompasses ACAS solutions designed for passenger vehicles. It projects significant growth due to high production volumes and consumer demand for safety features. The market size within this segment is estimated to be $X billion by 2033.
- Application: Commercial Vehicle: This segment focuses on ACAS for trucks, buses, and other heavy-duty vehicles. It is expected to exhibit substantial growth, driven by fleet safety mandates and operational efficiency gains. The market size within this segment is estimated to be $X billion by 2033.
- Application: Others: This category includes specialized vehicles and off-highway equipment, where safety is increasingly becoming a critical factor.
- Type: Radar: This segment analyzes the market for radar-based ACAS technologies, valued for their all-weather performance and long-range detection capabilities. The market size is estimated to be $X billion by 2033.
- Type: Lidar: This segment explores the growing market for Lidar systems, crucial for high-precision 3D mapping and advanced autonomous functions. The market size is estimated to be $X billion by 2033.
- Type: Camera: This segment focuses on camera-based ACAS, popular for their versatility in object recognition and lane keeping. The market size is estimated to be $X billion by 2033.
- Type: Ultrasonic: This segment covers ultrasonic sensors, primarily used for short-range detection and parking assistance. The market size is estimated to be $X billion by 2033.
Key Drivers of Automotive Collision Avoidance System Growth
The automotive collision avoidance system market is propelled by a potent combination of technological advancements, evolving regulatory landscapes, and increasing consumer awareness. The relentless pursuit of enhanced road safety, driven by high accident rates and their associated economic and human costs, is a primary catalyst. Advancements in sensor technology, including the development of more sophisticated radar, lidar, and camera systems, alongside breakthroughs in AI and machine learning for enhanced perception and decision-making, are fundamental growth enablers. Government mandates and safety regulations, such as Euro NCAP and NHTSA requirements for specific ADAS features, are compelling automakers to integrate these systems. Furthermore, the growing consumer demand for advanced safety features and the increasing adoption of semi-autonomous driving capabilities are significantly contributing to market expansion. The projected market size is expected to be $X billion by 2033.
Challenges in the Automotive Collision Avoidance System Sector
Despite the robust growth trajectory, the automotive collision avoidance system sector faces several challenges. High development and integration costs associated with advanced ACAS technologies can be a significant barrier, particularly for smaller automotive manufacturers and in emerging markets. Complex regulatory environments and the lack of global standardization for certain ADAS features can lead to fragmentation and increased compliance efforts. Supply chain disruptions, as witnessed in recent global events, can impact the availability and cost of critical components like semiconductors, affecting production timelines and pricing. Furthermore, public perception and trust in the reliability of autonomous driving features, coupled with cybersecurity concerns, can influence consumer adoption rates. The competitive pressures from established players and new entrants also necessitate continuous innovation and cost optimization to maintain market share.
Leading Players in the Automotive Collision Avoidance System Market
The automotive collision avoidance system market is characterized by a competitive landscape featuring established automotive suppliers and technology giants. Key players driving innovation and market share include:
- Alstom SA
- Autoliv, Inc.
- Denso Corporation
- General Electric Company
- Hexagon AB
- Honeywell International, Inc.
- Robert Bosch GmbH
- Rockwell Collins, Inc.
- Siemens AG
- Wabtec Corporation
- Continental
- BorgWarner Inc (Delphi)
- Infineon Technologies
- Panasonic
- ZF Group
- Magna International
- Toyota
- Hyundai Mobis
- Wabco Holdings
- Bendix Commercial Vehicle Systems
Key Developments in Automotive Collision Avoidance System Sector
- 2023/01: Autoliv, Inc. announces breakthrough in radar sensor technology, enhancing object detection capabilities.
- 2023/03: Continental introduces new lidar system with increased resolution and range for autonomous driving applications.
- 2023/05: Robert Bosch GmbH expands its ADAS sensor portfolio with advanced camera and ultrasonic solutions.
- 2023/07: Waymo (an Alphabet Inc. company, not listed but a key player in autonomous tech) expands its fully driverless ride-hailing service, highlighting advancements in collision avoidance.
- 2023/09: Denso Corporation invests heavily in AI research for predictive collision avoidance systems.
- 2023/11: ZF Group acquires a significant stake in a lidar technology startup, strengthening its autonomous driving capabilities.
- 2024/01: Magna International partners with a leading semiconductor manufacturer to accelerate the development of next-generation ACAS chips.
- 2024/03: Honeywell International, Inc. showcases its integrated cockpit solutions, enhancing driver awareness and collision avoidance.
- 2024/05: Panasonic unveils its advanced vision processing unit for robust object recognition in all weather conditions.
- 2024/07: Hyundai Mobis launches a new generation of surround-view monitoring systems for enhanced 360-degree collision avoidance.
- 2024/09: Infineon Technologies develops new power semiconductors crucial for the efficient operation of ACAS hardware.
- 2024/11: Bendix Commercial Vehicle Systems integrates advanced AEBS (Advanced Emergency Braking System) for heavy-duty trucks.
- 2025/01: WABCO Holdings (now ZF Friedrichshafen AG) announces the integration of its advanced braking technologies into new ACAS platforms.
Strategic Automotive Collision Avoidance System Market Outlook
The strategic outlook for the automotive collision avoidance system market is exceptionally promising, driven by a relentless push towards enhanced vehicle safety and the advent of autonomous driving. Growth accelerators include continued advancements in AI-powered sensor fusion, enabling more sophisticated environmental perception and proactive threat mitigation. The increasing adoption of Level 3 and Level 4 autonomous driving features, heavily reliant on robust ACAS, will further propel market expansion. Strategic opportunities lie in the development of cost-effective and scalable solutions for mass-market adoption, the integration of V2X communication for improved situational awareness, and the provision of cybersecurity solutions to protect these increasingly connected vehicle systems. Collaborations between technology providers, automakers, and regulatory bodies will be crucial for fostering innovation and standardization, ultimately shaping a safer and more autonomous future of mobility with an estimated market size of $X billion by 2033.
Automotive Collision Avoidance System Segmentation
-
1. Application
- 1.1. Car
- 1.2. Commercial Vehicle
- 1.3. Others
-
2. Types
- 2.1. Radar
- 2.2. Lidar
- 2.3. Camera
- 2.4. Ultrasonic
Automotive Collision Avoidance System Segmentation By Geography
-
1. North America
- 1.1. United States
- 1.2. Canada
- 1.3. Mexico
-
2. South America
- 2.1. Brazil
- 2.2. Argentina
- 2.3. Rest of South America
-
3. Europe
- 3.1. United Kingdom
- 3.2. Germany
- 3.3. France
- 3.4. Italy
- 3.5. Spain
- 3.6. Russia
- 3.7. Benelux
- 3.8. Nordics
- 3.9. Rest of Europe
-
4. Middle East & Africa
- 4.1. Turkey
- 4.2. Israel
- 4.3. GCC
- 4.4. North Africa
- 4.5. South Africa
- 4.6. Rest of Middle East & Africa
-
5. Asia Pacific
- 5.1. China
- 5.2. India
- 5.3. Japan
- 5.4. South Korea
- 5.5. ASEAN
- 5.6. Oceania
- 5.7. Rest of Asia Pacific
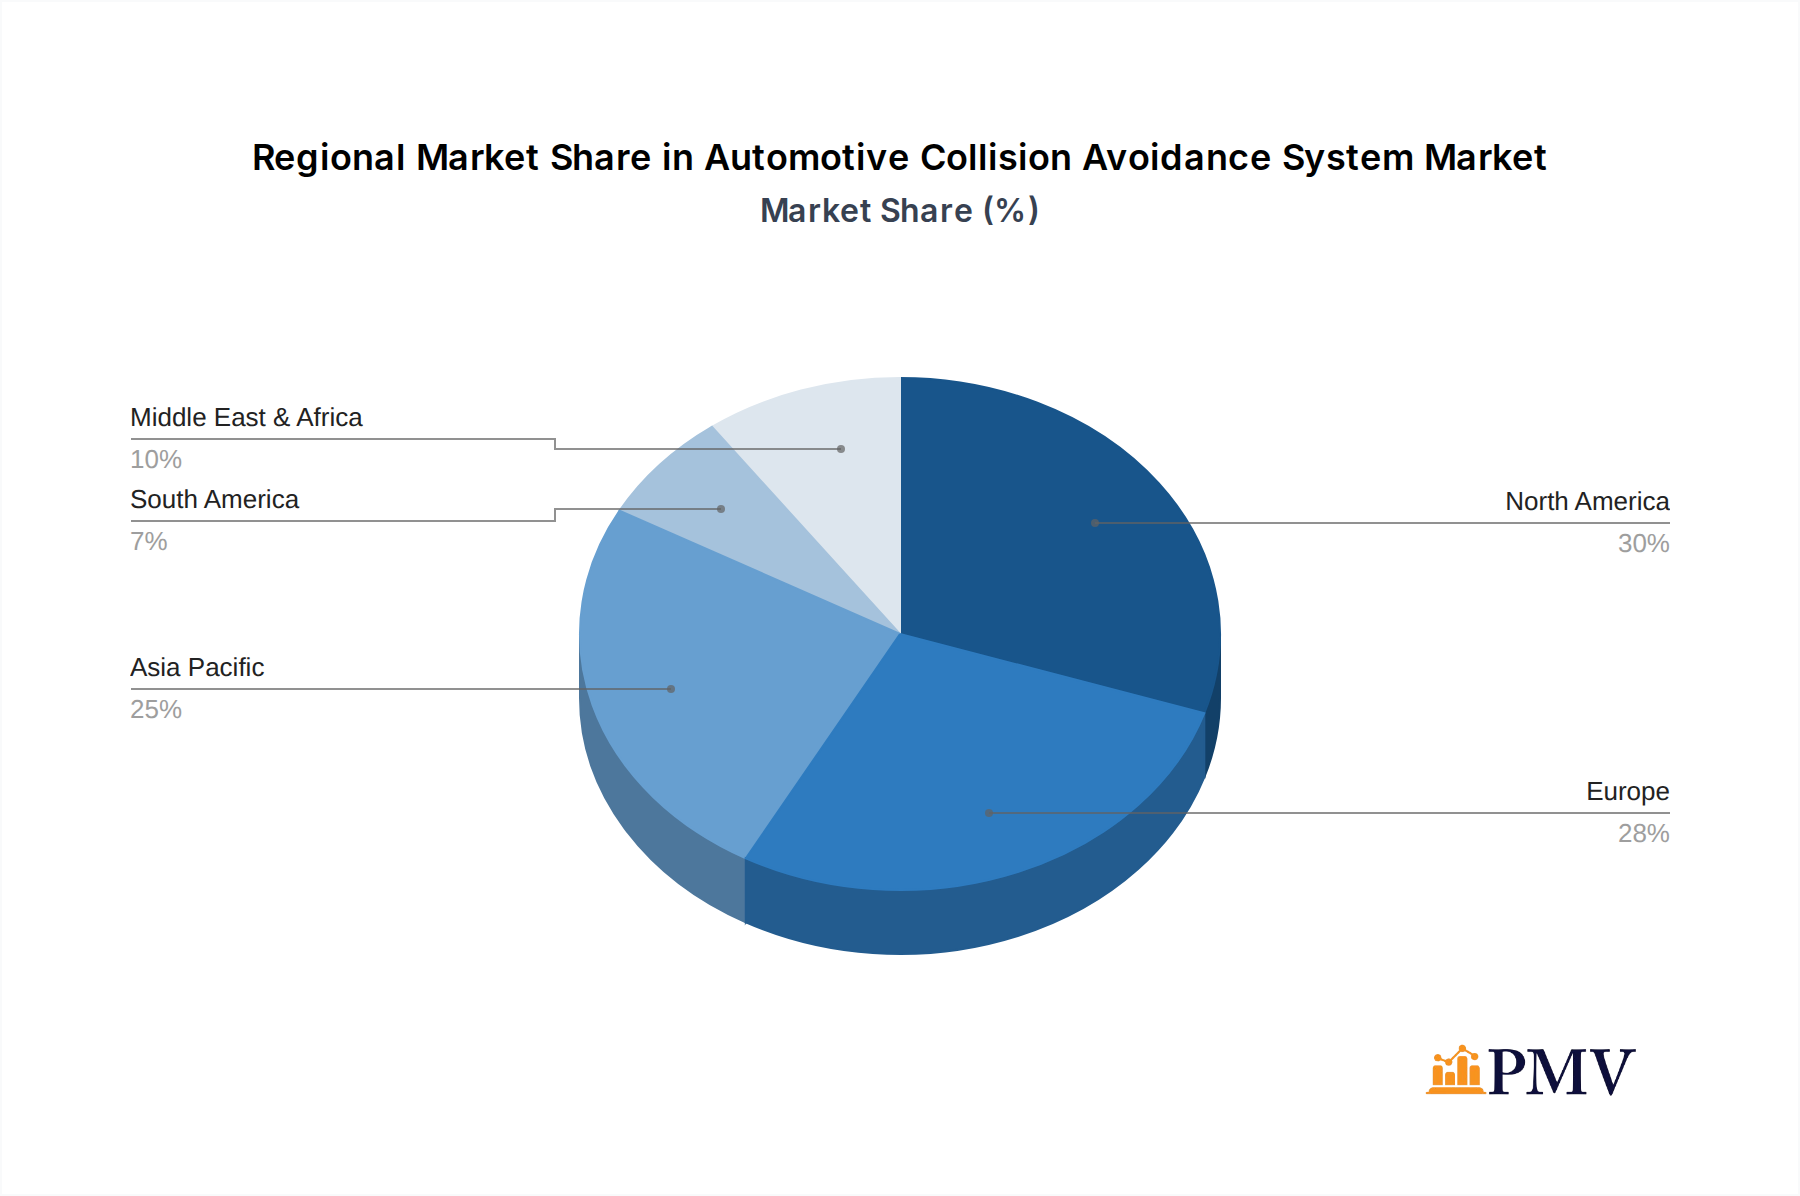
Automotive Collision Avoidance System Regional Market Share
Geographic Coverage of Automotive Collision Avoidance System
Automotive Collision Avoidance System REPORT HIGHLIGHTS
| Aspects | Details |
|---|---|
| Study Period | 2020-2034 |
| Base Year | 2025 |
| Estimated Year | 2026 |
| Forecast Period | 2026-2034 |
| Historical Period | 2020-2025 |
| Growth Rate | CAGR of 11.3% from 2020-2034 |
| Segmentation |
|
Table of Contents
- 1. Introduction
- 1.1. Research Scope
- 1.2. Market Segmentation
- 1.3. Research Methodology
- 1.4. Definitions and Assumptions
- 2. Executive Summary
- 2.1. Introduction
- 3. Market Dynamics
- 3.1. Introduction
- 3.2. Market Drivers
- 3.3. Market Restrains
- 3.4. Market Trends
- 4. Market Factor Analysis
- 4.1. Porters Five Forces
- 4.2. Supply/Value Chain
- 4.3. PESTEL analysis
- 4.4. Market Entropy
- 4.5. Patent/Trademark Analysis
- 5. Global Automotive Collision Avoidance System Analysis, Insights and Forecast, 2020-2032
- 5.1. Market Analysis, Insights and Forecast - by Application
- 5.1.1. Car
- 5.1.2. Commercial Vehicle
- 5.1.3. Others
- 5.2. Market Analysis, Insights and Forecast - by Types
- 5.2.1. Radar
- 5.2.2. Lidar
- 5.2.3. Camera
- 5.2.4. Ultrasonic
- 5.3. Market Analysis, Insights and Forecast - by Region
- 5.3.1. North America
- 5.3.2. South America
- 5.3.3. Europe
- 5.3.4. Middle East & Africa
- 5.3.5. Asia Pacific
- 5.1. Market Analysis, Insights and Forecast - by Application
- 6. North America Automotive Collision Avoidance System Analysis, Insights and Forecast, 2020-2032
- 6.1. Market Analysis, Insights and Forecast - by Application
- 6.1.1. Car
- 6.1.2. Commercial Vehicle
- 6.1.3. Others
- 6.2. Market Analysis, Insights and Forecast - by Types
- 6.2.1. Radar
- 6.2.2. Lidar
- 6.2.3. Camera
- 6.2.4. Ultrasonic
- 6.1. Market Analysis, Insights and Forecast - by Application
- 7. South America Automotive Collision Avoidance System Analysis, Insights and Forecast, 2020-2032
- 7.1. Market Analysis, Insights and Forecast - by Application
- 7.1.1. Car
- 7.1.2. Commercial Vehicle
- 7.1.3. Others
- 7.2. Market Analysis, Insights and Forecast - by Types
- 7.2.1. Radar
- 7.2.2. Lidar
- 7.2.3. Camera
- 7.2.4. Ultrasonic
- 7.1. Market Analysis, Insights and Forecast - by Application
- 8. Europe Automotive Collision Avoidance System Analysis, Insights and Forecast, 2020-2032
- 8.1. Market Analysis, Insights and Forecast - by Application
- 8.1.1. Car
- 8.1.2. Commercial Vehicle
- 8.1.3. Others
- 8.2. Market Analysis, Insights and Forecast - by Types
- 8.2.1. Radar
- 8.2.2. Lidar
- 8.2.3. Camera
- 8.2.4. Ultrasonic
- 8.1. Market Analysis, Insights and Forecast - by Application
- 9. Middle East & Africa Automotive Collision Avoidance System Analysis, Insights and Forecast, 2020-2032
- 9.1. Market Analysis, Insights and Forecast - by Application
- 9.1.1. Car
- 9.1.2. Commercial Vehicle
- 9.1.3. Others
- 9.2. Market Analysis, Insights and Forecast - by Types
- 9.2.1. Radar
- 9.2.2. Lidar
- 9.2.3. Camera
- 9.2.4. Ultrasonic
- 9.1. Market Analysis, Insights and Forecast - by Application
- 10. Asia Pacific Automotive Collision Avoidance System Analysis, Insights and Forecast, 2020-2032
- 10.1. Market Analysis, Insights and Forecast - by Application
- 10.1.1. Car
- 10.1.2. Commercial Vehicle
- 10.1.3. Others
- 10.2. Market Analysis, Insights and Forecast - by Types
- 10.2.1. Radar
- 10.2.2. Lidar
- 10.2.3. Camera
- 10.2.4. Ultrasonic
- 10.1. Market Analysis, Insights and Forecast - by Application
- 11. Competitive Analysis
- 11.1. Global Market Share Analysis 2025
- 11.2. Company Profiles
- 11.2.1 Alstom SA
- 11.2.1.1. Overview
- 11.2.1.2. Products
- 11.2.1.3. SWOT Analysis
- 11.2.1.4. Recent Developments
- 11.2.1.5. Financials (Based on Availability)
- 11.2.2 Autoliv
- 11.2.2.1. Overview
- 11.2.2.2. Products
- 11.2.2.3. SWOT Analysis
- 11.2.2.4. Recent Developments
- 11.2.2.5. Financials (Based on Availability)
- 11.2.3 Inc
- 11.2.3.1. Overview
- 11.2.3.2. Products
- 11.2.3.3. SWOT Analysis
- 11.2.3.4. Recent Developments
- 11.2.3.5. Financials (Based on Availability)
- 11.2.4 Denso Corporation
- 11.2.4.1. Overview
- 11.2.4.2. Products
- 11.2.4.3. SWOT Analysis
- 11.2.4.4. Recent Developments
- 11.2.4.5. Financials (Based on Availability)
- 11.2.5 General Electric Company
- 11.2.5.1. Overview
- 11.2.5.2. Products
- 11.2.5.3. SWOT Analysis
- 11.2.5.4. Recent Developments
- 11.2.5.5. Financials (Based on Availability)
- 11.2.6 Hexagon AB
- 11.2.6.1. Overview
- 11.2.6.2. Products
- 11.2.6.3. SWOT Analysis
- 11.2.6.4. Recent Developments
- 11.2.6.5. Financials (Based on Availability)
- 11.2.7 Honeywell International
- 11.2.7.1. Overview
- 11.2.7.2. Products
- 11.2.7.3. SWOT Analysis
- 11.2.7.4. Recent Developments
- 11.2.7.5. Financials (Based on Availability)
- 11.2.8 Inc
- 11.2.8.1. Overview
- 11.2.8.2. Products
- 11.2.8.3. SWOT Analysis
- 11.2.8.4. Recent Developments
- 11.2.8.5. Financials (Based on Availability)
- 11.2.9 Robert Bosch GmbH
- 11.2.9.1. Overview
- 11.2.9.2. Products
- 11.2.9.3. SWOT Analysis
- 11.2.9.4. Recent Developments
- 11.2.9.5. Financials (Based on Availability)
- 11.2.10 Rockwell Collins
- 11.2.10.1. Overview
- 11.2.10.2. Products
- 11.2.10.3. SWOT Analysis
- 11.2.10.4. Recent Developments
- 11.2.10.5. Financials (Based on Availability)
- 11.2.11 Inc
- 11.2.11.1. Overview
- 11.2.11.2. Products
- 11.2.11.3. SWOT Analysis
- 11.2.11.4. Recent Developments
- 11.2.11.5. Financials (Based on Availability)
- 11.2.12 Siemens AG
- 11.2.12.1. Overview
- 11.2.12.2. Products
- 11.2.12.3. SWOT Analysis
- 11.2.12.4. Recent Developments
- 11.2.12.5. Financials (Based on Availability)
- 11.2.13 Wabtec Corporation
- 11.2.13.1. Overview
- 11.2.13.2. Products
- 11.2.13.3. SWOT Analysis
- 11.2.13.4. Recent Developments
- 11.2.13.5. Financials (Based on Availability)
- 11.2.14 Continental
- 11.2.14.1. Overview
- 11.2.14.2. Products
- 11.2.14.3. SWOT Analysis
- 11.2.14.4. Recent Developments
- 11.2.14.5. Financials (Based on Availability)
- 11.2.15 BorgWarner Inc (Delphi)
- 11.2.15.1. Overview
- 11.2.15.2. Products
- 11.2.15.3. SWOT Analysis
- 11.2.15.4. Recent Developments
- 11.2.15.5. Financials (Based on Availability)
- 11.2.16 Infineon Technologies
- 11.2.16.1. Overview
- 11.2.16.2. Products
- 11.2.16.3. SWOT Analysis
- 11.2.16.4. Recent Developments
- 11.2.16.5. Financials (Based on Availability)
- 11.2.17 Panasonic
- 11.2.17.1. Overview
- 11.2.17.2. Products
- 11.2.17.3. SWOT Analysis
- 11.2.17.4. Recent Developments
- 11.2.17.5. Financials (Based on Availability)
- 11.2.18 ZF Group
- 11.2.18.1. Overview
- 11.2.18.2. Products
- 11.2.18.3. SWOT Analysis
- 11.2.18.4. Recent Developments
- 11.2.18.5. Financials (Based on Availability)
- 11.2.19 Magna International
- 11.2.19.1. Overview
- 11.2.19.2. Products
- 11.2.19.3. SWOT Analysis
- 11.2.19.4. Recent Developments
- 11.2.19.5. Financials (Based on Availability)
- 11.2.20 Toyota
- 11.2.20.1. Overview
- 11.2.20.2. Products
- 11.2.20.3. SWOT Analysis
- 11.2.20.4. Recent Developments
- 11.2.20.5. Financials (Based on Availability)
- 11.2.21 Hyundai Mobis
- 11.2.21.1. Overview
- 11.2.21.2. Products
- 11.2.21.3. SWOT Analysis
- 11.2.21.4. Recent Developments
- 11.2.21.5. Financials (Based on Availability)
- 11.2.22 Wabco Holdings
- 11.2.22.1. Overview
- 11.2.22.2. Products
- 11.2.22.3. SWOT Analysis
- 11.2.22.4. Recent Developments
- 11.2.22.5. Financials (Based on Availability)
- 11.2.23 Bendix Commercial Vehicle Systems
- 11.2.23.1. Overview
- 11.2.23.2. Products
- 11.2.23.3. SWOT Analysis
- 11.2.23.4. Recent Developments
- 11.2.23.5. Financials (Based on Availability)
- 11.2.1 Alstom SA
List of Figures
- Figure 1: Global Automotive Collision Avoidance System Revenue Breakdown (undefined, %) by Region 2025 & 2033
- Figure 2: North America Automotive Collision Avoidance System Revenue (undefined), by Application 2025 & 2033
- Figure 3: North America Automotive Collision Avoidance System Revenue Share (%), by Application 2025 & 2033
- Figure 4: North America Automotive Collision Avoidance System Revenue (undefined), by Types 2025 & 2033
- Figure 5: North America Automotive Collision Avoidance System Revenue Share (%), by Types 2025 & 2033
- Figure 6: North America Automotive Collision Avoidance System Revenue (undefined), by Country 2025 & 2033
- Figure 7: North America Automotive Collision Avoidance System Revenue Share (%), by Country 2025 & 2033
- Figure 8: South America Automotive Collision Avoidance System Revenue (undefined), by Application 2025 & 2033
- Figure 9: South America Automotive Collision Avoidance System Revenue Share (%), by Application 2025 & 2033
- Figure 10: South America Automotive Collision Avoidance System Revenue (undefined), by Types 2025 & 2033
- Figure 11: South America Automotive Collision Avoidance System Revenue Share (%), by Types 2025 & 2033
- Figure 12: South America Automotive Collision Avoidance System Revenue (undefined), by Country 2025 & 2033
- Figure 13: South America Automotive Collision Avoidance System Revenue Share (%), by Country 2025 & 2033
- Figure 14: Europe Automotive Collision Avoidance System Revenue (undefined), by Application 2025 & 2033
- Figure 15: Europe Automotive Collision Avoidance System Revenue Share (%), by Application 2025 & 2033
- Figure 16: Europe Automotive Collision Avoidance System Revenue (undefined), by Types 2025 & 2033
- Figure 17: Europe Automotive Collision Avoidance System Revenue Share (%), by Types 2025 & 2033
- Figure 18: Europe Automotive Collision Avoidance System Revenue (undefined), by Country 2025 & 2033
- Figure 19: Europe Automotive Collision Avoidance System Revenue Share (%), by Country 2025 & 2033
- Figure 20: Middle East & Africa Automotive Collision Avoidance System Revenue (undefined), by Application 2025 & 2033
- Figure 21: Middle East & Africa Automotive Collision Avoidance System Revenue Share (%), by Application 2025 & 2033
- Figure 22: Middle East & Africa Automotive Collision Avoidance System Revenue (undefined), by Types 2025 & 2033
- Figure 23: Middle East & Africa Automotive Collision Avoidance System Revenue Share (%), by Types 2025 & 2033
- Figure 24: Middle East & Africa Automotive Collision Avoidance System Revenue (undefined), by Country 2025 & 2033
- Figure 25: Middle East & Africa Automotive Collision Avoidance System Revenue Share (%), by Country 2025 & 2033
- Figure 26: Asia Pacific Automotive Collision Avoidance System Revenue (undefined), by Application 2025 & 2033
- Figure 27: Asia Pacific Automotive Collision Avoidance System Revenue Share (%), by Application 2025 & 2033
- Figure 28: Asia Pacific Automotive Collision Avoidance System Revenue (undefined), by Types 2025 & 2033
- Figure 29: Asia Pacific Automotive Collision Avoidance System Revenue Share (%), by Types 2025 & 2033
- Figure 30: Asia Pacific Automotive Collision Avoidance System Revenue (undefined), by Country 2025 & 2033
- Figure 31: Asia Pacific Automotive Collision Avoidance System Revenue Share (%), by Country 2025 & 2033
List of Tables
- Table 1: Global Automotive Collision Avoidance System Revenue undefined Forecast, by Application 2020 & 2033
- Table 2: Global Automotive Collision Avoidance System Revenue undefined Forecast, by Types 2020 & 2033
- Table 3: Global Automotive Collision Avoidance System Revenue undefined Forecast, by Region 2020 & 2033
- Table 4: Global Automotive Collision Avoidance System Revenue undefined Forecast, by Application 2020 & 2033
- Table 5: Global Automotive Collision Avoidance System Revenue undefined Forecast, by Types 2020 & 2033
- Table 6: Global Automotive Collision Avoidance System Revenue undefined Forecast, by Country 2020 & 2033
- Table 7: United States Automotive Collision Avoidance System Revenue (undefined) Forecast, by Application 2020 & 2033
- Table 8: Canada Automotive Collision Avoidance System Revenue (undefined) Forecast, by Application 2020 & 2033
- Table 9: Mexico Automotive Collision Avoidance System Revenue (undefined) Forecast, by Application 2020 & 2033
- Table 10: Global Automotive Collision Avoidance System Revenue undefined Forecast, by Application 2020 & 2033
- Table 11: Global Automotive Collision Avoidance System Revenue undefined Forecast, by Types 2020 & 2033
- Table 12: Global Automotive Collision Avoidance System Revenue undefined Forecast, by Country 2020 & 2033
- Table 13: Brazil Automotive Collision Avoidance System Revenue (undefined) Forecast, by Application 2020 & 2033
- Table 14: Argentina Automotive Collision Avoidance System Revenue (undefined) Forecast, by Application 2020 & 2033
- Table 15: Rest of South America Automotive Collision Avoidance System Revenue (undefined) Forecast, by Application 2020 & 2033
- Table 16: Global Automotive Collision Avoidance System Revenue undefined Forecast, by Application 2020 & 2033
- Table 17: Global Automotive Collision Avoidance System Revenue undefined Forecast, by Types 2020 & 2033
- Table 18: Global Automotive Collision Avoidance System Revenue undefined Forecast, by Country 2020 & 2033
- Table 19: United Kingdom Automotive Collision Avoidance System Revenue (undefined) Forecast, by Application 2020 & 2033
- Table 20: Germany Automotive Collision Avoidance System Revenue (undefined) Forecast, by Application 2020 & 2033
- Table 21: France Automotive Collision Avoidance System Revenue (undefined) Forecast, by Application 2020 & 2033
- Table 22: Italy Automotive Collision Avoidance System Revenue (undefined) Forecast, by Application 2020 & 2033
- Table 23: Spain Automotive Collision Avoidance System Revenue (undefined) Forecast, by Application 2020 & 2033
- Table 24: Russia Automotive Collision Avoidance System Revenue (undefined) Forecast, by Application 2020 & 2033
- Table 25: Benelux Automotive Collision Avoidance System Revenue (undefined) Forecast, by Application 2020 & 2033
- Table 26: Nordics Automotive Collision Avoidance System Revenue (undefined) Forecast, by Application 2020 & 2033
- Table 27: Rest of Europe Automotive Collision Avoidance System Revenue (undefined) Forecast, by Application 2020 & 2033
- Table 28: Global Automotive Collision Avoidance System Revenue undefined Forecast, by Application 2020 & 2033
- Table 29: Global Automotive Collision Avoidance System Revenue undefined Forecast, by Types 2020 & 2033
- Table 30: Global Automotive Collision Avoidance System Revenue undefined Forecast, by Country 2020 & 2033
- Table 31: Turkey Automotive Collision Avoidance System Revenue (undefined) Forecast, by Application 2020 & 2033
- Table 32: Israel Automotive Collision Avoidance System Revenue (undefined) Forecast, by Application 2020 & 2033
- Table 33: GCC Automotive Collision Avoidance System Revenue (undefined) Forecast, by Application 2020 & 2033
- Table 34: North Africa Automotive Collision Avoidance System Revenue (undefined) Forecast, by Application 2020 & 2033
- Table 35: South Africa Automotive Collision Avoidance System Revenue (undefined) Forecast, by Application 2020 & 2033
- Table 36: Rest of Middle East & Africa Automotive Collision Avoidance System Revenue (undefined) Forecast, by Application 2020 & 2033
- Table 37: Global Automotive Collision Avoidance System Revenue undefined Forecast, by Application 2020 & 2033
- Table 38: Global Automotive Collision Avoidance System Revenue undefined Forecast, by Types 2020 & 2033
- Table 39: Global Automotive Collision Avoidance System Revenue undefined Forecast, by Country 2020 & 2033
- Table 40: China Automotive Collision Avoidance System Revenue (undefined) Forecast, by Application 2020 & 2033
- Table 41: India Automotive Collision Avoidance System Revenue (undefined) Forecast, by Application 2020 & 2033
- Table 42: Japan Automotive Collision Avoidance System Revenue (undefined) Forecast, by Application 2020 & 2033
- Table 43: South Korea Automotive Collision Avoidance System Revenue (undefined) Forecast, by Application 2020 & 2033
- Table 44: ASEAN Automotive Collision Avoidance System Revenue (undefined) Forecast, by Application 2020 & 2033
- Table 45: Oceania Automotive Collision Avoidance System Revenue (undefined) Forecast, by Application 2020 & 2033
- Table 46: Rest of Asia Pacific Automotive Collision Avoidance System Revenue (undefined) Forecast, by Application 2020 & 2033
Frequently Asked Questions
1. What is the projected Compound Annual Growth Rate (CAGR) of the Automotive Collision Avoidance System?
The projected CAGR is approximately 11.3%.
2. Which companies are prominent players in the Automotive Collision Avoidance System?
Key companies in the market include Alstom SA, Autoliv, Inc, Denso Corporation, General Electric Company, Hexagon AB, Honeywell International, Inc, Robert Bosch GmbH, Rockwell Collins, Inc, Siemens AG, Wabtec Corporation, Continental, BorgWarner Inc (Delphi), Infineon Technologies, Panasonic, ZF Group, Magna International, Toyota, Hyundai Mobis, Wabco Holdings, Bendix Commercial Vehicle Systems.
3. What are the main segments of the Automotive Collision Avoidance System?
The market segments include Application, Types.
4. Can you provide details about the market size?
The market size is estimated to be USD XXX N/A as of 2022.
5. What are some drivers contributing to market growth?
N/A
6. What are the notable trends driving market growth?
N/A
7. Are there any restraints impacting market growth?
N/A
8. Can you provide examples of recent developments in the market?
N/A
9. What pricing options are available for accessing the report?
Pricing options include single-user, multi-user, and enterprise licenses priced at USD 2900.00, USD 4350.00, and USD 5800.00 respectively.
10. Is the market size provided in terms of value or volume?
The market size is provided in terms of value, measured in N/A.
11. Are there any specific market keywords associated with the report?
Yes, the market keyword associated with the report is "Automotive Collision Avoidance System," which aids in identifying and referencing the specific market segment covered.
12. How do I determine which pricing option suits my needs best?
The pricing options vary based on user requirements and access needs. Individual users may opt for single-user licenses, while businesses requiring broader access may choose multi-user or enterprise licenses for cost-effective access to the report.
13. Are there any additional resources or data provided in the Automotive Collision Avoidance System report?
While the report offers comprehensive insights, it's advisable to review the specific contents or supplementary materials provided to ascertain if additional resources or data are available.
14. How can I stay updated on further developments or reports in the Automotive Collision Avoidance System?
To stay informed about further developments, trends, and reports in the Automotive Collision Avoidance System, consider subscribing to industry newsletters, following relevant companies and organizations, or regularly checking reputable industry news sources and publications.
Methodology
Step 1 - Identification of Relevant Samples Size from Population Database


Step 2 - Approaches for Defining Global Market Size (Value, Volume* & Price*)

Note*: In applicable scenarios
Step 3 - Data Sources
Primary Research
- Web Analytics
- Survey Reports
- Research Institute
- Latest Research Reports
- Opinion Leaders
Secondary Research
- Annual Reports
- White Paper
- Latest Press Release
- Industry Association
- Paid Database
- Investor Presentations

Step 4 - Data Triangulation
Involves using different sources of information in order to increase the validity of a study
These sources are likely to be stakeholders in a program - participants, other researchers, program staff, other community members, and so on.
Then we put all data in single framework & apply various statistical tools to find out the dynamic on the market.
During the analysis stage, feedback from the stakeholder groups would be compared to determine areas of agreement as well as areas of divergence