

Key Insights
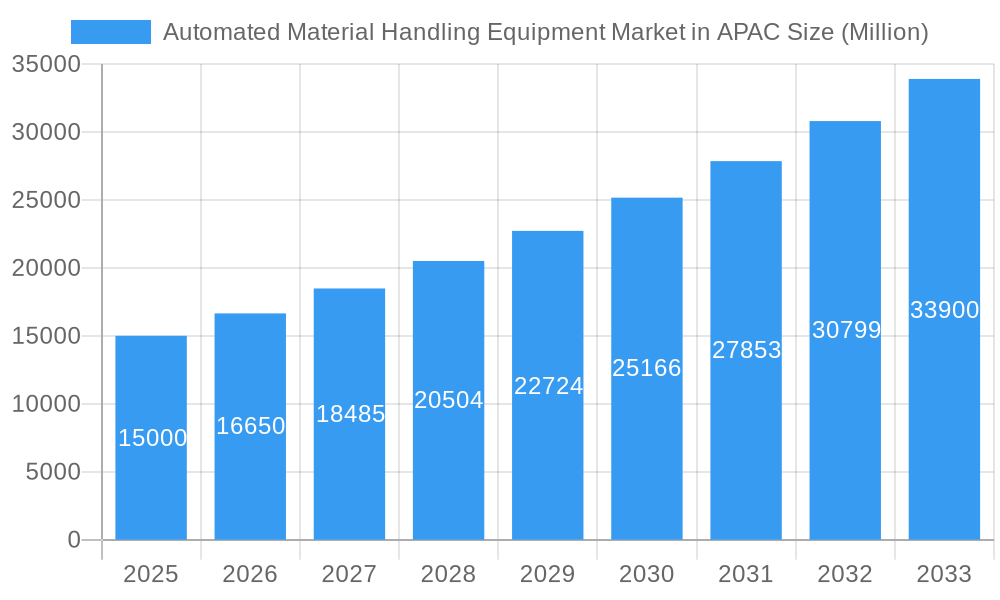
The Asia-Pacific Automated Material Handling Equipment market is experiencing robust growth, driven by the region's expanding e-commerce sector, increasing automation adoption in manufacturing and logistics, and a rising demand for efficient warehouse operations. The market's Compound Annual Growth Rate (CAGR) exceeding 10% signifies a significant expansion opportunity. Key growth drivers include the burgeoning need for improved supply chain efficiency, particularly in countries like China and India experiencing rapid industrialization. Furthermore, advancements in robotics and artificial intelligence are fueling the adoption of sophisticated automated systems, such as autonomous mobile robots (AMRs) and automated guided vehicles (AGVs). The market is segmented by product type (hardware, software, services), autonomy (automatic, manual), equipment type (robots, industrial trucks, conveyors), and end-user vertical (airport, automotive, food and beverage). While the dominance of hardware currently defines the market, the software and services segments are poised for rapid growth, reflecting the increasing need for integrated and intelligent material handling solutions. Challenges remain, however, including high initial investment costs for automation, a skilled labor shortage for maintenance and operation, and concerns regarding data security.
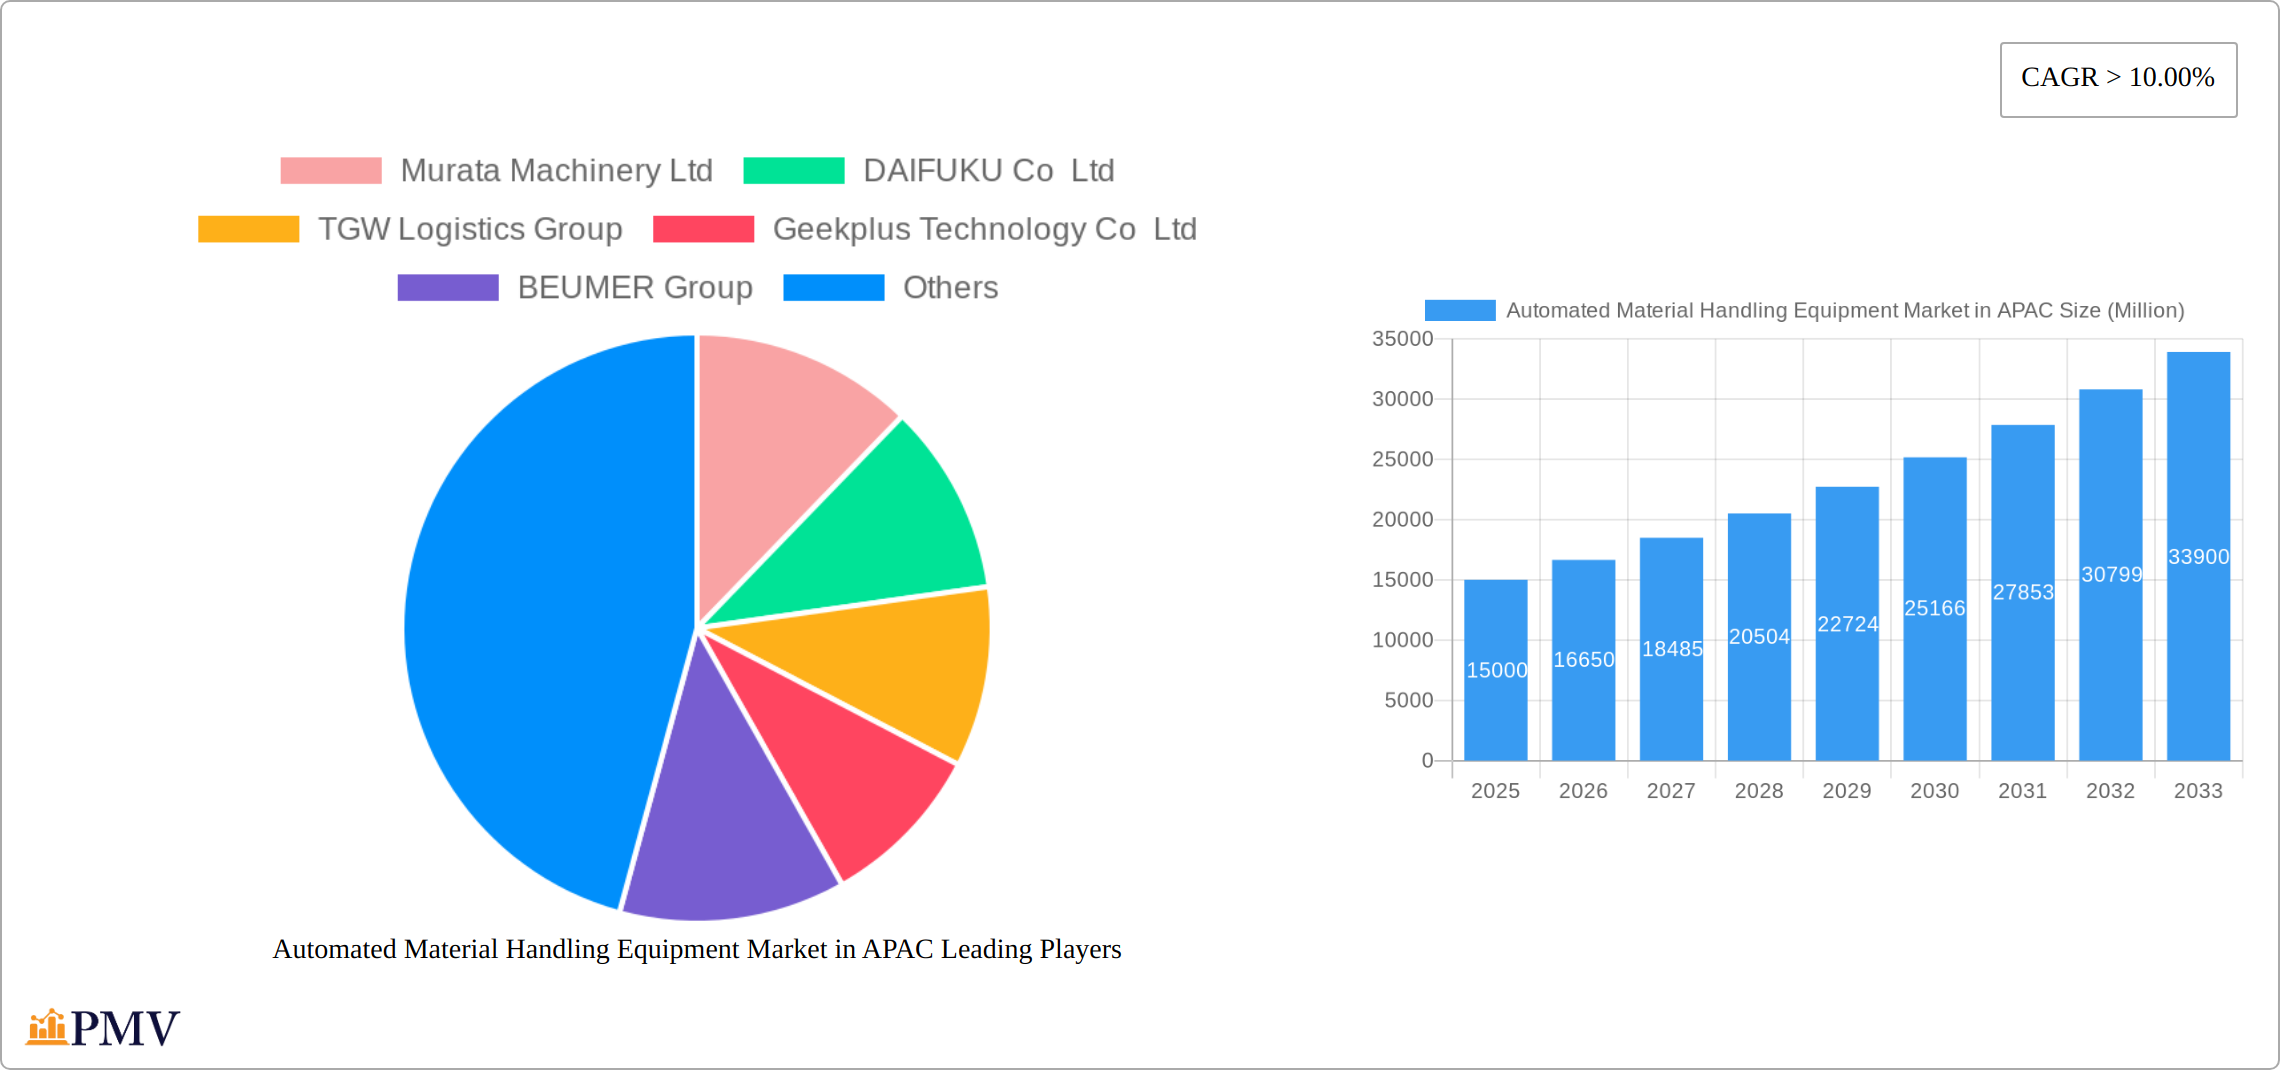
Automated Material Handling Equipment Market in APAC Market Size (In Billion)
Despite these restraints, the long-term outlook for the APAC automated material handling equipment market remains positive. The continued growth of e-commerce, expanding manufacturing activities, and government initiatives promoting automation across various sectors will sustain market expansion. China and India, due to their enormous manufacturing bases and rapidly growing logistics needs, are expected to lead regional growth, followed by Japan and South Korea, which are characterized by advanced automation adoption in their industrial sectors. The increasing focus on optimizing warehouse space and improving order fulfillment speed is further expected to boost the demand for sophisticated automated systems, propelling the overall market value significantly in the forecast period. The competition among prominent players like Murata Machinery, Daifuku, and Geekplus is expected to further drive innovation and pricing competitiveness.
Automated Material Handling Equipment Market in APAC Company Market Share
Automated Material Handling Equipment Market in APAC: A Comprehensive Market Report (2019-2033)
This comprehensive report provides an in-depth analysis of the Automated Material Handling Equipment market in the Asia-Pacific (APAC) region, covering the period from 2019 to 2033. It offers invaluable insights into market size, growth drivers, competitive landscape, and future opportunities, enabling stakeholders to make informed strategic decisions. The report meticulously analyzes market segmentation by country (India, China, Japan, South Korea, and Rest of Asia-Pacific), product type (Hardware, Software, Services), autonomy type (Automatic, Manual), equipment type (Robot, Industrial trucks, Conveyor, Others), and end-user vertical (Airport, Automotive, Food and Beverages, Others).
Automated Material Handling Equipment Market in APAC Market Structure & Competitive Dynamics
The APAC automated material handling equipment market exhibits a moderately concentrated structure, with key players like DAIFUKU Co Ltd, Murata Machinery Ltd, and TGW Logistics Group holding significant market share. However, the emergence of innovative companies like Geekplus Technology Co Ltd and BEUMER Group is intensifying competition. The market is characterized by a dynamic innovation ecosystem, driven by advancements in robotics, AI, and IoT. Regulatory frameworks, varying across APAC countries, influence market adoption. Product substitutes, such as manual handling systems, are facing increasing pressure due to the rising demand for efficiency and automation. End-user trends favor automation to improve productivity and reduce operational costs. M&A activities have been observed, with deal values reaching xx Million in the last five years, further shaping the competitive landscape. Market share for the top three players is estimated at approximately 45% in 2025.
Automated Material Handling Equipment Market in APAC Industry Trends & Insights
The Asia-Pacific (APAC) automated material handling equipment market is experiencing robust growth, fueled by the explosive expansion of e-commerce, a rising adoption rate of industrial automation, and government initiatives focused on infrastructure development across the region. This growth is further accelerated by technological advancements such as the integration of Artificial Intelligence (AI), 5G connectivity, and the Internet of Things (IoT), leading to significant enhancements in equipment capabilities, operational efficiency, and data-driven decision-making. Consumer demand is shifting towards automated solutions that offer demonstrably improved speed, accuracy, safety, and overall supply chain resilience. The market is witnessing a significant surge in the adoption of sophisticated robotic systems and autonomous mobile robots (AMRs) for various material handling applications. The compound annual growth rate (CAGR) is projected at [Insert Updated CAGR]% during the forecast period (2025-2033), with market penetration expected to reach [Insert Updated Penetration]% by 2033. The competitive landscape is highly dynamic, with established players and emerging innovators engaging in strategic partnerships, product diversification, and continuous innovation to secure a leading position in this rapidly evolving market. Furthermore, increasing labor costs and the need to optimize warehouse operations are key factors driving market growth.
Dominant Markets & Segments in Automated Material Handling Equipment Market in APAC
Leading Region/Country: China continues to dominate the APAC automated material handling equipment market, driven by its vast manufacturing sector, substantial investments in advanced infrastructure, and a supportive government policy environment. India is experiencing rapid growth, propelled by its expanding economy, increasing industrialization, and a burgeoning need for efficient logistics solutions. Other significant markets include Japan, South Korea, and Australia, each contributing to the overall regional growth.
Dominant Segments:
- By Product Type: While hardware (including robots, conveyors, and AGVs) currently holds the largest market share, the software and services segments are experiencing rapid growth, driven by the increasing demand for sophisticated software solutions, integrated systems, predictive maintenance, and data analytics capabilities. This reflects a shift towards holistic solutions that optimize the entire material handling workflow.
- By Autonomy Type: Automatic systems, particularly AMRs and AGVs, are witnessing accelerated adoption rates, driven by their ability to enhance efficiency, productivity, and reduce labor costs. While manual systems still maintain a presence, especially in smaller enterprises or niche applications, the trend is decisively towards automation.
- By Equipment Type: Industrial trucks (forklifts, automated guided vehicles), conveyors, and robots remain the largest market segments. However, the "Others" category, encompassing advanced systems like automated storage and retrieval systems (AS/RS), automated guided carts (AGCs), and collaborative robots (cobots), is exhibiting substantial growth potential.
- By End-user Vertical: The automotive, e-commerce, food and beverage, and airport sectors are major drivers of market growth due to their high automation needs. The expanding e-commerce sector, particularly in China and India, is significantly boosting demand for efficient sorting, warehousing, and delivery solutions. The logistics and warehousing segment is also showing robust growth due to rising e-commerce activities and the need for optimized supply chains.
Key drivers for these dominant segments include strong government support for industrial automation initiatives, escalating labor costs, the imperative for improved supply chain efficiency, and the growing adoption of Industry 4.0 principles. China's robust manufacturing base and forward-looking industrial policies are particularly significant contributors to its market leadership. Japan's technological expertise and focus on advanced robotics also contribute substantially to its strong market position.
Automated Material Handling Equipment Market in APAC Product Innovations
Recent innovations include the development of collaborative robots (cobots) for safer and more flexible material handling, advanced AI-powered warehouse management systems, and autonomous mobile robots (AMRs) equipped with sophisticated navigation and obstacle avoidance capabilities. These innovations are enhancing efficiency, safety, and flexibility, improving market fit and providing competitive advantages. The trend is towards modular and customizable systems that cater to specific customer requirements and integrate seamlessly into existing infrastructure.
Report Segmentation & Scope
This report provides a comprehensive segmentation of the APAC automated material handling equipment market, offering granular insights into:
Country-specific analysis: Detailed market size, growth projections, and competitive landscapes for key countries including India, China, Japan, South Korea, Australia, and the Rest of Asia-Pacific are provided.
Product Type Segmentation: In-depth analysis of the Hardware, Software, and Services segments, including growth projections, market size estimations, and an assessment of competitive dynamics within each segment.
Autonomy Type Segmentation: Comprehensive analysis of the Automatic and Manual segments, detailing market size, growth projections, and competitive analysis for each type of system.
Equipment Type Segmentation: Detailed assessment of the market size, growth projections, and competitive landscape for Robots, Industrial trucks, Conveyors, and the “Others” category (AGVs, AS/RS, etc.).
End-user Vertical Segmentation: Analysis of the Airport, Automotive, Food and Beverage, E-commerce, Logistics & Warehousing, and other key end-user verticals, including market size, growth projections, and a competitive analysis for each.
Key Drivers of Automated Material Handling Equipment Market in APAC Growth
The APAC automated material handling equipment market is driven by several key factors: the burgeoning e-commerce sector demanding efficient order fulfillment, the increasing need for improved supply chain optimization, rising labor costs making automation cost-effective, government initiatives promoting industrial automation, and advancements in robotics and AI leading to more sophisticated and efficient equipment. These factors converge to create a strong growth trajectory for the market.
Challenges in the Automated Material Handling Equipment Market in APAC Sector
Significant challenges impacting the APAC automated material handling equipment market include the substantial initial investment required for automated systems, the need for skilled labor for system implementation, operation, and maintenance, cybersecurity concerns related to interconnected systems, and potential disruptions in global supply chains affecting equipment availability and pricing. Regulatory hurdles and the variations in safety and industry standards across different APAC countries also pose challenges. These factors can collectively moderate the market’s growth rate by approximately [Insert Updated Percentage]%. Addressing these challenges requires collaborative efforts between stakeholders including manufacturers, integrators, and government agencies to foster a supportive ecosystem for the widespread adoption of automated material handling solutions.
Leading Players in the Automated Material Handling Equipment Market in APAC Market
- Murata Machinery Ltd
- DAIFUKU Co Ltd
- TGW Logistics Group
- Geekplus Technology Co Ltd
- BEUMER Group
- Siasun Robot & Automation Co Ltd
- Toyota Industries Corporation
- Kardex Group
- Noblelift Intelligent Equipment Co Ltd
- XCMG Construction Machinery Co Ltd
- Cargotec corporation
- [Add other relevant players]
Key Developments in Automated Material Handling Equipment Market in APAC Sector
- Jan 2023: DAIFUKU Co Ltd launched a new generation of autonomous mobile robots.
- Mar 2022: Geekplus Technology Co Ltd secured a significant investment for expansion in the APAC region.
- Oct 2021: A major merger between two regional players in the industrial truck segment resulted in increased market consolidation.
Strategic Automated Material Handling Equipment Market in APAC Market Outlook
The APAC automated material handling equipment market presents significant growth potential. Continued investments in infrastructure development, increasing adoption of automation across various industries, and technological advancements will drive market expansion. Strategic opportunities exist for companies to focus on developing innovative solutions tailored to specific industry needs, exploring strategic partnerships, and investing in research and development to maintain a competitive edge. The market is expected to see a significant increase in the adoption of AI-powered solutions and the integration of IoT technologies in the coming years.
Automated Material Handling Equipment Market in APAC Segmentation
-
1. Product Type
- 1.1. Hardware
- 1.2. Software
- 1.3. Services
-
2. Autonomy Type
- 2.1. Automatic
- 2.2. Manual
-
3. Equipment Type
- 3.1. Robot
- 3.2. Industrial trucks
- 3.3. Conveyor
- 3.4. Others
-
4. End-user Vertical Type
- 4.1. Airport
- 4.2. Automotive
- 4.3. Food and Beverages
- 4.4. Others
Automated Material Handling Equipment Market in APAC Segmentation By Geography
-
1. North America
- 1.1. United States
- 1.2. Canada
- 1.3. Mexico
-
2. South America
- 2.1. Brazil
- 2.2. Argentina
- 2.3. Rest of South America
-
3. Europe
- 3.1. United Kingdom
- 3.2. Germany
- 3.3. France
- 3.4. Italy
- 3.5. Spain
- 3.6. Russia
- 3.7. Benelux
- 3.8. Nordics
- 3.9. Rest of Europe
-
4. Middle East & Africa
- 4.1. Turkey
- 4.2. Israel
- 4.3. GCC
- 4.4. North Africa
- 4.5. South Africa
- 4.6. Rest of Middle East & Africa
-
5. Asia Pacific
- 5.1. China
- 5.2. India
- 5.3. Japan
- 5.4. South Korea
- 5.5. ASEAN
- 5.6. Oceania
- 5.7. Rest of Asia Pacific
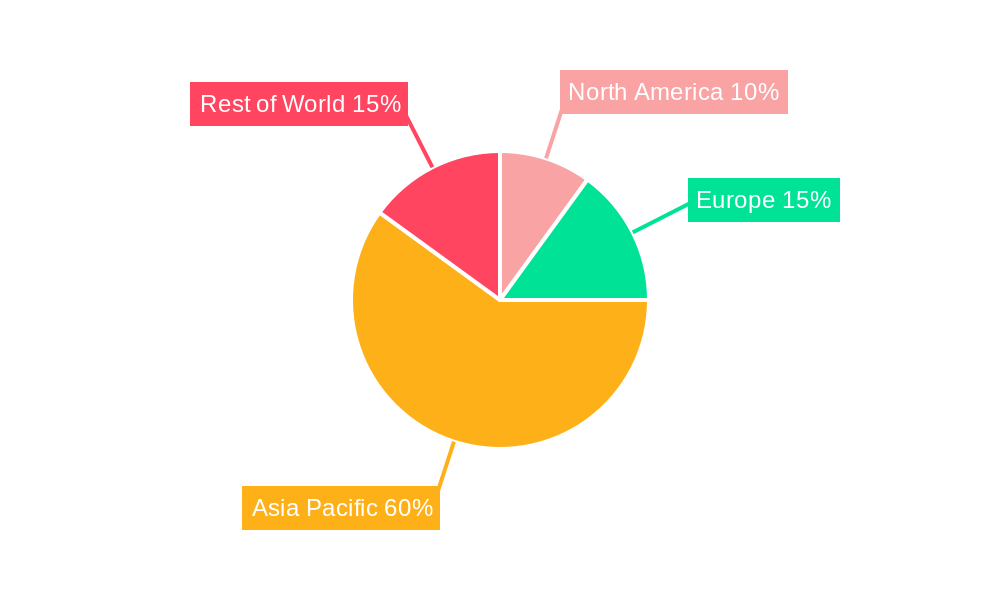
Automated Material Handling Equipment Market in APAC Regional Market Share
Geographic Coverage of Automated Material Handling Equipment Market in APAC
Automated Material Handling Equipment Market in APAC REPORT HIGHLIGHTS
| Aspects | Details |
|---|---|
| Study Period | 2020-2034 |
| Base Year | 2025 |
| Estimated Year | 2026 |
| Forecast Period | 2026-2034 |
| Historical Period | 2020-2025 |
| Growth Rate | CAGR of 8.9% from 2020-2034 |
| Segmentation |
|
Table of Contents
- 1. Introduction
- 1.1. Research Scope
- 1.2. Market Segmentation
- 1.3. Research Objective
- 1.4. Definitions and Assumptions
- 2. Executive Summary
- 2.1. Market Snapshot
- 3. Market Dynamics
- 3.1. Market Drivers
- 3.2. Market Restrains
- 3.3. Market Trends
- 3.4. Market Opportunities
- 4. Market Factor Analysis
- 4.1. Porters Five Forces
- 4.1.1. Bargaining Power of Suppliers
- 4.1.2. Bargaining Power of Buyers
- 4.1.3. Threat of New Entrants
- 4.1.4. Threat of Substitutes
- 4.1.5. Competitive Rivalry
- 4.2. PESTEL analysis
- 4.3. BCG Analysis
- 4.3.1. Stars (High Growth, High Market Share)
- 4.3.2. Cash Cows (Low Growth, High Market Share)
- 4.3.3. Question Mark (High Growth, Low Market Share)
- 4.3.4. Dogs (Low Growth, Low Market Share)
- 4.4. Ansoff Matrix Analysis
- 4.5. Supply Chain Analysis
- 4.6. Regulatory Landscape
- 4.7. Current Market Potential and Opportunity Assessment (TAM–SAM–SOM Framework)
- 4.8. PMV Analyst Note
- 4.1. Porters Five Forces
- 5. Market Analysis, Insights and Forecast 2021-2033
- 5.1. Market Analysis, Insights and Forecast - by Product Type
- 5.1.1. Hardware
- 5.1.2. Software
- 5.1.3. Services
- 5.2. Market Analysis, Insights and Forecast - by Autonomy Type
- 5.2.1. Automatic
- 5.2.2. Manual
- 5.3. Market Analysis, Insights and Forecast - by Equipment Type
- 5.3.1. Robot
- 5.3.2. Industrial trucks
- 5.3.3. Conveyor
- 5.3.4. Others
- 5.4. Market Analysis, Insights and Forecast - by End-user Vertical Type
- 5.4.1. Airport
- 5.4.2. Automotive
- 5.4.3. Food and Beverages
- 5.4.4. Others
- 5.5. Market Analysis, Insights and Forecast - by Region
- 5.5.1. North America
- 5.5.2. South America
- 5.5.3. Europe
- 5.5.4. Middle East & Africa
- 5.5.5. Asia Pacific
- 5.1. Market Analysis, Insights and Forecast - by Product Type
- 6. Global Automated Material Handling Equipment Market in APAC Analysis, Insights and Forecast, 2021-2033
- 6.1. Market Analysis, Insights and Forecast - by Product Type
- 6.1.1. Hardware
- 6.1.2. Software
- 6.1.3. Services
- 6.2. Market Analysis, Insights and Forecast - by Autonomy Type
- 6.2.1. Automatic
- 6.2.2. Manual
- 6.3. Market Analysis, Insights and Forecast - by Equipment Type
- 6.3.1. Robot
- 6.3.2. Industrial trucks
- 6.3.3. Conveyor
- 6.3.4. Others
- 6.4. Market Analysis, Insights and Forecast - by End-user Vertical Type
- 6.4.1. Airport
- 6.4.2. Automotive
- 6.4.3. Food and Beverages
- 6.4.4. Others
- 6.1. Market Analysis, Insights and Forecast - by Product Type
- 7. North America Automated Material Handling Equipment Market in APAC Analysis, Insights and Forecast, 2020-2032
- 7.1. Market Analysis, Insights and Forecast - by Product Type
- 7.1.1. Hardware
- 7.1.2. Software
- 7.1.3. Services
- 7.2. Market Analysis, Insights and Forecast - by Autonomy Type
- 7.2.1. Automatic
- 7.2.2. Manual
- 7.3. Market Analysis, Insights and Forecast - by Equipment Type
- 7.3.1. Robot
- 7.3.2. Industrial trucks
- 7.3.3. Conveyor
- 7.3.4. Others
- 7.4. Market Analysis, Insights and Forecast - by End-user Vertical Type
- 7.4.1. Airport
- 7.4.2. Automotive
- 7.4.3. Food and Beverages
- 7.4.4. Others
- 7.1. Market Analysis, Insights and Forecast - by Product Type
- 8. South America Automated Material Handling Equipment Market in APAC Analysis, Insights and Forecast, 2020-2032
- 8.1. Market Analysis, Insights and Forecast - by Product Type
- 8.1.1. Hardware
- 8.1.2. Software
- 8.1.3. Services
- 8.2. Market Analysis, Insights and Forecast - by Autonomy Type
- 8.2.1. Automatic
- 8.2.2. Manual
- 8.3. Market Analysis, Insights and Forecast - by Equipment Type
- 8.3.1. Robot
- 8.3.2. Industrial trucks
- 8.3.3. Conveyor
- 8.3.4. Others
- 8.4. Market Analysis, Insights and Forecast - by End-user Vertical Type
- 8.4.1. Airport
- 8.4.2. Automotive
- 8.4.3. Food and Beverages
- 8.4.4. Others
- 8.1. Market Analysis, Insights and Forecast - by Product Type
- 9. Europe Automated Material Handling Equipment Market in APAC Analysis, Insights and Forecast, 2020-2032
- 9.1. Market Analysis, Insights and Forecast - by Product Type
- 9.1.1. Hardware
- 9.1.2. Software
- 9.1.3. Services
- 9.2. Market Analysis, Insights and Forecast - by Autonomy Type
- 9.2.1. Automatic
- 9.2.2. Manual
- 9.3. Market Analysis, Insights and Forecast - by Equipment Type
- 9.3.1. Robot
- 9.3.2. Industrial trucks
- 9.3.3. Conveyor
- 9.3.4. Others
- 9.4. Market Analysis, Insights and Forecast - by End-user Vertical Type
- 9.4.1. Airport
- 9.4.2. Automotive
- 9.4.3. Food and Beverages
- 9.4.4. Others
- 9.1. Market Analysis, Insights and Forecast - by Product Type
- 10. Middle East & Africa Automated Material Handling Equipment Market in APAC Analysis, Insights and Forecast, 2020-2032
- 10.1. Market Analysis, Insights and Forecast - by Product Type
- 10.1.1. Hardware
- 10.1.2. Software
- 10.1.3. Services
- 10.2. Market Analysis, Insights and Forecast - by Autonomy Type
- 10.2.1. Automatic
- 10.2.2. Manual
- 10.3. Market Analysis, Insights and Forecast - by Equipment Type
- 10.3.1. Robot
- 10.3.2. Industrial trucks
- 10.3.3. Conveyor
- 10.3.4. Others
- 10.4. Market Analysis, Insights and Forecast - by End-user Vertical Type
- 10.4.1. Airport
- 10.4.2. Automotive
- 10.4.3. Food and Beverages
- 10.4.4. Others
- 10.1. Market Analysis, Insights and Forecast - by Product Type
- 11. Asia Pacific Automated Material Handling Equipment Market in APAC Analysis, Insights and Forecast, 2020-2032
- 11.1. Market Analysis, Insights and Forecast - by Product Type
- 11.1.1. Hardware
- 11.1.2. Software
- 11.1.3. Services
- 11.2. Market Analysis, Insights and Forecast - by Autonomy Type
- 11.2.1. Automatic
- 11.2.2. Manual
- 11.3. Market Analysis, Insights and Forecast - by Equipment Type
- 11.3.1. Robot
- 11.3.2. Industrial trucks
- 11.3.3. Conveyor
- 11.3.4. Others
- 11.4. Market Analysis, Insights and Forecast - by End-user Vertical Type
- 11.4.1. Airport
- 11.4.2. Automotive
- 11.4.3. Food and Beverages
- 11.4.4. Others
- 11.1. Market Analysis, Insights and Forecast - by Product Type
- 12. Competitive Analysis
- 12.1. Company Profiles
- 12.1.1 Murata Machinery Ltd
- 12.1.1.1. Company Overview
- 12.1.1.2. Products
- 12.1.1.3. Company Financials
- 12.1.1.4. SWOT Analysis
- 12.1.2 DAIFUKU Co Ltd
- 12.1.2.1. Company Overview
- 12.1.2.2. Products
- 12.1.2.3. Company Financials
- 12.1.2.4. SWOT Analysis
- 12.1.3 TGW Logistics Group
- 12.1.3.1. Company Overview
- 12.1.3.2. Products
- 12.1.3.3. Company Financials
- 12.1.3.4. SWOT Analysis
- 12.1.4 Geekplus Technology Co Ltd
- 12.1.4.1. Company Overview
- 12.1.4.2. Products
- 12.1.4.3. Company Financials
- 12.1.4.4. SWOT Analysis
- 12.1.5 BEUMER Group
- 12.1.5.1. Company Overview
- 12.1.5.2. Products
- 12.1.5.3. Company Financials
- 12.1.5.4. SWOT Analysis
- 12.1.6 Siasun Robot & Automation Co Ltd
- 12.1.6.1. Company Overview
- 12.1.6.2. Products
- 12.1.6.3. Company Financials
- 12.1.6.4. SWOT Analysis
- 12.1.7 Toyota Industries Corporation
- 12.1.7.1. Company Overview
- 12.1.7.2. Products
- 12.1.7.3. Company Financials
- 12.1.7.4. SWOT Analysis
- 12.1.8 Kardex Group
- 12.1.8.1. Company Overview
- 12.1.8.2. Products
- 12.1.8.3. Company Financials
- 12.1.8.4. SWOT Analysis
- 12.1.9 Noblelift Intelligent Equipment Co Ltd
- 12.1.9.1. Company Overview
- 12.1.9.2. Products
- 12.1.9.3. Company Financials
- 12.1.9.4. SWOT Analysis
- 12.1.10 XCMG Construction Machinery Co Ltd
- 12.1.10.1. Company Overview
- 12.1.10.2. Products
- 12.1.10.3. Company Financials
- 12.1.10.4. SWOT Analysis
- 12.1.11 Cargotec corporation
- 12.1.11.1. Company Overview
- 12.1.11.2. Products
- 12.1.11.3. Company Financials
- 12.1.11.4. SWOT Analysis
- 12.1.1 Murata Machinery Ltd
- 12.2. Market Entropy
- 12.2.1 Company's Key Areas Served
- 12.2.2 Recent Developments
- 12.3. Company Market Share Analysis 2025
- 12.3.1 Top 5 Companies Market Share Analysis
- 12.3.2 Top 3 Companies Market Share Analysis
- 12.4. List of Potential Customers
- 13. Research Methodology
List of Figures
- Figure 1: Global Automated Material Handling Equipment Market in APAC Revenue Breakdown (undefined, %) by Region 2025 & 2033
- Figure 2: North America Automated Material Handling Equipment Market in APAC Revenue (undefined), by Product Type 2025 & 2033
- Figure 3: North America Automated Material Handling Equipment Market in APAC Revenue Share (%), by Product Type 2025 & 2033
- Figure 4: North America Automated Material Handling Equipment Market in APAC Revenue (undefined), by Autonomy Type 2025 & 2033
- Figure 5: North America Automated Material Handling Equipment Market in APAC Revenue Share (%), by Autonomy Type 2025 & 2033
- Figure 6: North America Automated Material Handling Equipment Market in APAC Revenue (undefined), by Equipment Type 2025 & 2033
- Figure 7: North America Automated Material Handling Equipment Market in APAC Revenue Share (%), by Equipment Type 2025 & 2033
- Figure 8: North America Automated Material Handling Equipment Market in APAC Revenue (undefined), by End-user Vertical Type 2025 & 2033
- Figure 9: North America Automated Material Handling Equipment Market in APAC Revenue Share (%), by End-user Vertical Type 2025 & 2033
- Figure 10: North America Automated Material Handling Equipment Market in APAC Revenue (undefined), by Country 2025 & 2033
- Figure 11: North America Automated Material Handling Equipment Market in APAC Revenue Share (%), by Country 2025 & 2033
- Figure 12: South America Automated Material Handling Equipment Market in APAC Revenue (undefined), by Product Type 2025 & 2033
- Figure 13: South America Automated Material Handling Equipment Market in APAC Revenue Share (%), by Product Type 2025 & 2033
- Figure 14: South America Automated Material Handling Equipment Market in APAC Revenue (undefined), by Autonomy Type 2025 & 2033
- Figure 15: South America Automated Material Handling Equipment Market in APAC Revenue Share (%), by Autonomy Type 2025 & 2033
- Figure 16: South America Automated Material Handling Equipment Market in APAC Revenue (undefined), by Equipment Type 2025 & 2033
- Figure 17: South America Automated Material Handling Equipment Market in APAC Revenue Share (%), by Equipment Type 2025 & 2033
- Figure 18: South America Automated Material Handling Equipment Market in APAC Revenue (undefined), by End-user Vertical Type 2025 & 2033
- Figure 19: South America Automated Material Handling Equipment Market in APAC Revenue Share (%), by End-user Vertical Type 2025 & 2033
- Figure 20: South America Automated Material Handling Equipment Market in APAC Revenue (undefined), by Country 2025 & 2033
- Figure 21: South America Automated Material Handling Equipment Market in APAC Revenue Share (%), by Country 2025 & 2033
- Figure 22: Europe Automated Material Handling Equipment Market in APAC Revenue (undefined), by Product Type 2025 & 2033
- Figure 23: Europe Automated Material Handling Equipment Market in APAC Revenue Share (%), by Product Type 2025 & 2033
- Figure 24: Europe Automated Material Handling Equipment Market in APAC Revenue (undefined), by Autonomy Type 2025 & 2033
- Figure 25: Europe Automated Material Handling Equipment Market in APAC Revenue Share (%), by Autonomy Type 2025 & 2033
- Figure 26: Europe Automated Material Handling Equipment Market in APAC Revenue (undefined), by Equipment Type 2025 & 2033
- Figure 27: Europe Automated Material Handling Equipment Market in APAC Revenue Share (%), by Equipment Type 2025 & 2033
- Figure 28: Europe Automated Material Handling Equipment Market in APAC Revenue (undefined), by End-user Vertical Type 2025 & 2033
- Figure 29: Europe Automated Material Handling Equipment Market in APAC Revenue Share (%), by End-user Vertical Type 2025 & 2033
- Figure 30: Europe Automated Material Handling Equipment Market in APAC Revenue (undefined), by Country 2025 & 2033
- Figure 31: Europe Automated Material Handling Equipment Market in APAC Revenue Share (%), by Country 2025 & 2033
- Figure 32: Middle East & Africa Automated Material Handling Equipment Market in APAC Revenue (undefined), by Product Type 2025 & 2033
- Figure 33: Middle East & Africa Automated Material Handling Equipment Market in APAC Revenue Share (%), by Product Type 2025 & 2033
- Figure 34: Middle East & Africa Automated Material Handling Equipment Market in APAC Revenue (undefined), by Autonomy Type 2025 & 2033
- Figure 35: Middle East & Africa Automated Material Handling Equipment Market in APAC Revenue Share (%), by Autonomy Type 2025 & 2033
- Figure 36: Middle East & Africa Automated Material Handling Equipment Market in APAC Revenue (undefined), by Equipment Type 2025 & 2033
- Figure 37: Middle East & Africa Automated Material Handling Equipment Market in APAC Revenue Share (%), by Equipment Type 2025 & 2033
- Figure 38: Middle East & Africa Automated Material Handling Equipment Market in APAC Revenue (undefined), by End-user Vertical Type 2025 & 2033
- Figure 39: Middle East & Africa Automated Material Handling Equipment Market in APAC Revenue Share (%), by End-user Vertical Type 2025 & 2033
- Figure 40: Middle East & Africa Automated Material Handling Equipment Market in APAC Revenue (undefined), by Country 2025 & 2033
- Figure 41: Middle East & Africa Automated Material Handling Equipment Market in APAC Revenue Share (%), by Country 2025 & 2033
- Figure 42: Asia Pacific Automated Material Handling Equipment Market in APAC Revenue (undefined), by Product Type 2025 & 2033
- Figure 43: Asia Pacific Automated Material Handling Equipment Market in APAC Revenue Share (%), by Product Type 2025 & 2033
- Figure 44: Asia Pacific Automated Material Handling Equipment Market in APAC Revenue (undefined), by Autonomy Type 2025 & 2033
- Figure 45: Asia Pacific Automated Material Handling Equipment Market in APAC Revenue Share (%), by Autonomy Type 2025 & 2033
- Figure 46: Asia Pacific Automated Material Handling Equipment Market in APAC Revenue (undefined), by Equipment Type 2025 & 2033
- Figure 47: Asia Pacific Automated Material Handling Equipment Market in APAC Revenue Share (%), by Equipment Type 2025 & 2033
- Figure 48: Asia Pacific Automated Material Handling Equipment Market in APAC Revenue (undefined), by End-user Vertical Type 2025 & 2033
- Figure 49: Asia Pacific Automated Material Handling Equipment Market in APAC Revenue Share (%), by End-user Vertical Type 2025 & 2033
- Figure 50: Asia Pacific Automated Material Handling Equipment Market in APAC Revenue (undefined), by Country 2025 & 2033
- Figure 51: Asia Pacific Automated Material Handling Equipment Market in APAC Revenue Share (%), by Country 2025 & 2033
List of Tables
- Table 1: Global Automated Material Handling Equipment Market in APAC Revenue undefined Forecast, by Product Type 2020 & 2033
- Table 2: Global Automated Material Handling Equipment Market in APAC Revenue undefined Forecast, by Autonomy Type 2020 & 2033
- Table 3: Global Automated Material Handling Equipment Market in APAC Revenue undefined Forecast, by Equipment Type 2020 & 2033
- Table 4: Global Automated Material Handling Equipment Market in APAC Revenue undefined Forecast, by End-user Vertical Type 2020 & 2033
- Table 5: Global Automated Material Handling Equipment Market in APAC Revenue undefined Forecast, by Region 2020 & 2033
- Table 6: Global Automated Material Handling Equipment Market in APAC Revenue undefined Forecast, by Product Type 2020 & 2033
- Table 7: Global Automated Material Handling Equipment Market in APAC Revenue undefined Forecast, by Autonomy Type 2020 & 2033
- Table 8: Global Automated Material Handling Equipment Market in APAC Revenue undefined Forecast, by Equipment Type 2020 & 2033
- Table 9: Global Automated Material Handling Equipment Market in APAC Revenue undefined Forecast, by End-user Vertical Type 2020 & 2033
- Table 10: Global Automated Material Handling Equipment Market in APAC Revenue undefined Forecast, by Country 2020 & 2033
- Table 11: United States Automated Material Handling Equipment Market in APAC Revenue (undefined) Forecast, by Application 2020 & 2033
- Table 12: Canada Automated Material Handling Equipment Market in APAC Revenue (undefined) Forecast, by Application 2020 & 2033
- Table 13: Mexico Automated Material Handling Equipment Market in APAC Revenue (undefined) Forecast, by Application 2020 & 2033
- Table 14: Global Automated Material Handling Equipment Market in APAC Revenue undefined Forecast, by Product Type 2020 & 2033
- Table 15: Global Automated Material Handling Equipment Market in APAC Revenue undefined Forecast, by Autonomy Type 2020 & 2033
- Table 16: Global Automated Material Handling Equipment Market in APAC Revenue undefined Forecast, by Equipment Type 2020 & 2033
- Table 17: Global Automated Material Handling Equipment Market in APAC Revenue undefined Forecast, by End-user Vertical Type 2020 & 2033
- Table 18: Global Automated Material Handling Equipment Market in APAC Revenue undefined Forecast, by Country 2020 & 2033
- Table 19: Brazil Automated Material Handling Equipment Market in APAC Revenue (undefined) Forecast, by Application 2020 & 2033
- Table 20: Argentina Automated Material Handling Equipment Market in APAC Revenue (undefined) Forecast, by Application 2020 & 2033
- Table 21: Rest of South America Automated Material Handling Equipment Market in APAC Revenue (undefined) Forecast, by Application 2020 & 2033
- Table 22: Global Automated Material Handling Equipment Market in APAC Revenue undefined Forecast, by Product Type 2020 & 2033
- Table 23: Global Automated Material Handling Equipment Market in APAC Revenue undefined Forecast, by Autonomy Type 2020 & 2033
- Table 24: Global Automated Material Handling Equipment Market in APAC Revenue undefined Forecast, by Equipment Type 2020 & 2033
- Table 25: Global Automated Material Handling Equipment Market in APAC Revenue undefined Forecast, by End-user Vertical Type 2020 & 2033
- Table 26: Global Automated Material Handling Equipment Market in APAC Revenue undefined Forecast, by Country 2020 & 2033
- Table 27: United Kingdom Automated Material Handling Equipment Market in APAC Revenue (undefined) Forecast, by Application 2020 & 2033
- Table 28: Germany Automated Material Handling Equipment Market in APAC Revenue (undefined) Forecast, by Application 2020 & 2033
- Table 29: France Automated Material Handling Equipment Market in APAC Revenue (undefined) Forecast, by Application 2020 & 2033
- Table 30: Italy Automated Material Handling Equipment Market in APAC Revenue (undefined) Forecast, by Application 2020 & 2033
- Table 31: Spain Automated Material Handling Equipment Market in APAC Revenue (undefined) Forecast, by Application 2020 & 2033
- Table 32: Russia Automated Material Handling Equipment Market in APAC Revenue (undefined) Forecast, by Application 2020 & 2033
- Table 33: Benelux Automated Material Handling Equipment Market in APAC Revenue (undefined) Forecast, by Application 2020 & 2033
- Table 34: Nordics Automated Material Handling Equipment Market in APAC Revenue (undefined) Forecast, by Application 2020 & 2033
- Table 35: Rest of Europe Automated Material Handling Equipment Market in APAC Revenue (undefined) Forecast, by Application 2020 & 2033
- Table 36: Global Automated Material Handling Equipment Market in APAC Revenue undefined Forecast, by Product Type 2020 & 2033
- Table 37: Global Automated Material Handling Equipment Market in APAC Revenue undefined Forecast, by Autonomy Type 2020 & 2033
- Table 38: Global Automated Material Handling Equipment Market in APAC Revenue undefined Forecast, by Equipment Type 2020 & 2033
- Table 39: Global Automated Material Handling Equipment Market in APAC Revenue undefined Forecast, by End-user Vertical Type 2020 & 2033
- Table 40: Global Automated Material Handling Equipment Market in APAC Revenue undefined Forecast, by Country 2020 & 2033
- Table 41: Turkey Automated Material Handling Equipment Market in APAC Revenue (undefined) Forecast, by Application 2020 & 2033
- Table 42: Israel Automated Material Handling Equipment Market in APAC Revenue (undefined) Forecast, by Application 2020 & 2033
- Table 43: GCC Automated Material Handling Equipment Market in APAC Revenue (undefined) Forecast, by Application 2020 & 2033
- Table 44: North Africa Automated Material Handling Equipment Market in APAC Revenue (undefined) Forecast, by Application 2020 & 2033
- Table 45: South Africa Automated Material Handling Equipment Market in APAC Revenue (undefined) Forecast, by Application 2020 & 2033
- Table 46: Rest of Middle East & Africa Automated Material Handling Equipment Market in APAC Revenue (undefined) Forecast, by Application 2020 & 2033
- Table 47: Global Automated Material Handling Equipment Market in APAC Revenue undefined Forecast, by Product Type 2020 & 2033
- Table 48: Global Automated Material Handling Equipment Market in APAC Revenue undefined Forecast, by Autonomy Type 2020 & 2033
- Table 49: Global Automated Material Handling Equipment Market in APAC Revenue undefined Forecast, by Equipment Type 2020 & 2033
- Table 50: Global Automated Material Handling Equipment Market in APAC Revenue undefined Forecast, by End-user Vertical Type 2020 & 2033
- Table 51: Global Automated Material Handling Equipment Market in APAC Revenue undefined Forecast, by Country 2020 & 2033
- Table 52: China Automated Material Handling Equipment Market in APAC Revenue (undefined) Forecast, by Application 2020 & 2033
- Table 53: India Automated Material Handling Equipment Market in APAC Revenue (undefined) Forecast, by Application 2020 & 2033
- Table 54: Japan Automated Material Handling Equipment Market in APAC Revenue (undefined) Forecast, by Application 2020 & 2033
- Table 55: South Korea Automated Material Handling Equipment Market in APAC Revenue (undefined) Forecast, by Application 2020 & 2033
- Table 56: ASEAN Automated Material Handling Equipment Market in APAC Revenue (undefined) Forecast, by Application 2020 & 2033
- Table 57: Oceania Automated Material Handling Equipment Market in APAC Revenue (undefined) Forecast, by Application 2020 & 2033
- Table 58: Rest of Asia Pacific Automated Material Handling Equipment Market in APAC Revenue (undefined) Forecast, by Application 2020 & 2033
Frequently Asked Questions
1. What is the projected Compound Annual Growth Rate (CAGR) of the Automated Material Handling Equipment Market in APAC?
The projected CAGR is approximately 8.9%.
2. Which companies are prominent players in the Automated Material Handling Equipment Market in APAC?
Key companies in the market include Murata Machinery Ltd, DAIFUKU Co Ltd, TGW Logistics Group, Geekplus Technology Co Ltd, BEUMER Group, Siasun Robot & Automation Co Ltd, Toyota Industries Corporation, Kardex Group, Noblelift Intelligent Equipment Co Ltd, XCMG Construction Machinery Co Ltd, Cargotec corporation.
3. What are the main segments of the Automated Material Handling Equipment Market in APAC?
The market segments include Product Type, Autonomy Type, Equipment Type, End-user Vertical Type.
4. Can you provide details about the market size?
The market size is estimated to be USD XXX N/A as of 2022.
5. What are some drivers contributing to market growth?
Buyers Inclination Toward Affordable Used Cars to Fuel the Market Growth.
6. What are the notable trends driving market growth?
Electric Material Handling Equipment are Driving the Market.
7. Are there any restraints impacting market growth?
Technology Advances. Older Used Cars May Lack the Latest Features.
8. Can you provide examples of recent developments in the market?
N/A
9. What pricing options are available for accessing the report?
Pricing options include single-user, multi-user, and enterprise licenses priced at USD 3800, USD 4500, and USD 5800 respectively.
10. Is the market size provided in terms of value or volume?
The market size is provided in terms of value, measured in N/A.
11. Are there any specific market keywords associated with the report?
Yes, the market keyword associated with the report is "Automated Material Handling Equipment Market in APAC," which aids in identifying and referencing the specific market segment covered.
12. How do I determine which pricing option suits my needs best?
The pricing options vary based on user requirements and access needs. Individual users may opt for single-user licenses, while businesses requiring broader access may choose multi-user or enterprise licenses for cost-effective access to the report.
13. Are there any additional resources or data provided in the Automated Material Handling Equipment Market in APAC report?
While the report offers comprehensive insights, it's advisable to review the specific contents or supplementary materials provided to ascertain if additional resources or data are available.
14. How can I stay updated on further developments or reports in the Automated Material Handling Equipment Market in APAC?
To stay informed about further developments, trends, and reports in the Automated Material Handling Equipment Market in APAC, consider subscribing to industry newsletters, following relevant companies and organizations, or regularly checking reputable industry news sources and publications.
Methodology
Step 1 - Identification of Relevant Samples Size from Population Database


Step 2 - Approaches for Defining Global Market Size (Value, Volume* & Price*)

Note*: In applicable scenarios
Step 3 - Data Sources
Primary Research
- Web Analytics
- Survey Reports
- Research Institute
- Latest Research Reports
- Opinion Leaders
Secondary Research
- Annual Reports
- White Paper
- Latest Press Release
- Industry Association
- Paid Database
- Investor Presentations

Step 4 - Data Triangulation
Involves using different sources of information in order to increase the validity of a study
These sources are likely to be stakeholders in a program - participants, other researchers, program staff, other community members, and so on.
Then we put all data in single framework & apply various statistical tools to find out the dynamic on the market.
During the analysis stage, feedback from the stakeholder groups would be compared to determine areas of agreement as well as areas of divergence