
Key Insights
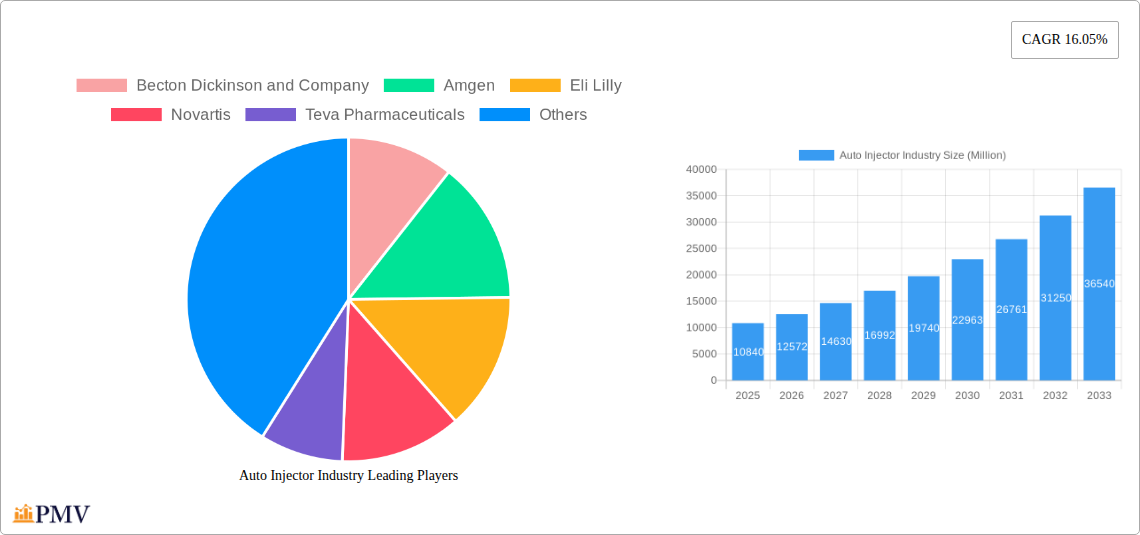
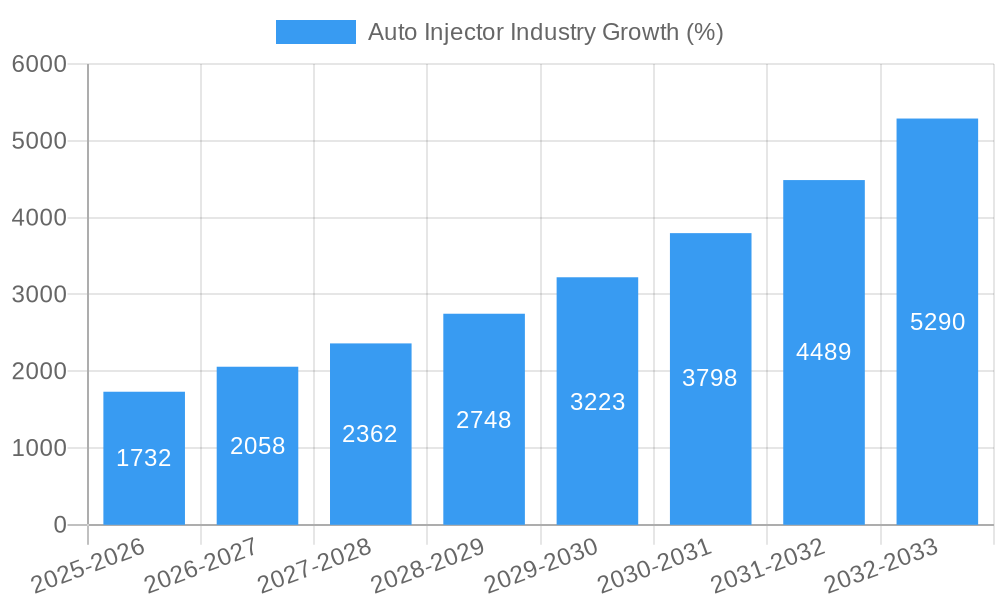
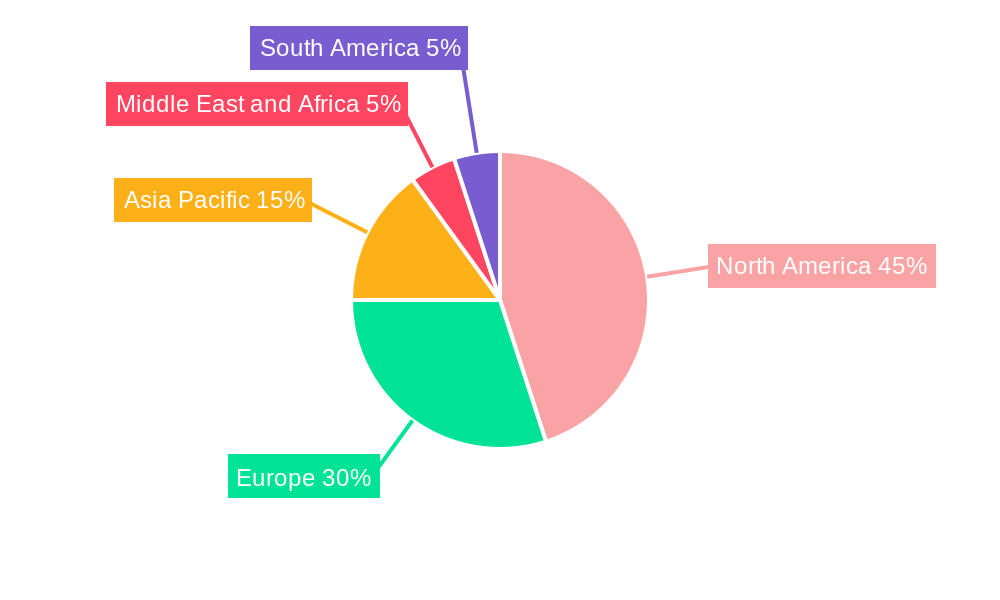
The global auto injector market is experiencing robust growth, projected to reach \$10.84 billion in 2025 and maintain a Compound Annual Growth Rate (CAGR) of 16.05% from 2025 to 2033. This expansion is fueled by several key factors. The rising prevalence of chronic diseases like rheumatoid arthritis, multiple sclerosis, and anaphylaxis is driving demand for convenient and reliable self-injection solutions. Auto injectors offer a significant advantage over traditional injection methods, providing improved patient compliance and reduced risk of injection errors. Furthermore, continuous advancements in auto injector technology, such as the development of smaller, more user-friendly devices and the incorporation of smart features, are further enhancing market appeal. The market is segmented by end-user (home care settings, hospitals & clinics, and other end-users), application (rheumatoid arthritis, multiple sclerosis, anaphylaxis, and others), and type (disposable and reusable auto injectors). North America currently holds a significant market share, driven by high healthcare expenditure and a large patient population with chronic diseases. However, the Asia-Pacific region is expected to witness substantial growth in the coming years due to increasing healthcare awareness, rising disposable incomes, and expanding healthcare infrastructure. The competitive landscape includes major pharmaceutical and medical device companies like Becton Dickinson, Amgen, Eli Lilly, and others, each vying for market share through product innovation and strategic partnerships.
The market's growth trajectory is projected to continue through 2033, propelled by factors such as the increasing geriatric population globally, which correlates with a higher prevalence of chronic diseases requiring injectable therapies. The ongoing research and development efforts focused on improving the efficacy, safety, and usability of auto injectors are also expected to contribute significantly to market growth. While potential restraints like stringent regulatory approvals and the high cost of advanced auto injectors exist, the overall market outlook remains positive. The increasing preference for convenient self-administration of medications at home, coupled with the supportive regulatory landscape in key markets, is expected to drive further adoption of auto injector systems, making it a lucrative market for players involved in its development and distribution.
Auto Injector Industry Market Report: 2019-2033
This comprehensive report provides a detailed analysis of the global auto injector industry, offering invaluable insights for stakeholders seeking to navigate this dynamic market. With a study period spanning 2019-2033, a base year of 2025, and a forecast period of 2025-2033, this report delivers a robust understanding of past performance, current trends, and future projections. The report's detailed segmentation, competitive analysis, and growth projections make it an essential resource for strategic decision-making. The market is estimated to be worth xx Million in 2025 and is projected to reach xx Million by 2033.
Auto Injector Industry Market Structure & Competitive Dynamics
The auto injector market exhibits a moderately concentrated structure, with several major players commanding significant market share. Companies like Becton Dickinson and Company, Amgen, Eli Lilly, Novartis, Teva Pharmaceuticals, Biogen, AstraZeneca, Abbvie, Ypsomed, and Bayer hold substantial influence, driving innovation and shaping market trends. Market concentration is further influenced by factors such as regulatory approvals, intellectual property rights, and technological advancements. The competitive landscape is characterized by intense R&D efforts focusing on improved device design, ease of use, and safety features. Mergers and acquisitions (M&A) play a crucial role in market consolidation and expansion. For instance, recent deals (e.g., Stevanato Group's agreement with Owen Mumford) have reshaped the competitive dynamics. Overall, the market share of the top five players is estimated at approximately 60% in 2025. Recent M&A activities have involved deals valued in the hundreds of Millions of dollars, indicating a substantial level of investment in the sector. Further consolidation is expected over the forecast period, with a potential increase in both organic growth and strategic acquisitions by leading market players.
- Market Concentration: Moderately concentrated, with top 5 players controlling approximately 60% of market share (2025).
- Innovation Ecosystems: Driven by pharmaceutical companies, medical device manufacturers, and technology providers.
- Regulatory Frameworks: Stringent regulations impacting product development, approval, and market access.
- Product Substitutes: Limited direct substitutes, though alternative drug delivery methods exist.
- End-User Trends: Increasing demand from home care settings and self-administration preferences.
- M&A Activities: Several significant deals impacting market structure and competitiveness (values in the hundreds of Millions of dollars).
Auto Injector Industry Industry Trends & Insights
The auto injector market is experiencing robust growth, fueled by several key factors. The rising prevalence of chronic diseases such as rheumatoid arthritis, multiple sclerosis, and diabetes is a primary driver. These conditions necessitate frequent and consistent medication administration, making auto injectors a convenient and effective solution. Technological advancements are also contributing significantly, with innovations focused on improving device design, reducing injection pain, and enhancing patient compliance. The market is witnessing increasing demand for disposable auto injectors due to their convenience and hygiene benefits. However, reusable auto injectors are gaining traction owing to their cost-effectiveness. The market is characterized by a strong focus on improving patient experience, evidenced by the development of smaller, more comfortable devices. The CAGR for the global auto injector market is projected to be xx% during the forecast period (2025-2033), with significant market penetration driven by increasing healthcare spending and aging populations. Competitive dynamics are intensified by ongoing innovation, strategic partnerships, and the introduction of novel drug delivery technologies.
Dominant Markets & Segments in Auto Injector Industry
The North American market currently dominates the global auto injector landscape, driven by high healthcare expenditure, a large aging population, and a robust pharmaceutical industry. Within the segmented market:
By End User:
- Home Care Settings: This segment is experiencing the fastest growth due to the increasing preference for self-administration and a rise in chronic diseases.
- Hospital & Clinics: This segment maintains a substantial market share, serving as a critical delivery point for initial treatments and specialized applications.
- Other End Users: This segment includes research institutions and clinical trial settings.
By Application:
- Rheumatoid Arthritis, Multiple Sclerosis, Anaphylaxis: These applications represent major revenue-generating segments, each exhibiting significant growth potential.
- Other Applications (Cardiovascular Diseases, Diabetes, Migraines, Psoriasis, and Anemia): This category is expected to witness substantial expansion over the forecast period, driven by the increasing prevalence of these conditions.
By Type:
- Disposable Autoinjectors: Holds the largest market share due to convenience and hygiene, though reusable options are gaining traction.
- Reusable Autoinjectors: This segment is experiencing increased growth due to cost-effectiveness and environmental considerations.
Key drivers for regional dominance include strong economic conditions, well-established healthcare infrastructure, and favorable regulatory environments. The European and Asian markets are expected to witness significant growth in the coming years, propelled by increasing healthcare investments and rising disease prevalence.
Auto Injector Industry Product Innovations
Recent product developments emphasize improved user-friendliness, enhanced safety features, and reduced injection pain. The introduction of platforms like Jabil Healthcare's Qfinity autoinjector, which prioritizes reusability and cost-effectiveness, showcases a trend towards innovative, patient-centric designs. This aligns with the market's focus on reducing healthcare costs while ensuring efficient drug delivery. These innovations are driving market growth and creating new competitive advantages for manufacturers.
Report Segmentation & Scope
This report segments the auto injector market based on end-user (home care settings, hospital & clinics, other end users), application (rheumatoid arthritis, multiple sclerosis, anaphylaxis, other applications), and type (disposable, reusable). Each segment's growth projections, market size estimates, and competitive dynamics are meticulously analyzed, providing a granular understanding of the market's composition. Growth rates vary across segments, with home care settings and specific applications exhibiting faster expansion. Competitive intensity also varies, depending on the level of innovation and the number of active players within each segment.
Key Drivers of Auto Injector Industry Growth
Several factors are accelerating growth in this sector. Technological advancements resulting in more user-friendly and efficient devices are significant. The rising prevalence of chronic diseases necessitating self-administered injections is another major driver. Finally, favorable regulatory environments and increasing healthcare spending further support market expansion. The increasing number of biopharmaceuticals administered via injection is also a key factor.
Challenges in the Auto Injector Industry Sector
Stringent regulatory requirements for medical devices can pose challenges to market entry and product approval. Supply chain disruptions can impact production and availability, leading to potential delays and cost increases. Intense competition from established and emerging players adds pressure on profit margins and market share. These factors create challenges to consistent growth.
Leading Players in the Auto Injector Industry Market
- Becton Dickinson and Company
- Amgen
- Eli Lilly
- Novartis
- Teva Pharmaceuticals
- Biogen
- AstraZeneca
- Abbvie
- Ypsomed
- Bayer
Key Developments in Auto Injector Industry Sector
- May 2022: Jabil Healthcare launched the Qfinity autoinjector platform, a reusable and modular solution, impacting the market with a lower-cost alternative.
- May 2022: Stevanato Group signed an exclusive agreement with Owen Mumford for its Aidaptus auto-injector, influencing market share and distribution.
Strategic Auto Injector Industry Market Outlook
The auto injector market presents significant growth opportunities. Continued innovation focused on improving patient experience and reducing costs will be crucial. Expansion into emerging markets and strategic partnerships with pharmaceutical companies will drive future growth. The increasing prevalence of chronic diseases and the ongoing shift towards self-administered therapies will create sustained demand for auto injectors over the forecast period.
Auto Injector Industry Segmentation
-
1. Application
- 1.1. Rheumatoid Arthritis
- 1.2. Multiple Sclerosis
- 1.3. Anaphylaxis
- 1.4. Other Ap
-
2. Type
- 2.1. Disposable Autoinjectors
- 2.2. Reusable Autoinjectors
-
3. End User
- 3.1. Home Care Settings
- 3.2. Hospital & Clinics
- 3.3. Other End Users
Auto Injector Industry Segmentation By Geography
-
1. North America
- 1.1. United States
- 1.2. Canada
- 1.3. Mexico
-
2. Europe
- 2.1. Germany
- 2.2. United Kingdom
- 2.3. France
- 2.4. Italy
- 2.5. Spain
- 2.6. Rest of Europe
-
3. Asia Pacific
- 3.1. China
- 3.2. Japan
- 3.3. India
- 3.4. Australia
- 3.5. South Korea
- 3.6. Rest of Asia Pacific
-
4. Middle East and Africa
- 4.1. GCC
- 4.2. South Africa
- 4.3. Rest of Middle East and Africa
-
5. South America
- 5.1. Brazil
- 5.2. Argentina
- 5.3. Rest of South America
Auto Injector Industry REPORT HIGHLIGHTS
| Aspects | Details |
|---|---|
| Study Period | 2019-2033 |
| Base Year | 2024 |
| Estimated Year | 2025 |
| Forecast Period | 2025-2033 |
| Historical Period | 2019-2024 |
| Growth Rate | CAGR of 16.05% from 2019-2033 |
| Segmentation |
|
Table of Contents
- 1. Introduction
- 1.1. Research Scope
- 1.2. Market Segmentation
- 1.3. Research Methodology
- 1.4. Definitions and Assumptions
- 2. Executive Summary
- 2.1. Introduction
- 3. Market Dynamics
- 3.1. Introduction
- 3.2. Market Drivers
- 3.2.1. Increasing Demand for Convenience of Patients; Rising Incidence of Chronic and Lifestyle Diseases; Technological Advancements
- 3.3. Market Restrains
- 3.3.1. Preference for Alternative Drug Delivery Modes; Regulatory Hurdles
- 3.4. Market Trends
- 3.4.1. Rheumatoid Arthritis Expected to Hold Significant Market Share Over the Forecast Period
- 4. Market Factor Analysis
- 4.1. Porters Five Forces
- 4.2. Supply/Value Chain
- 4.3. PESTEL analysis
- 4.4. Market Entropy
- 4.5. Patent/Trademark Analysis
- 5. Global Auto Injector Industry Analysis, Insights and Forecast, 2019-2031
- 5.1. Market Analysis, Insights and Forecast - by Application
- 5.1.1. Rheumatoid Arthritis
- 5.1.2. Multiple Sclerosis
- 5.1.3. Anaphylaxis
- 5.1.4. Other Ap
- 5.2. Market Analysis, Insights and Forecast - by Type
- 5.2.1. Disposable Autoinjectors
- 5.2.2. Reusable Autoinjectors
- 5.3. Market Analysis, Insights and Forecast - by End User
- 5.3.1. Home Care Settings
- 5.3.2. Hospital & Clinics
- 5.3.3. Other End Users
- 5.4. Market Analysis, Insights and Forecast - by Region
- 5.4.1. North America
- 5.4.2. Europe
- 5.4.3. Asia Pacific
- 5.4.4. Middle East and Africa
- 5.4.5. South America
- 5.1. Market Analysis, Insights and Forecast - by Application
- 6. North America Auto Injector Industry Analysis, Insights and Forecast, 2019-2031
- 6.1. Market Analysis, Insights and Forecast - by Application
- 6.1.1. Rheumatoid Arthritis
- 6.1.2. Multiple Sclerosis
- 6.1.3. Anaphylaxis
- 6.1.4. Other Ap
- 6.2. Market Analysis, Insights and Forecast - by Type
- 6.2.1. Disposable Autoinjectors
- 6.2.2. Reusable Autoinjectors
- 6.3. Market Analysis, Insights and Forecast - by End User
- 6.3.1. Home Care Settings
- 6.3.2. Hospital & Clinics
- 6.3.3. Other End Users
- 6.1. Market Analysis, Insights and Forecast - by Application
- 7. Europe Auto Injector Industry Analysis, Insights and Forecast, 2019-2031
- 7.1. Market Analysis, Insights and Forecast - by Application
- 7.1.1. Rheumatoid Arthritis
- 7.1.2. Multiple Sclerosis
- 7.1.3. Anaphylaxis
- 7.1.4. Other Ap
- 7.2. Market Analysis, Insights and Forecast - by Type
- 7.2.1. Disposable Autoinjectors
- 7.2.2. Reusable Autoinjectors
- 7.3. Market Analysis, Insights and Forecast - by End User
- 7.3.1. Home Care Settings
- 7.3.2. Hospital & Clinics
- 7.3.3. Other End Users
- 7.1. Market Analysis, Insights and Forecast - by Application
- 8. Asia Pacific Auto Injector Industry Analysis, Insights and Forecast, 2019-2031
- 8.1. Market Analysis, Insights and Forecast - by Application
- 8.1.1. Rheumatoid Arthritis
- 8.1.2. Multiple Sclerosis
- 8.1.3. Anaphylaxis
- 8.1.4. Other Ap
- 8.2. Market Analysis, Insights and Forecast - by Type
- 8.2.1. Disposable Autoinjectors
- 8.2.2. Reusable Autoinjectors
- 8.3. Market Analysis, Insights and Forecast - by End User
- 8.3.1. Home Care Settings
- 8.3.2. Hospital & Clinics
- 8.3.3. Other End Users
- 8.1. Market Analysis, Insights and Forecast - by Application
- 9. Middle East and Africa Auto Injector Industry Analysis, Insights and Forecast, 2019-2031
- 9.1. Market Analysis, Insights and Forecast - by Application
- 9.1.1. Rheumatoid Arthritis
- 9.1.2. Multiple Sclerosis
- 9.1.3. Anaphylaxis
- 9.1.4. Other Ap
- 9.2. Market Analysis, Insights and Forecast - by Type
- 9.2.1. Disposable Autoinjectors
- 9.2.2. Reusable Autoinjectors
- 9.3. Market Analysis, Insights and Forecast - by End User
- 9.3.1. Home Care Settings
- 9.3.2. Hospital & Clinics
- 9.3.3. Other End Users
- 9.1. Market Analysis, Insights and Forecast - by Application
- 10. South America Auto Injector Industry Analysis, Insights and Forecast, 2019-2031
- 10.1. Market Analysis, Insights and Forecast - by Application
- 10.1.1. Rheumatoid Arthritis
- 10.1.2. Multiple Sclerosis
- 10.1.3. Anaphylaxis
- 10.1.4. Other Ap
- 10.2. Market Analysis, Insights and Forecast - by Type
- 10.2.1. Disposable Autoinjectors
- 10.2.2. Reusable Autoinjectors
- 10.3. Market Analysis, Insights and Forecast - by End User
- 10.3.1. Home Care Settings
- 10.3.2. Hospital & Clinics
- 10.3.3. Other End Users
- 10.1. Market Analysis, Insights and Forecast - by Application
- 11. North America Auto Injector Industry Analysis, Insights and Forecast, 2019-2031
- 11.1. Market Analysis, Insights and Forecast - By Country/Sub-region
- 11.1.1 United States
- 11.1.2 Canada
- 11.1.3 Mexico
- 12. Europe Auto Injector Industry Analysis, Insights and Forecast, 2019-2031
- 12.1. Market Analysis, Insights and Forecast - By Country/Sub-region
- 12.1.1 Germany
- 12.1.2 United Kingdom
- 12.1.3 France
- 12.1.4 Italy
- 12.1.5 Spain
- 12.1.6 Rest of Europe
- 13. Asia Pacific Auto Injector Industry Analysis, Insights and Forecast, 2019-2031
- 13.1. Market Analysis, Insights and Forecast - By Country/Sub-region
- 13.1.1 China
- 13.1.2 Japan
- 13.1.3 India
- 13.1.4 Australia
- 13.1.5 South Korea
- 13.1.6 Rest of Asia Pacific
- 14. Middle East and Africa Auto Injector Industry Analysis, Insights and Forecast, 2019-2031
- 14.1. Market Analysis, Insights and Forecast - By Country/Sub-region
- 14.1.1 GCC
- 14.1.2 South Africa
- 14.1.3 Rest of Middle East and Africa
- 15. South America Auto Injector Industry Analysis, Insights and Forecast, 2019-2031
- 15.1. Market Analysis, Insights and Forecast - By Country/Sub-region
- 15.1.1 Brazil
- 15.1.2 Argentina
- 15.1.3 Rest of South America
- 16. Competitive Analysis
- 16.1. Global Market Share Analysis 2024
- 16.2. Company Profiles
- 16.2.1 Becton Dickinson and Company
- 16.2.1.1. Overview
- 16.2.1.2. Products
- 16.2.1.3. SWOT Analysis
- 16.2.1.4. Recent Developments
- 16.2.1.5. Financials (Based on Availability)
- 16.2.2 Amgen
- 16.2.2.1. Overview
- 16.2.2.2. Products
- 16.2.2.3. SWOT Analysis
- 16.2.2.4. Recent Developments
- 16.2.2.5. Financials (Based on Availability)
- 16.2.3 Eli Lilly
- 16.2.3.1. Overview
- 16.2.3.2. Products
- 16.2.3.3. SWOT Analysis
- 16.2.3.4. Recent Developments
- 16.2.3.5. Financials (Based on Availability)
- 16.2.4 Novartis
- 16.2.4.1. Overview
- 16.2.4.2. Products
- 16.2.4.3. SWOT Analysis
- 16.2.4.4. Recent Developments
- 16.2.4.5. Financials (Based on Availability)
- 16.2.5 Teva Pharmaceuticals
- 16.2.5.1. Overview
- 16.2.5.2. Products
- 16.2.5.3. SWOT Analysis
- 16.2.5.4. Recent Developments
- 16.2.5.5. Financials (Based on Availability)
- 16.2.6 Biogen
- 16.2.6.1. Overview
- 16.2.6.2. Products
- 16.2.6.3. SWOT Analysis
- 16.2.6.4. Recent Developments
- 16.2.6.5. Financials (Based on Availability)
- 16.2.7 AstraZeneca
- 16.2.7.1. Overview
- 16.2.7.2. Products
- 16.2.7.3. SWOT Analysis
- 16.2.7.4. Recent Developments
- 16.2.7.5. Financials (Based on Availability)
- 16.2.8 Abbvie
- 16.2.8.1. Overview
- 16.2.8.2. Products
- 16.2.8.3. SWOT Analysis
- 16.2.8.4. Recent Developments
- 16.2.8.5. Financials (Based on Availability)
- 16.2.9 Ypsomed*List Not Exhaustive
- 16.2.9.1. Overview
- 16.2.9.2. Products
- 16.2.9.3. SWOT Analysis
- 16.2.9.4. Recent Developments
- 16.2.9.5. Financials (Based on Availability)
- 16.2.10 Bayer
- 16.2.10.1. Overview
- 16.2.10.2. Products
- 16.2.10.3. SWOT Analysis
- 16.2.10.4. Recent Developments
- 16.2.10.5. Financials (Based on Availability)
- 16.2.1 Becton Dickinson and Company
List of Figures
- Figure 1: Global Auto Injector Industry Revenue Breakdown (Million, %) by Region 2024 & 2032
- Figure 2: North America Auto Injector Industry Revenue (Million), by Country 2024 & 2032
- Figure 3: North America Auto Injector Industry Revenue Share (%), by Country 2024 & 2032
- Figure 4: Europe Auto Injector Industry Revenue (Million), by Country 2024 & 2032
- Figure 5: Europe Auto Injector Industry Revenue Share (%), by Country 2024 & 2032
- Figure 6: Asia Pacific Auto Injector Industry Revenue (Million), by Country 2024 & 2032
- Figure 7: Asia Pacific Auto Injector Industry Revenue Share (%), by Country 2024 & 2032
- Figure 8: Middle East and Africa Auto Injector Industry Revenue (Million), by Country 2024 & 2032
- Figure 9: Middle East and Africa Auto Injector Industry Revenue Share (%), by Country 2024 & 2032
- Figure 10: South America Auto Injector Industry Revenue (Million), by Country 2024 & 2032
- Figure 11: South America Auto Injector Industry Revenue Share (%), by Country 2024 & 2032
- Figure 12: North America Auto Injector Industry Revenue (Million), by Application 2024 & 2032
- Figure 13: North America Auto Injector Industry Revenue Share (%), by Application 2024 & 2032
- Figure 14: North America Auto Injector Industry Revenue (Million), by Type 2024 & 2032
- Figure 15: North America Auto Injector Industry Revenue Share (%), by Type 2024 & 2032
- Figure 16: North America Auto Injector Industry Revenue (Million), by End User 2024 & 2032
- Figure 17: North America Auto Injector Industry Revenue Share (%), by End User 2024 & 2032
- Figure 18: North America Auto Injector Industry Revenue (Million), by Country 2024 & 2032
- Figure 19: North America Auto Injector Industry Revenue Share (%), by Country 2024 & 2032
- Figure 20: Europe Auto Injector Industry Revenue (Million), by Application 2024 & 2032
- Figure 21: Europe Auto Injector Industry Revenue Share (%), by Application 2024 & 2032
- Figure 22: Europe Auto Injector Industry Revenue (Million), by Type 2024 & 2032
- Figure 23: Europe Auto Injector Industry Revenue Share (%), by Type 2024 & 2032
- Figure 24: Europe Auto Injector Industry Revenue (Million), by End User 2024 & 2032
- Figure 25: Europe Auto Injector Industry Revenue Share (%), by End User 2024 & 2032
- Figure 26: Europe Auto Injector Industry Revenue (Million), by Country 2024 & 2032
- Figure 27: Europe Auto Injector Industry Revenue Share (%), by Country 2024 & 2032
- Figure 28: Asia Pacific Auto Injector Industry Revenue (Million), by Application 2024 & 2032
- Figure 29: Asia Pacific Auto Injector Industry Revenue Share (%), by Application 2024 & 2032
- Figure 30: Asia Pacific Auto Injector Industry Revenue (Million), by Type 2024 & 2032
- Figure 31: Asia Pacific Auto Injector Industry Revenue Share (%), by Type 2024 & 2032
- Figure 32: Asia Pacific Auto Injector Industry Revenue (Million), by End User 2024 & 2032
- Figure 33: Asia Pacific Auto Injector Industry Revenue Share (%), by End User 2024 & 2032
- Figure 34: Asia Pacific Auto Injector Industry Revenue (Million), by Country 2024 & 2032
- Figure 35: Asia Pacific Auto Injector Industry Revenue Share (%), by Country 2024 & 2032
- Figure 36: Middle East and Africa Auto Injector Industry Revenue (Million), by Application 2024 & 2032
- Figure 37: Middle East and Africa Auto Injector Industry Revenue Share (%), by Application 2024 & 2032
- Figure 38: Middle East and Africa Auto Injector Industry Revenue (Million), by Type 2024 & 2032
- Figure 39: Middle East and Africa Auto Injector Industry Revenue Share (%), by Type 2024 & 2032
- Figure 40: Middle East and Africa Auto Injector Industry Revenue (Million), by End User 2024 & 2032
- Figure 41: Middle East and Africa Auto Injector Industry Revenue Share (%), by End User 2024 & 2032
- Figure 42: Middle East and Africa Auto Injector Industry Revenue (Million), by Country 2024 & 2032
- Figure 43: Middle East and Africa Auto Injector Industry Revenue Share (%), by Country 2024 & 2032
- Figure 44: South America Auto Injector Industry Revenue (Million), by Application 2024 & 2032
- Figure 45: South America Auto Injector Industry Revenue Share (%), by Application 2024 & 2032
- Figure 46: South America Auto Injector Industry Revenue (Million), by Type 2024 & 2032
- Figure 47: South America Auto Injector Industry Revenue Share (%), by Type 2024 & 2032
- Figure 48: South America Auto Injector Industry Revenue (Million), by End User 2024 & 2032
- Figure 49: South America Auto Injector Industry Revenue Share (%), by End User 2024 & 2032
- Figure 50: South America Auto Injector Industry Revenue (Million), by Country 2024 & 2032
- Figure 51: South America Auto Injector Industry Revenue Share (%), by Country 2024 & 2032
List of Tables
- Table 1: Global Auto Injector Industry Revenue Million Forecast, by Region 2019 & 2032
- Table 2: Global Auto Injector Industry Revenue Million Forecast, by Application 2019 & 2032
- Table 3: Global Auto Injector Industry Revenue Million Forecast, by Type 2019 & 2032
- Table 4: Global Auto Injector Industry Revenue Million Forecast, by End User 2019 & 2032
- Table 5: Global Auto Injector Industry Revenue Million Forecast, by Region 2019 & 2032
- Table 6: Global Auto Injector Industry Revenue Million Forecast, by Country 2019 & 2032
- Table 7: United States Auto Injector Industry Revenue (Million) Forecast, by Application 2019 & 2032
- Table 8: Canada Auto Injector Industry Revenue (Million) Forecast, by Application 2019 & 2032
- Table 9: Mexico Auto Injector Industry Revenue (Million) Forecast, by Application 2019 & 2032
- Table 10: Global Auto Injector Industry Revenue Million Forecast, by Country 2019 & 2032
- Table 11: Germany Auto Injector Industry Revenue (Million) Forecast, by Application 2019 & 2032
- Table 12: United Kingdom Auto Injector Industry Revenue (Million) Forecast, by Application 2019 & 2032
- Table 13: France Auto Injector Industry Revenue (Million) Forecast, by Application 2019 & 2032
- Table 14: Italy Auto Injector Industry Revenue (Million) Forecast, by Application 2019 & 2032
- Table 15: Spain Auto Injector Industry Revenue (Million) Forecast, by Application 2019 & 2032
- Table 16: Rest of Europe Auto Injector Industry Revenue (Million) Forecast, by Application 2019 & 2032
- Table 17: Global Auto Injector Industry Revenue Million Forecast, by Country 2019 & 2032
- Table 18: China Auto Injector Industry Revenue (Million) Forecast, by Application 2019 & 2032
- Table 19: Japan Auto Injector Industry Revenue (Million) Forecast, by Application 2019 & 2032
- Table 20: India Auto Injector Industry Revenue (Million) Forecast, by Application 2019 & 2032
- Table 21: Australia Auto Injector Industry Revenue (Million) Forecast, by Application 2019 & 2032
- Table 22: South Korea Auto Injector Industry Revenue (Million) Forecast, by Application 2019 & 2032
- Table 23: Rest of Asia Pacific Auto Injector Industry Revenue (Million) Forecast, by Application 2019 & 2032
- Table 24: Global Auto Injector Industry Revenue Million Forecast, by Country 2019 & 2032
- Table 25: GCC Auto Injector Industry Revenue (Million) Forecast, by Application 2019 & 2032
- Table 26: South Africa Auto Injector Industry Revenue (Million) Forecast, by Application 2019 & 2032
- Table 27: Rest of Middle East and Africa Auto Injector Industry Revenue (Million) Forecast, by Application 2019 & 2032
- Table 28: Global Auto Injector Industry Revenue Million Forecast, by Country 2019 & 2032
- Table 29: Brazil Auto Injector Industry Revenue (Million) Forecast, by Application 2019 & 2032
- Table 30: Argentina Auto Injector Industry Revenue (Million) Forecast, by Application 2019 & 2032
- Table 31: Rest of South America Auto Injector Industry Revenue (Million) Forecast, by Application 2019 & 2032
- Table 32: Global Auto Injector Industry Revenue Million Forecast, by Application 2019 & 2032
- Table 33: Global Auto Injector Industry Revenue Million Forecast, by Type 2019 & 2032
- Table 34: Global Auto Injector Industry Revenue Million Forecast, by End User 2019 & 2032
- Table 35: Global Auto Injector Industry Revenue Million Forecast, by Country 2019 & 2032
- Table 36: United States Auto Injector Industry Revenue (Million) Forecast, by Application 2019 & 2032
- Table 37: Canada Auto Injector Industry Revenue (Million) Forecast, by Application 2019 & 2032
- Table 38: Mexico Auto Injector Industry Revenue (Million) Forecast, by Application 2019 & 2032
- Table 39: Global Auto Injector Industry Revenue Million Forecast, by Application 2019 & 2032
- Table 40: Global Auto Injector Industry Revenue Million Forecast, by Type 2019 & 2032
- Table 41: Global Auto Injector Industry Revenue Million Forecast, by End User 2019 & 2032
- Table 42: Global Auto Injector Industry Revenue Million Forecast, by Country 2019 & 2032
- Table 43: Germany Auto Injector Industry Revenue (Million) Forecast, by Application 2019 & 2032
- Table 44: United Kingdom Auto Injector Industry Revenue (Million) Forecast, by Application 2019 & 2032
- Table 45: France Auto Injector Industry Revenue (Million) Forecast, by Application 2019 & 2032
- Table 46: Italy Auto Injector Industry Revenue (Million) Forecast, by Application 2019 & 2032
- Table 47: Spain Auto Injector Industry Revenue (Million) Forecast, by Application 2019 & 2032
- Table 48: Rest of Europe Auto Injector Industry Revenue (Million) Forecast, by Application 2019 & 2032
- Table 49: Global Auto Injector Industry Revenue Million Forecast, by Application 2019 & 2032
- Table 50: Global Auto Injector Industry Revenue Million Forecast, by Type 2019 & 2032
- Table 51: Global Auto Injector Industry Revenue Million Forecast, by End User 2019 & 2032
- Table 52: Global Auto Injector Industry Revenue Million Forecast, by Country 2019 & 2032
- Table 53: China Auto Injector Industry Revenue (Million) Forecast, by Application 2019 & 2032
- Table 54: Japan Auto Injector Industry Revenue (Million) Forecast, by Application 2019 & 2032
- Table 55: India Auto Injector Industry Revenue (Million) Forecast, by Application 2019 & 2032
- Table 56: Australia Auto Injector Industry Revenue (Million) Forecast, by Application 2019 & 2032
- Table 57: South Korea Auto Injector Industry Revenue (Million) Forecast, by Application 2019 & 2032
- Table 58: Rest of Asia Pacific Auto Injector Industry Revenue (Million) Forecast, by Application 2019 & 2032
- Table 59: Global Auto Injector Industry Revenue Million Forecast, by Application 2019 & 2032
- Table 60: Global Auto Injector Industry Revenue Million Forecast, by Type 2019 & 2032
- Table 61: Global Auto Injector Industry Revenue Million Forecast, by End User 2019 & 2032
- Table 62: Global Auto Injector Industry Revenue Million Forecast, by Country 2019 & 2032
- Table 63: GCC Auto Injector Industry Revenue (Million) Forecast, by Application 2019 & 2032
- Table 64: South Africa Auto Injector Industry Revenue (Million) Forecast, by Application 2019 & 2032
- Table 65: Rest of Middle East and Africa Auto Injector Industry Revenue (Million) Forecast, by Application 2019 & 2032
- Table 66: Global Auto Injector Industry Revenue Million Forecast, by Application 2019 & 2032
- Table 67: Global Auto Injector Industry Revenue Million Forecast, by Type 2019 & 2032
- Table 68: Global Auto Injector Industry Revenue Million Forecast, by End User 2019 & 2032
- Table 69: Global Auto Injector Industry Revenue Million Forecast, by Country 2019 & 2032
- Table 70: Brazil Auto Injector Industry Revenue (Million) Forecast, by Application 2019 & 2032
- Table 71: Argentina Auto Injector Industry Revenue (Million) Forecast, by Application 2019 & 2032
- Table 72: Rest of South America Auto Injector Industry Revenue (Million) Forecast, by Application 2019 & 2032
Frequently Asked Questions
1. What is the projected Compound Annual Growth Rate (CAGR) of the Auto Injector Industry?
The projected CAGR is approximately 16.05%.
2. Which companies are prominent players in the Auto Injector Industry?
Key companies in the market include Becton Dickinson and Company, Amgen, Eli Lilly, Novartis, Teva Pharmaceuticals, Biogen, AstraZeneca, Abbvie, Ypsomed*List Not Exhaustive, Bayer.
3. What are the main segments of the Auto Injector Industry?
The market segments include Application, Type, End User.
4. Can you provide details about the market size?
The market size is estimated to be USD 10.84 Million as of 2022.
5. What are some drivers contributing to market growth?
Increasing Demand for Convenience of Patients; Rising Incidence of Chronic and Lifestyle Diseases; Technological Advancements.
6. What are the notable trends driving market growth?
Rheumatoid Arthritis Expected to Hold Significant Market Share Over the Forecast Period.
7. Are there any restraints impacting market growth?
Preference for Alternative Drug Delivery Modes; Regulatory Hurdles.
8. Can you provide examples of recent developments in the market?
In May 2022, Jabil Healthcare, a division of Jabil Inc. launched the Qfinity autoinjector platform, a simple, reusable, and modular solution for subcutaneous (SC) drug self-administration, at a lower cost than market alternatives.
9. What pricing options are available for accessing the report?
Pricing options include single-user, multi-user, and enterprise licenses priced at USD 4750, USD 5250, and USD 8750 respectively.
10. Is the market size provided in terms of value or volume?
The market size is provided in terms of value, measured in Million.
11. Are there any specific market keywords associated with the report?
Yes, the market keyword associated with the report is "Auto Injector Industry," which aids in identifying and referencing the specific market segment covered.
12. How do I determine which pricing option suits my needs best?
The pricing options vary based on user requirements and access needs. Individual users may opt for single-user licenses, while businesses requiring broader access may choose multi-user or enterprise licenses for cost-effective access to the report.
13. Are there any additional resources or data provided in the Auto Injector Industry report?
While the report offers comprehensive insights, it's advisable to review the specific contents or supplementary materials provided to ascertain if additional resources or data are available.
14. How can I stay updated on further developments or reports in the Auto Injector Industry?
To stay informed about further developments, trends, and reports in the Auto Injector Industry, consider subscribing to industry newsletters, following relevant companies and organizations, or regularly checking reputable industry news sources and publications.
Methodology
Step 1 - Identification of Relevant Samples Size from Population Database


Step 2 - Approaches for Defining Global Market Size (Value, Volume* & Price*)

Note*: In applicable scenarios
Step 3 - Data Sources
Primary Research
- Web Analytics
- Survey Reports
- Research Institute
- Latest Research Reports
- Opinion Leaders
Secondary Research
- Annual Reports
- White Paper
- Latest Press Release
- Industry Association
- Paid Database
- Investor Presentations

Step 4 - Data Triangulation
Involves using different sources of information in order to increase the validity of a study
These sources are likely to be stakeholders in a program - participants, other researchers, program staff, other community members, and so on.
Then we put all data in single framework & apply various statistical tools to find out the dynamic on the market.
During the analysis stage, feedback from the stakeholder groups would be compared to determine areas of agreement as well as areas of divergence


