
Key Insights
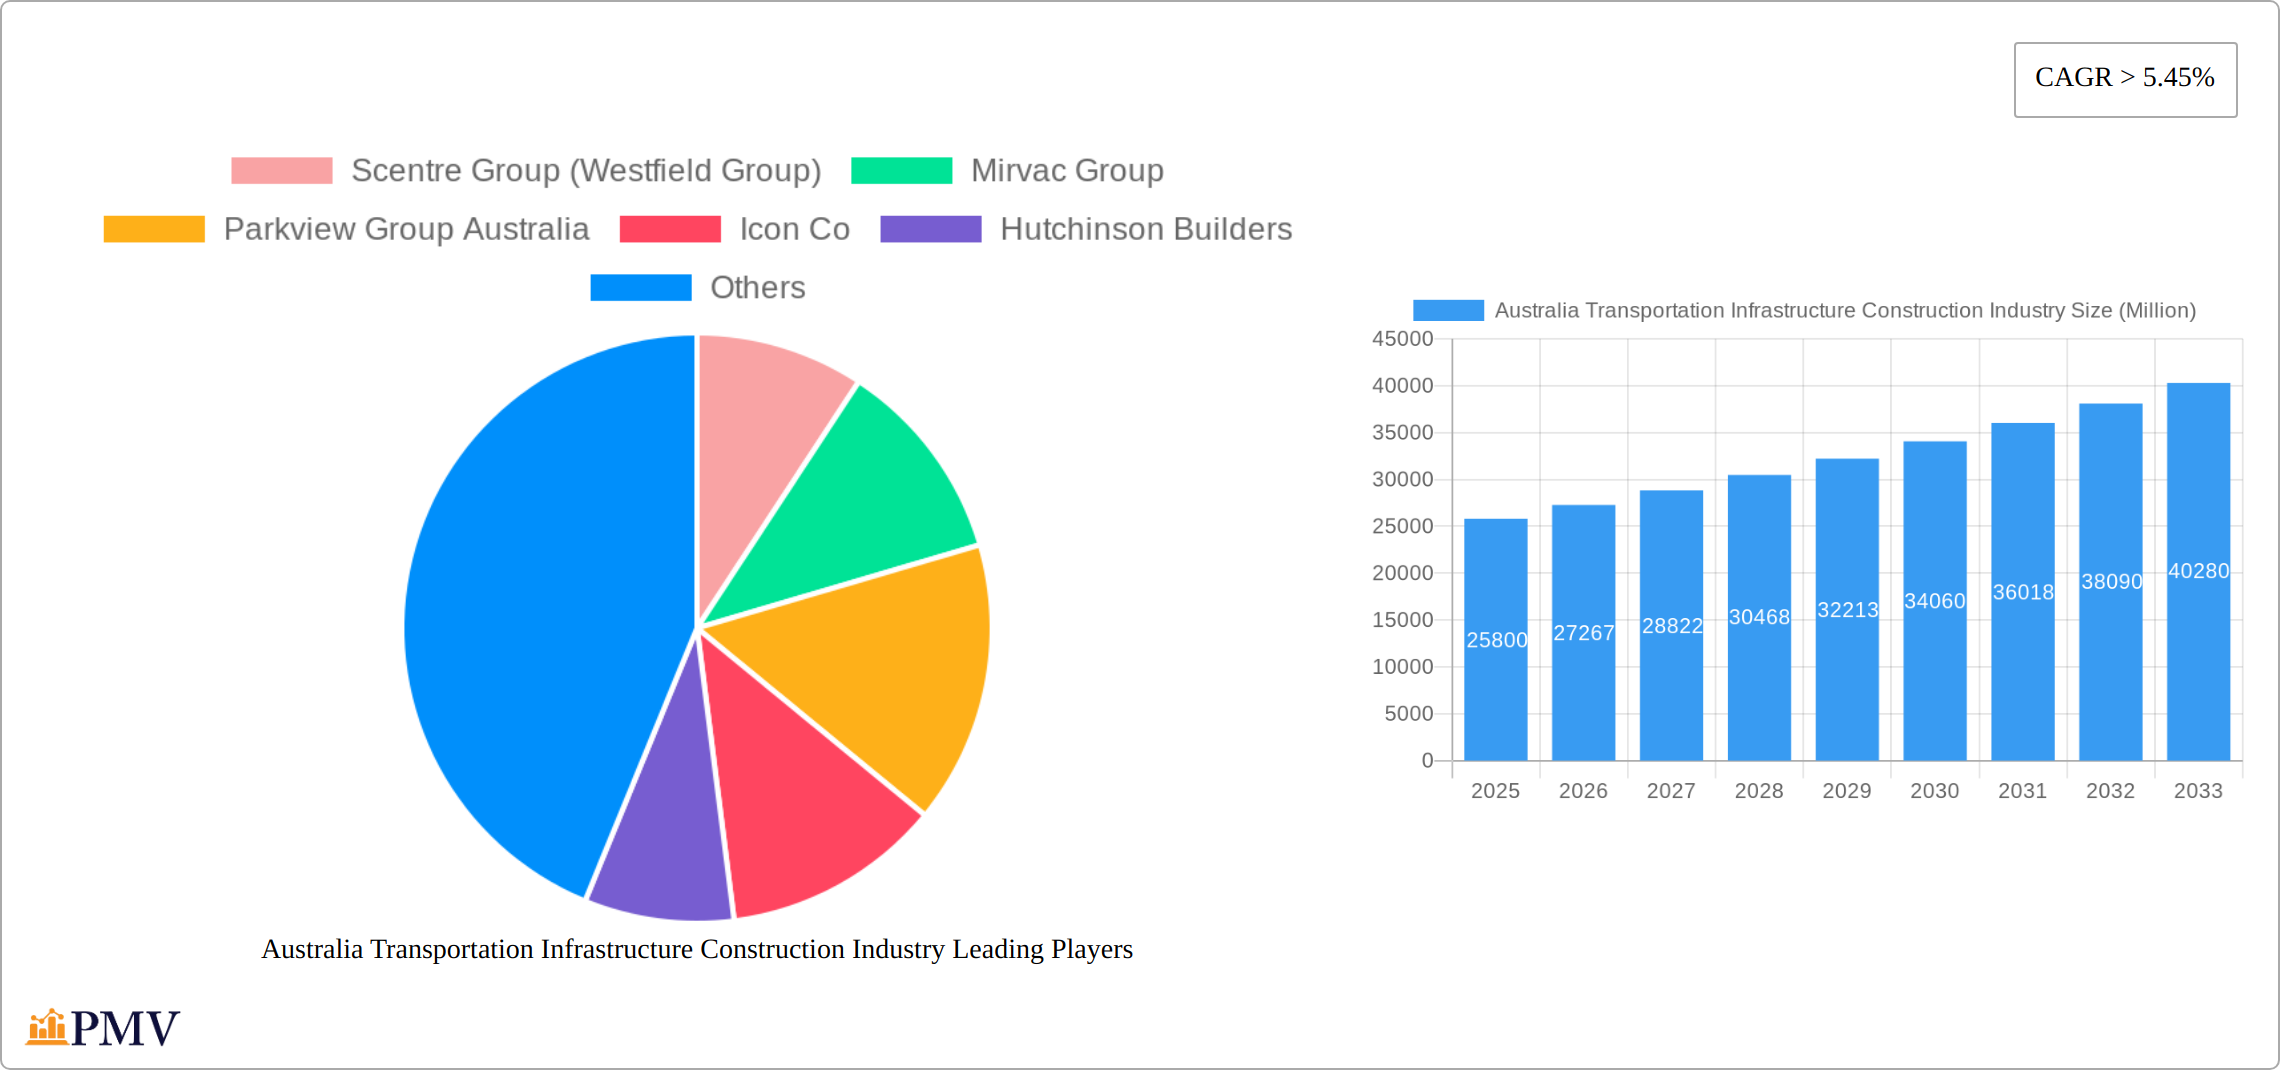
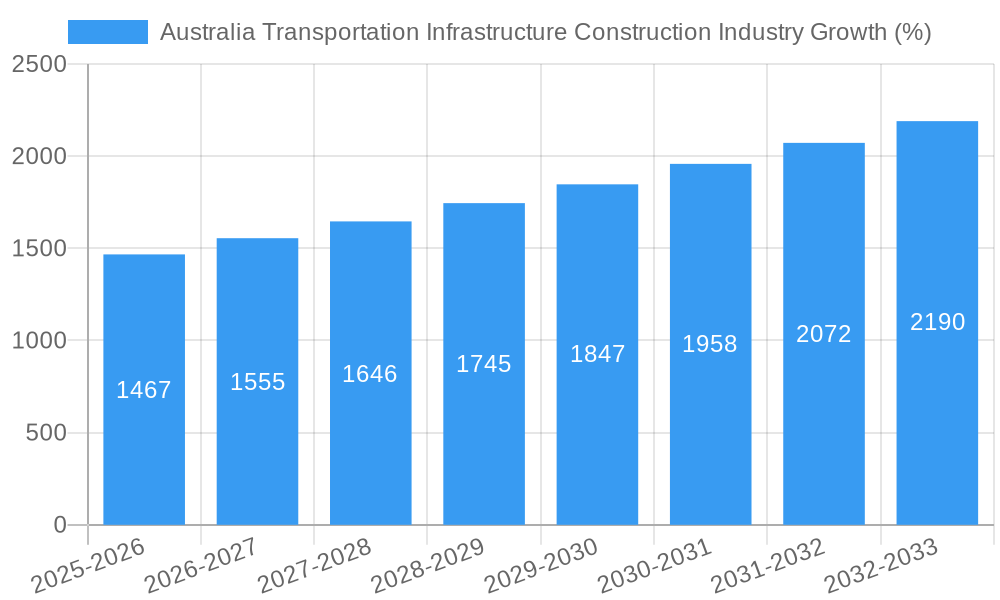
The Australian transportation infrastructure construction industry is experiencing robust growth, projected to reach a market size of $25.80 billion in 2025 and maintain a Compound Annual Growth Rate (CAGR) exceeding 5.45% from 2025 to 2033. This expansion is driven by several key factors. Firstly, significant government investment in upgrading and expanding existing transportation networks, including roads, railways, waterways, and airways, is a major catalyst. This investment is fueled by a need to accommodate Australia's growing population and the increasing demand for efficient freight movement. Secondly, the ongoing urbanization and the consequent need for improved connectivity within and between cities are contributing to strong demand for infrastructure projects. Finally, a focus on sustainability and the adoption of innovative construction technologies are shaping the industry's trajectory, leading to more efficient and environmentally friendly projects. Key players like Scentre Group, Mirvac Group, and Lendlease are actively shaping this landscape, leading large-scale developments.
However, the industry also faces challenges. Rising material costs, particularly steel and concrete, coupled with potential labor shortages and supply chain disruptions, can constrain growth. Furthermore, environmental regulations and the need for stringent approvals processes may prolong project timelines and increase costs. Despite these headwinds, the long-term outlook remains positive, driven by the enduring need for improved transportation infrastructure across Australia, and the government's commitment to long-term infrastructure planning. The segmentation across roadways, railways, waterways, and airways offers a diversified market, with roadways likely dominating due to extensive road networks needing ongoing maintenance and expansion. The industry will likely see further consolidation among major players as competition intensifies and projects become increasingly complex.
Australia Transportation Infrastructure Construction Industry: 2019-2033 Market Report
This comprehensive report provides an in-depth analysis of the Australian transportation infrastructure construction industry, covering the period from 2019 to 2033. With a focus on market structure, competitive dynamics, key trends, and future growth potential, this report is an essential resource for industry professionals, investors, and policymakers. The report utilizes data from 2019-2024 (Historical Period), 2025 (Base & Estimated Year) and forecasts from 2025-2033 (Forecast Period). The total market size is estimated to be xx Million in 2025, growing at a CAGR of xx% during the forecast period.
Australia Transportation Infrastructure Construction Industry Market Structure & Competitive Dynamics
The Australian transportation infrastructure construction industry is characterized by a moderately concentrated market structure, with several large players and a number of smaller, specialized firms. Market share is dynamic, influenced by major project wins and M&A activity. Innovation is driven by technological advancements, particularly in sustainable construction methods and digital technologies. The regulatory framework plays a significant role, impacting project approvals, environmental considerations, and safety standards. Product substitution is limited, with choices primarily influenced by cost, efficiency, and specialized capabilities. End-user demand primarily focuses on resilience, sustainability and efficiency with a trend towards larger, more complex projects.
Key metrics illustrating the competitive landscape include:
- Market Concentration: The top 5 players hold an estimated xx% market share in 2025.
- M&A Activity: Significant M&A activity was observed in the historical period with deal values totaling approximately xx Million. A slowdown is predicted in the short term before a recovery in the mid-2030s.
- Innovation Ecosystems: Collaboration between construction firms, technology providers, and research institutions is increasing, fostering innovation in areas such as Building Information Modeling (BIM) and prefabrication.
Australia Transportation Infrastructure Construction Industry Industry Trends & Insights
The Australian transportation infrastructure construction industry is experiencing robust growth, driven by several key factors. Government investment in major infrastructure projects is a primary driver, aiming to address increasing urbanization, population growth, and the need for improved connectivity. Technological advancements are also transforming the industry, with the adoption of Building Information Modeling (BIM), digital twins, and advanced construction materials enhancing efficiency and sustainability. Growing awareness of environmental concerns is driving demand for sustainable construction practices. Furthermore, the industry is witnessing increased competition, with firms focusing on specialization, innovation, and strategic partnerships to maintain a competitive edge. The market is witnessing an increased focus on public-private partnerships (PPPs) as a means of financing large-scale projects.
- Market Growth Drivers: Government investment in infrastructure, population growth, technological advancements, and increasing demand for sustainable construction.
- Technological Disruptions: BIM, prefabrication, 3D printing, IoT sensors, and AI-driven project management are transforming construction processes.
- Consumer Preferences: Emphasis on sustainable and resilient infrastructure, faster project delivery times, and improved cost efficiency.
- Competitive Dynamics: Increased competition, strategic alliances, and focus on specialization.
Dominant Markets & Segments in Australia Transportation Infrastructure Construction Industry
While all transportation segments contribute significantly, the Roadways segment holds the largest market share.
- Roadways: Key drivers include continuous urbanization and population growth, necessitating expansion of road networks. Increased freight transportation demands also necessitate enhanced road infrastructure. Government funding for road projects fuels this segment's dominance.
- Railways: The Inland Rail project represents a major driver of growth in this segment, along with ongoing maintenance and upgrades to existing networks. Electrification and automation initiatives are shaping future development.
- Waterways: This segment is smaller but presents significant growth potential in areas such as port upgrades and waterway maintenance. This is influenced by increased global trade and investment in maritime infrastructure.
- Airways: This segment experiences growth tied to passenger and cargo traffic increases, necessitating airport expansion and improvements. Ongoing maintenance and upgrades are also important drivers. This sector is smaller than Roadways and Railways.
The report provides a detailed analysis of the regional variations within each segment, identifying areas with the highest growth potential.
Australia Transportation Infrastructure Construction Industry Product Innovations
The Australian transportation infrastructure construction industry is witnessing significant product innovation, driven by technological advancements and the need for sustainable solutions. New materials such as high-performance concrete and recycled aggregates are being adopted to improve durability and reduce environmental impact. Prefabrication and modular construction methods are gaining traction, enhancing speed and efficiency. Digital technologies, including BIM and IoT sensors, are optimizing project management and enhancing safety. The integration of renewable energy sources in infrastructure projects is also becoming more prevalent, with examples such as solar-powered signaling systems in the Inland Rail project.
Report Segmentation & Scope
This report segments the Australian transportation infrastructure construction market by type:
Roadways: This segment includes the construction and maintenance of highways, roads, bridges, and tunnels. Growth is projected at xx% CAGR from 2025-2033, driven by government investment and increasing urbanization. Competitive dynamics are intense, with numerous players vying for large projects.
Railways: This segment comprises the construction and maintenance of railway lines, stations, and related infrastructure. Growth is estimated at xx% CAGR during the forecast period, driven by major projects like Inland Rail. The competitive landscape is less fragmented than the roadways segment.
Waterways: This segment involves the construction and maintenance of ports, harbors, canals, and other waterway infrastructure. Growth is projected at a xx% CAGR from 2025-2033, influenced by government spending on port modernization. The market is characterized by specialized players.
Airways: This segment includes airport construction and maintenance, air traffic control systems, and related infrastructure. Growth is expected to be around xx% CAGR from 2025-2033, driven by increasing air passenger and freight traffic. The market is characterized by a small number of specialized construction firms.
Key Drivers of Australia Transportation Infrastructure Construction Industry Growth
Several key factors drive the growth of Australia's transportation infrastructure construction industry:
- Government Investment: Significant government spending on infrastructure projects, particularly in road and rail networks, acts as a major catalyst for growth.
- Urbanization and Population Growth: Increasing urbanization and population growth necessitate the expansion and improvement of transportation infrastructure to manage increased traffic and commuter demands.
- Technological Advancements: The adoption of BIM, prefabrication, and other advanced technologies boosts efficiency and reduces project costs.
- Economic Growth: Strong economic growth generates more revenue, leading to increased spending on infrastructure development.
Challenges in the Australia Transportation Infrastructure Construction Industry Sector
The Australian transportation infrastructure construction industry faces several challenges:
- Skills Shortages: A shortage of skilled labor, particularly in specialized areas, can impact project timelines and costs. The impact is estimated to delay xx% of projects by an average of xx months.
- Supply Chain Disruptions: Global supply chain disruptions can lead to material shortages and increased costs, affecting project profitability. The impact is estimated to increase material costs by xx%.
- Regulatory Hurdles: Complex and lengthy approval processes can delay project commencement and increase overall project costs. Delays have been estimated at an average of xx months per project.
- Competition: Intense competition among construction companies can put pressure on profit margins.
Leading Players in the Australia Transportation Infrastructure Construction Industry Market
- Scentre Group (Westfield Group)
- Mirvac Group
- Parkview Group Australia
- Icon Co
- Hutchinson Builders
- Downer EDI Works
- CPB Contractors
- Salini Impregilo NRW Joint Venture
- Richard Crookes Constructions
- BGC (Australia)
- BMD Constructions
- Fulton Hogan
- ADCO Constructions
- Lendlease
- Watpac Australia
- John Holland
- Built
Key Developments in Australia Transportation Infrastructure Construction Industry Sector
September 2023: Inland Rail commences construction on the 170km Stockinbingal - Parkes section in NSW. Martinus Rail secures a AUD 403.5m contract for design and construction works. This significantly boosts activity in the railway segment.
May 2023: ARTC confirms the use of solar-powered signaling systems along the Inland Rail corridor, showcasing a move towards sustainable infrastructure and reducing operational costs. This signals a significant shift towards greener solutions within the industry.
Strategic Australia Transportation Infrastructure Construction Industry Market Outlook
The Australian transportation infrastructure construction industry is poised for continued growth, driven by sustained government investment, urbanization, and technological advancements. Opportunities exist for companies that can leverage innovation, adopt sustainable practices, and manage supply chain risks effectively. Strategic partnerships and collaborations will be crucial for navigating the industry's challenges and capitalizing on emerging opportunities. Focus on digitalization and sustainable solutions will be key differentiators in the coming years.
Australia Transportation Infrastructure Construction Industry Segmentation
-
1. Type
- 1.1. Roadways
- 1.2. Railways
- 1.3. Waterways
- 1.4. Airways
Australia Transportation Infrastructure Construction Industry Segmentation By Geography
- 1. Australia
Australia Transportation Infrastructure Construction Industry REPORT HIGHLIGHTS
| Aspects | Details |
|---|---|
| Study Period | 2019-2033 |
| Base Year | 2024 |
| Estimated Year | 2025 |
| Forecast Period | 2025-2033 |
| Historical Period | 2019-2024 |
| Growth Rate | CAGR of > 5.45% from 2019-2033 |
| Segmentation |
|
Table of Contents
- 1. Introduction
- 1.1. Research Scope
- 1.2. Market Segmentation
- 1.3. Research Methodology
- 1.4. Definitions and Assumptions
- 2. Executive Summary
- 2.1. Introduction
- 3. Market Dynamics
- 3.1. Introduction
- 3.2. Market Drivers
- 3.2.1. 4.; Investments in Land Transportation Infrastructure4.; Development of shipping industry
- 3.3. Market Restrains
- 3.3.1. 4.; High Cost of the projects
- 3.4. Market Trends
- 3.4.1. Investments in Land Transportation Infrastructure is Driving the Market
- 4. Market Factor Analysis
- 4.1. Porters Five Forces
- 4.2. Supply/Value Chain
- 4.3. PESTEL analysis
- 4.4. Market Entropy
- 4.5. Patent/Trademark Analysis
- 5. Australia Transportation Infrastructure Construction Industry Analysis, Insights and Forecast, 2019-2031
- 5.1. Market Analysis, Insights and Forecast - by Type
- 5.1.1. Roadways
- 5.1.2. Railways
- 5.1.3. Waterways
- 5.1.4. Airways
- 5.2. Market Analysis, Insights and Forecast - by Region
- 5.2.1. Australia
- 5.1. Market Analysis, Insights and Forecast - by Type
- 6. Competitive Analysis
- 6.1. Market Share Analysis 2024
- 6.2. Company Profiles
- 6.2.1 Scentre Group (Westfield Group)
- 6.2.1.1. Overview
- 6.2.1.2. Products
- 6.2.1.3. SWOT Analysis
- 6.2.1.4. Recent Developments
- 6.2.1.5. Financials (Based on Availability)
- 6.2.2 Mirvac Group
- 6.2.2.1. Overview
- 6.2.2.2. Products
- 6.2.2.3. SWOT Analysis
- 6.2.2.4. Recent Developments
- 6.2.2.5. Financials (Based on Availability)
- 6.2.3 Parkview Group Australia
- 6.2.3.1. Overview
- 6.2.3.2. Products
- 6.2.3.3. SWOT Analysis
- 6.2.3.4. Recent Developments
- 6.2.3.5. Financials (Based on Availability)
- 6.2.4 Icon Co
- 6.2.4.1. Overview
- 6.2.4.2. Products
- 6.2.4.3. SWOT Analysis
- 6.2.4.4. Recent Developments
- 6.2.4.5. Financials (Based on Availability)
- 6.2.5 Hutchinson Builders
- 6.2.5.1. Overview
- 6.2.5.2. Products
- 6.2.5.3. SWOT Analysis
- 6.2.5.4. Recent Developments
- 6.2.5.5. Financials (Based on Availability)
- 6.2.6 Downer EDI Works**List Not Exhaustive
- 6.2.6.1. Overview
- 6.2.6.2. Products
- 6.2.6.3. SWOT Analysis
- 6.2.6.4. Recent Developments
- 6.2.6.5. Financials (Based on Availability)
- 6.2.7 CPB Contractors
- 6.2.7.1. Overview
- 6.2.7.2. Products
- 6.2.7.3. SWOT Analysis
- 6.2.7.4. Recent Developments
- 6.2.7.5. Financials (Based on Availability)
- 6.2.8 Salini Impregilo NRW Joint Venture
- 6.2.8.1. Overview
- 6.2.8.2. Products
- 6.2.8.3. SWOT Analysis
- 6.2.8.4. Recent Developments
- 6.2.8.5. Financials (Based on Availability)
- 6.2.9 Richard Crookes Constructions
- 6.2.9.1. Overview
- 6.2.9.2. Products
- 6.2.9.3. SWOT Analysis
- 6.2.9.4. Recent Developments
- 6.2.9.5. Financials (Based on Availability)
- 6.2.10 BGC (Australia)
- 6.2.10.1. Overview
- 6.2.10.2. Products
- 6.2.10.3. SWOT Analysis
- 6.2.10.4. Recent Developments
- 6.2.10.5. Financials (Based on Availability)
- 6.2.11 BMD Constructions
- 6.2.11.1. Overview
- 6.2.11.2. Products
- 6.2.11.3. SWOT Analysis
- 6.2.11.4. Recent Developments
- 6.2.11.5. Financials (Based on Availability)
- 6.2.12 Fulton Hogan
- 6.2.12.1. Overview
- 6.2.12.2. Products
- 6.2.12.3. SWOT Analysis
- 6.2.12.4. Recent Developments
- 6.2.12.5. Financials (Based on Availability)
- 6.2.13 ADCO Constructions
- 6.2.13.1. Overview
- 6.2.13.2. Products
- 6.2.13.3. SWOT Analysis
- 6.2.13.4. Recent Developments
- 6.2.13.5. Financials (Based on Availability)
- 6.2.14 Lendlease
- 6.2.14.1. Overview
- 6.2.14.2. Products
- 6.2.14.3. SWOT Analysis
- 6.2.14.4. Recent Developments
- 6.2.14.5. Financials (Based on Availability)
- 6.2.15 Watpac Australia
- 6.2.15.1. Overview
- 6.2.15.2. Products
- 6.2.15.3. SWOT Analysis
- 6.2.15.4. Recent Developments
- 6.2.15.5. Financials (Based on Availability)
- 6.2.16 John Holland
- 6.2.16.1. Overview
- 6.2.16.2. Products
- 6.2.16.3. SWOT Analysis
- 6.2.16.4. Recent Developments
- 6.2.16.5. Financials (Based on Availability)
- 6.2.17 Built
- 6.2.17.1. Overview
- 6.2.17.2. Products
- 6.2.17.3. SWOT Analysis
- 6.2.17.4. Recent Developments
- 6.2.17.5. Financials (Based on Availability)
- 6.2.1 Scentre Group (Westfield Group)
List of Figures
- Figure 1: Australia Transportation Infrastructure Construction Industry Revenue Breakdown (Million, %) by Product 2024 & 2032
- Figure 2: Australia Transportation Infrastructure Construction Industry Share (%) by Company 2024
List of Tables
- Table 1: Australia Transportation Infrastructure Construction Industry Revenue Million Forecast, by Region 2019 & 2032
- Table 2: Australia Transportation Infrastructure Construction Industry Revenue Million Forecast, by Type 2019 & 2032
- Table 3: Australia Transportation Infrastructure Construction Industry Revenue Million Forecast, by Region 2019 & 2032
- Table 4: Australia Transportation Infrastructure Construction Industry Revenue Million Forecast, by Country 2019 & 2032
- Table 5: Australia Transportation Infrastructure Construction Industry Revenue Million Forecast, by Type 2019 & 2032
- Table 6: Australia Transportation Infrastructure Construction Industry Revenue Million Forecast, by Country 2019 & 2032
Frequently Asked Questions
1. What is the projected Compound Annual Growth Rate (CAGR) of the Australia Transportation Infrastructure Construction Industry?
The projected CAGR is approximately > 5.45%.
2. Which companies are prominent players in the Australia Transportation Infrastructure Construction Industry?
Key companies in the market include Scentre Group (Westfield Group), Mirvac Group, Parkview Group Australia, Icon Co, Hutchinson Builders, Downer EDI Works**List Not Exhaustive, CPB Contractors, Salini Impregilo NRW Joint Venture, Richard Crookes Constructions, BGC (Australia), BMD Constructions, Fulton Hogan, ADCO Constructions, Lendlease, Watpac Australia, John Holland, Built.
3. What are the main segments of the Australia Transportation Infrastructure Construction Industry?
The market segments include Type.
4. Can you provide details about the market size?
The market size is estimated to be USD 25.80 Million as of 2022.
5. What are some drivers contributing to market growth?
4.; Investments in Land Transportation Infrastructure4.; Development of shipping industry.
6. What are the notable trends driving market growth?
Investments in Land Transportation Infrastructure is Driving the Market.
7. Are there any restraints impacting market growth?
4.; High Cost of the projects.
8. Can you provide examples of recent developments in the market?
September 2023, INLAND Rail has marked the start of construction on the 170km Stockinbingal - Parkes section in New South Wales with a launch event at Forbes station. Martinus Rail has been awarded an AUD 403.5m (USD 259.3m) contract to design and construct enhancement works on the Stockinbingal - Parkes and Albury - Illabo sections. Construction on the Inland Rail project to connect Melbourne and Brisbane with a new 1600km freight corridor through Victoria, New South Wales, and Queensland started in 2018. Inland Rail will provide an alternative to the congested coastal route through Sydney. The project involves upgrading existing lines and some new construction.
9. What pricing options are available for accessing the report?
Pricing options include single-user, multi-user, and enterprise licenses priced at USD 3800, USD 4500, and USD 5800 respectively.
10. Is the market size provided in terms of value or volume?
The market size is provided in terms of value, measured in Million.
11. Are there any specific market keywords associated with the report?
Yes, the market keyword associated with the report is "Australia Transportation Infrastructure Construction Industry," which aids in identifying and referencing the specific market segment covered.
12. How do I determine which pricing option suits my needs best?
The pricing options vary based on user requirements and access needs. Individual users may opt for single-user licenses, while businesses requiring broader access may choose multi-user or enterprise licenses for cost-effective access to the report.
13. Are there any additional resources or data provided in the Australia Transportation Infrastructure Construction Industry report?
While the report offers comprehensive insights, it's advisable to review the specific contents or supplementary materials provided to ascertain if additional resources or data are available.
14. How can I stay updated on further developments or reports in the Australia Transportation Infrastructure Construction Industry?
To stay informed about further developments, trends, and reports in the Australia Transportation Infrastructure Construction Industry, consider subscribing to industry newsletters, following relevant companies and organizations, or regularly checking reputable industry news sources and publications.
Methodology
Step 1 - Identification of Relevant Samples Size from Population Database


Step 2 - Approaches for Defining Global Market Size (Value, Volume* & Price*)

Note*: In applicable scenarios
Step 3 - Data Sources
Primary Research
- Web Analytics
- Survey Reports
- Research Institute
- Latest Research Reports
- Opinion Leaders
Secondary Research
- Annual Reports
- White Paper
- Latest Press Release
- Industry Association
- Paid Database
- Investor Presentations

Step 4 - Data Triangulation
Involves using different sources of information in order to increase the validity of a study
These sources are likely to be stakeholders in a program - participants, other researchers, program staff, other community members, and so on.
Then we put all data in single framework & apply various statistical tools to find out the dynamic on the market.
During the analysis stage, feedback from the stakeholder groups would be compared to determine areas of agreement as well as areas of divergence


