
Key Insights
The Asia Pacific functional beverages market, valued at $98.53 billion in 2025, is projected to experience robust growth, driven by increasing health consciousness, rising disposable incomes, and a burgeoning demand for convenient, nutritious options. Key segments fueling this expansion include energy drinks, sports drinks, and fortified juices, experiencing significant traction among health-conscious consumers and athletes. The market's growth is further propelled by expanding distribution channels, with supermarkets/hypermarkets maintaining a dominant share, while online retail stores show significant potential for future growth. While the dominance of established players like PepsiCo, Coca-Cola, and Red Bull is undeniable, smaller, specialized brands focusing on natural ingredients and functional benefits are emerging and capturing market share. The region's diverse demographics and varying consumer preferences present both challenges and opportunities. For instance, the high population density and increasing urbanization in countries like India and China offer substantial growth potential, but varying cultural preferences and regulatory landscapes require tailored marketing strategies. Furthermore, concerns regarding sugar content and artificial ingredients are prompting a shift towards healthier, low-sugar alternatives, creating opportunities for innovative product formulations.
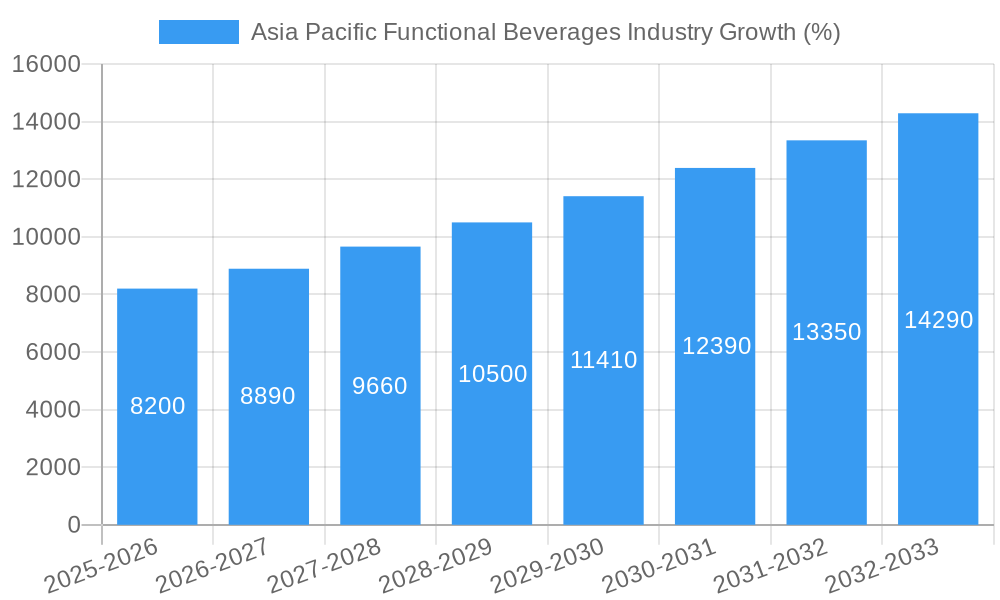
The forecast period (2025-2033) anticipates a continued upward trajectory, with the compound annual growth rate (CAGR) of 8.33% indicating significant market expansion. Growth will be influenced by evolving consumer preferences, technological advancements in beverage production and packaging, and the strategic initiatives of key players to meet changing market demands. The Asia Pacific region's diverse landscape, encompassing diverse economies and cultures from developed markets like Japan and South Korea to rapidly developing nations such as India and China, presents a complex but lucrative arena for functional beverage manufacturers. Successful players will need to adapt their strategies to navigate the specific challenges and opportunities presented by each market segment. Product diversification, strategic partnerships, and targeted marketing campaigns will play a vital role in capturing and sustaining market share in this dynamic sector.
Asia Pacific Functional Beverages Industry: A Comprehensive Market Report (2019-2033)
This comprehensive report provides a detailed analysis of the Asia Pacific functional beverages industry, covering the period from 2019 to 2033. It offers invaluable insights into market dynamics, competitive landscapes, and future growth potential, equipping businesses with actionable intelligence to thrive in this dynamic sector. The report leverages extensive data and expert analysis to provide a 360-degree view, encompassing key segments, leading players, and emerging trends. With a focus on key performance indicators (KPIs) and future projections, this report is an essential resource for investors, manufacturers, distributors, and anyone seeking a deep understanding of the Asia Pacific functional beverage market. The total market value is predicted to reach xx Million by 2033.
Asia Pacific Functional Beverages Industry Market Structure & Competitive Dynamics
The Asia Pacific functional beverage market exhibits a moderately concentrated structure, with several multinational corporations holding significant market share. Key players such as PepsiCo Inc, Suntory Holdings Limited, The Coca-Cola Company, Nestlé S A, and Red Bull GmbH dominate various segments. However, regional players and smaller niche brands also contribute significantly, particularly within specific product categories and geographical areas. The market is characterized by intense competition, driven by product innovation, aggressive marketing strategies, and price wars.
The innovation ecosystem is vibrant, with continuous development of new product formulations, packaging technologies, and distribution channels. Regulatory frameworks vary across countries, impacting product labeling, health claims, and ingredient restrictions. Substitute products, including conventional beverages and nutritional supplements, exert competitive pressure. End-user trends favor healthier, more natural, and convenient options, driving demand for functional beverages with added vitamins, minerals, or other health benefits. M&A activities are relatively frequent, with larger players acquiring smaller companies to expand their product portfolios and market reach. Recent M&A deal values in the Asia-Pacific region have ranged from xx Million to xx Million, with an average deal size of approximately xx Million.
Asia Pacific Functional Beverages Industry Industry Trends & Insights
The Asia Pacific functional beverages market is experiencing robust growth, driven by several key factors. Rising health consciousness among consumers, coupled with increasing disposable incomes and changing lifestyles, fuels demand for beverages with functional benefits. The market's Compound Annual Growth Rate (CAGR) during the historical period (2019-2024) was approximately xx%, while the projected CAGR for the forecast period (2025-2033) is xx%. Market penetration of functional beverages, particularly in emerging economies, remains relatively low, presenting substantial growth opportunities. Technological disruptions, such as the rise of e-commerce and personalized nutrition, further shape market dynamics. Consumer preferences are evolving towards natural ingredients, sustainable packaging, and functional benefits catering to specific health needs (e.g., immunity, energy, hydration). Competitive dynamics involve both price competition and differentiation through product innovation and branding.
Dominant Markets & Segments in Asia Pacific Functional Beverages Industry
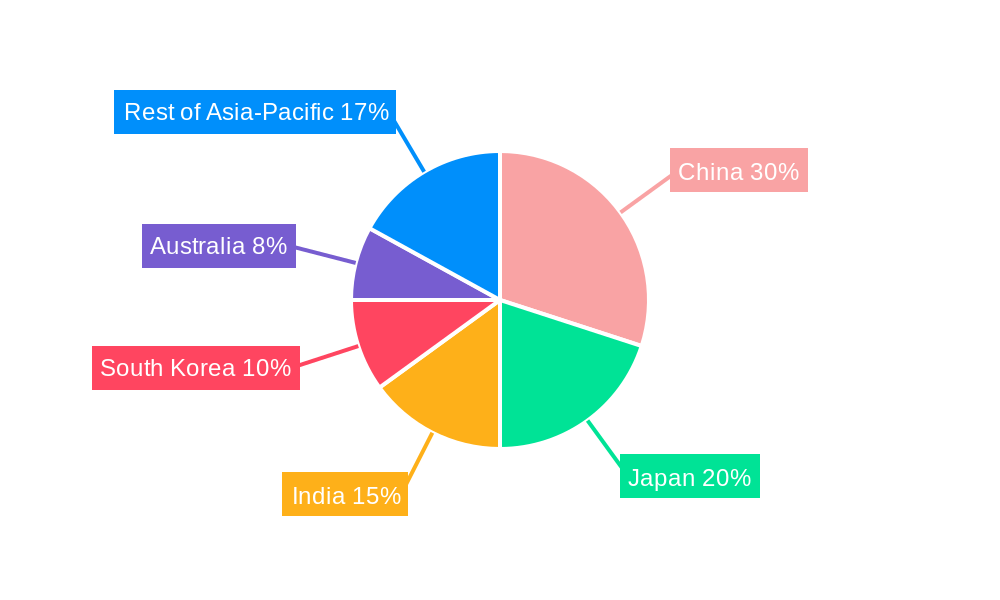
Within the Asia Pacific region, China, India, and Japan represent the most significant markets for functional beverages. These countries exhibit high population densities, rising disposable incomes, and a growing preference for convenient and health-conscious options.
Leading Product Types: Energy drinks maintain a strong position, driven by a young and active population. Sports drinks are also experiencing significant growth, fueled by increasing participation in sports and fitness activities. Dairy and dairy alternative beverages show substantial potential, driven by health consciousness and the growing popularity of plant-based options.
Dominant Distribution Channels: Supermarkets/hypermarkets remain the primary distribution channel, owing to their wide reach and established infrastructure. Convenience stores are also gaining prominence due to their accessibility and growing presence in urban areas. Online retail is rapidly emerging as a significant channel, with growing e-commerce penetration and consumer preference for home delivery.
Key drivers for dominance in these segments include:
- Economic growth: Rising disposable incomes increase consumer spending on premium and functional beverages.
- Infrastructure development: Improved logistics and cold chain infrastructure facilitate wider distribution of perishable functional beverages.
- Government policies: Supportive regulatory environments promoting healthy lifestyles contribute to market expansion.
Asia Pacific Functional Beverages Industry Product Innovations
Recent product innovations emphasize natural ingredients, clean labels, and functional benefits tailored to specific consumer needs. Technological advances in beverage formulation, packaging, and processing are enhancing product quality, shelf life, and convenience. For example, the increasing use of plant-based ingredients in dairy alternatives is a key innovation trend. The market is witnessing the emergence of functional beverages with customized benefits, such as enhanced immunity support or improved cognitive function, catering to the growing demand for personalized wellness solutions. This aligns with a market trend toward healthier, more natural choices and addresses consumer demand for greater transparency and ingredient traceability.
Report Segmentation & Scope
This report segments the Asia Pacific functional beverages market based on product type (Energy Drinks, Sports Drinks, Fortified Juices, Dairy and Dairy Alternative Beverages, Other Product Types) and distribution channel (Supermarkets/Hypermarkets, Pharmacies/Drug Stores, Convenience Stores, Online Retail Stores, Other Distribution Channels). Each segment's growth projections, market sizes, and competitive dynamics are analyzed, providing a comprehensive understanding of the market structure and future potential. For example, the energy drink segment is projected to witness significant growth driven by increasing consumer preference for convenient energy boosters, whereas the online retail channel is expected to experience rapid expansion due to the increasing adoption of e-commerce in the region. The dairy and dairy alternative beverage segment is forecast to have a particularly strong growth trajectory, fueled by increasing consumer demand for plant-based options.
Key Drivers of Asia Pacific Functional Beverages Industry Growth
Several factors contribute to the growth of the Asia Pacific functional beverages industry. These include:
- Rising health consciousness: Consumers are increasingly prioritizing health and wellness, driving demand for beverages with added nutritional value.
- Growing disposable incomes: Increased purchasing power enables consumers to spend more on premium and functional beverages.
- Changing lifestyles: Busy lifestyles and increased participation in sports and fitness activities boost demand for convenient and energy-boosting beverages.
- Technological advancements: Innovations in beverage formulation and packaging enhance product quality and appeal.
- Favorable government policies: Regulations promoting healthy lifestyles and supporting the food and beverage industry contribute to market growth.
Challenges in the Asia Pacific Functional Beverages Industry Sector
The Asia Pacific functional beverages industry faces certain challenges:
- Stringent regulations: Varying regulatory frameworks across countries create complexities in product compliance and labeling.
- Supply chain disruptions: Global supply chain uncertainties and fluctuations in raw material prices can impact production costs and profitability.
- Intense competition: The highly competitive market environment necessitates continuous product innovation and aggressive marketing strategies.
- Consumer preference shifts: Changing consumer preferences and trends require companies to adapt their product offerings and marketing strategies.
- Maintaining product quality and safety: Ensuring consistent product quality, safety, and shelf-life is crucial for maintaining brand reputation and consumer trust.
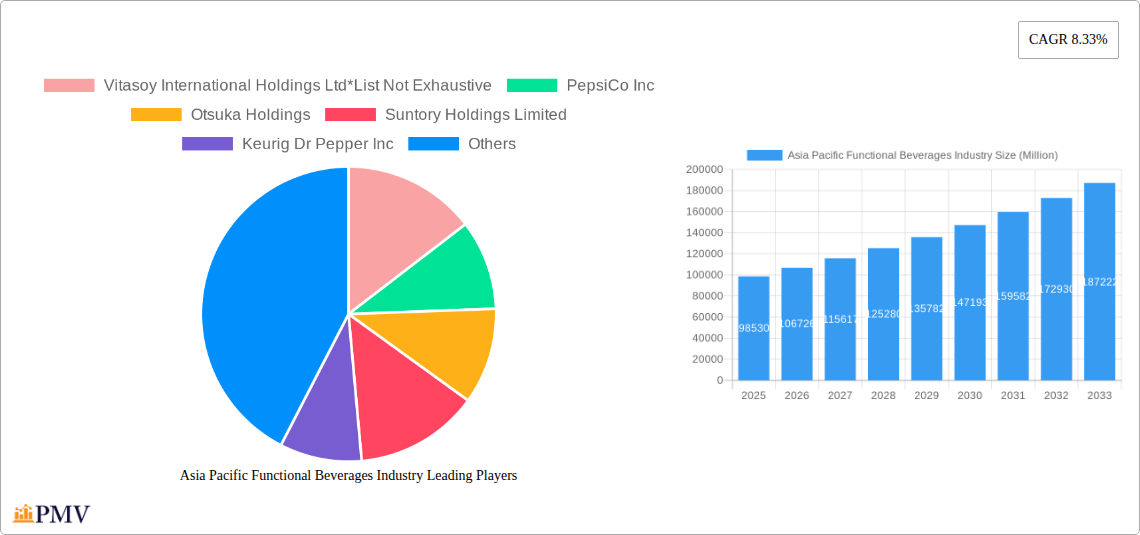
Leading Players in the Asia Pacific Functional Beverages Industry Market
- Vitasoy International Holdings Ltd
- PepsiCo Inc
- Otsuka Holdings
- Suntory Holdings Limited
- Keurig Dr Pepper Inc
- Red Bull GmbH
- Danone S A
- The Coca-Cola Company
- Fonterra Co-operative Group Limited
- Nestlé S A
Key Developments in Asia Pacific Functional Beverages Industry Sector
- February 2022: Nestlé launched a new plant-based Milo in Thailand.
- February 2022: Red Bull India launched a limited-edition watermelon-flavored energy drink.
- August 2022: Coca-Cola India introduced Limca Sportz, a glucose and electrolyte-based sports drink. These launches reflect the industry's focus on innovation and catering to evolving consumer preferences.
Strategic Asia Pacific Functional Beverages Industry Market Outlook
The Asia Pacific functional beverages market presents significant growth potential in the coming years. Continued expansion is expected, driven by factors such as rising health consciousness, increasing disposable incomes, and the ongoing development of innovative products. Strategic opportunities lie in leveraging technological advancements to enhance product offerings, optimize distribution channels, and strengthen brand presence. Companies that successfully adapt to evolving consumer preferences, embrace sustainable practices, and navigate regulatory complexities are poised to achieve significant market share gains. The market's future growth is intrinsically linked to maintaining product quality, consumer trust, and adapting to ever-shifting industry trends.
Asia Pacific Functional Beverages Industry Segmentation
-
1. Product Type
- 1.1. Energy Drinks
- 1.2. Sports Drinks
- 1.3. Fortified Juices
- 1.4. Dairy and Dairy Alternative Beverage
- 1.5. Other Product Types
-
2. Distribution Channel
- 2.1. Supermarkets/Hypermarkets
- 2.2. Pharmacies/Drug Stores
- 2.3. Convenience Stores
- 2.4. Online Retail Stores
- 2.5. Other Distribution Channels
-
3. Geography
- 3.1. China
- 3.2. India
- 3.3. Japan
- 3.4. Australia
- 3.5. Rest of Asia-Pacific
Asia Pacific Functional Beverages Industry Segmentation By Geography
- 1. China
- 2. India
- 3. Japan
- 4. Australia
- 5. Rest of Asia Pacific
Asia Pacific Functional Beverages Industry REPORT HIGHLIGHTS
| Aspects | Details |
|---|---|
| Study Period | 2019-2033 |
| Base Year | 2024 |
| Estimated Year | 2025 |
| Forecast Period | 2025-2033 |
| Historical Period | 2019-2024 |
| Growth Rate | CAGR of 8.33% from 2019-2033 |
| Segmentation |
|
Table of Contents
- 1. Introduction
- 1.1. Research Scope
- 1.2. Market Segmentation
- 1.3. Research Methodology
- 1.4. Definitions and Assumptions
- 2. Executive Summary
- 2.1. Introduction
- 3. Market Dynamics
- 3.1. Introduction
- 3.2. Market Drivers
- 3.2.1. Growing Consumer Inclination Toward Low-sugar/Sugar-free Beverages; Expenditure on Advertisement and Promotional Activities
- 3.3. Market Restrains
- 3.3.1. Concerns Over Health Issues Associated with Functional Beverages
- 3.4. Market Trends
- 3.4.1. Growing Consumer Inclination Toward Low-Sugar/Sugar-free Beverages
- 4. Market Factor Analysis
- 4.1. Porters Five Forces
- 4.2. Supply/Value Chain
- 4.3. PESTEL analysis
- 4.4. Market Entropy
- 4.5. Patent/Trademark Analysis
- 5. Asia Pacific Functional Beverages Industry Analysis, Insights and Forecast, 2019-2031
- 5.1. Market Analysis, Insights and Forecast - by Product Type
- 5.1.1. Energy Drinks
- 5.1.2. Sports Drinks
- 5.1.3. Fortified Juices
- 5.1.4. Dairy and Dairy Alternative Beverage
- 5.1.5. Other Product Types
- 5.2. Market Analysis, Insights and Forecast - by Distribution Channel
- 5.2.1. Supermarkets/Hypermarkets
- 5.2.2. Pharmacies/Drug Stores
- 5.2.3. Convenience Stores
- 5.2.4. Online Retail Stores
- 5.2.5. Other Distribution Channels
- 5.3. Market Analysis, Insights and Forecast - by Geography
- 5.3.1. China
- 5.3.2. India
- 5.3.3. Japan
- 5.3.4. Australia
- 5.3.5. Rest of Asia-Pacific
- 5.4. Market Analysis, Insights and Forecast - by Region
- 5.4.1. China
- 5.4.2. India
- 5.4.3. Japan
- 5.4.4. Australia
- 5.4.5. Rest of Asia Pacific
- 5.1. Market Analysis, Insights and Forecast - by Product Type
- 6. China Asia Pacific Functional Beverages Industry Analysis, Insights and Forecast, 2019-2031
- 6.1. Market Analysis, Insights and Forecast - by Product Type
- 6.1.1. Energy Drinks
- 6.1.2. Sports Drinks
- 6.1.3. Fortified Juices
- 6.1.4. Dairy and Dairy Alternative Beverage
- 6.1.5. Other Product Types
- 6.2. Market Analysis, Insights and Forecast - by Distribution Channel
- 6.2.1. Supermarkets/Hypermarkets
- 6.2.2. Pharmacies/Drug Stores
- 6.2.3. Convenience Stores
- 6.2.4. Online Retail Stores
- 6.2.5. Other Distribution Channels
- 6.3. Market Analysis, Insights and Forecast - by Geography
- 6.3.1. China
- 6.3.2. India
- 6.3.3. Japan
- 6.3.4. Australia
- 6.3.5. Rest of Asia-Pacific
- 6.1. Market Analysis, Insights and Forecast - by Product Type
- 7. India Asia Pacific Functional Beverages Industry Analysis, Insights and Forecast, 2019-2031
- 7.1. Market Analysis, Insights and Forecast - by Product Type
- 7.1.1. Energy Drinks
- 7.1.2. Sports Drinks
- 7.1.3. Fortified Juices
- 7.1.4. Dairy and Dairy Alternative Beverage
- 7.1.5. Other Product Types
- 7.2. Market Analysis, Insights and Forecast - by Distribution Channel
- 7.2.1. Supermarkets/Hypermarkets
- 7.2.2. Pharmacies/Drug Stores
- 7.2.3. Convenience Stores
- 7.2.4. Online Retail Stores
- 7.2.5. Other Distribution Channels
- 7.3. Market Analysis, Insights and Forecast - by Geography
- 7.3.1. China
- 7.3.2. India
- 7.3.3. Japan
- 7.3.4. Australia
- 7.3.5. Rest of Asia-Pacific
- 7.1. Market Analysis, Insights and Forecast - by Product Type
- 8. Japan Asia Pacific Functional Beverages Industry Analysis, Insights and Forecast, 2019-2031
- 8.1. Market Analysis, Insights and Forecast - by Product Type
- 8.1.1. Energy Drinks
- 8.1.2. Sports Drinks
- 8.1.3. Fortified Juices
- 8.1.4. Dairy and Dairy Alternative Beverage
- 8.1.5. Other Product Types
- 8.2. Market Analysis, Insights and Forecast - by Distribution Channel
- 8.2.1. Supermarkets/Hypermarkets
- 8.2.2. Pharmacies/Drug Stores
- 8.2.3. Convenience Stores
- 8.2.4. Online Retail Stores
- 8.2.5. Other Distribution Channels
- 8.3. Market Analysis, Insights and Forecast - by Geography
- 8.3.1. China
- 8.3.2. India
- 8.3.3. Japan
- 8.3.4. Australia
- 8.3.5. Rest of Asia-Pacific
- 8.1. Market Analysis, Insights and Forecast - by Product Type
- 9. Australia Asia Pacific Functional Beverages Industry Analysis, Insights and Forecast, 2019-2031
- 9.1. Market Analysis, Insights and Forecast - by Product Type
- 9.1.1. Energy Drinks
- 9.1.2. Sports Drinks
- 9.1.3. Fortified Juices
- 9.1.4. Dairy and Dairy Alternative Beverage
- 9.1.5. Other Product Types
- 9.2. Market Analysis, Insights and Forecast - by Distribution Channel
- 9.2.1. Supermarkets/Hypermarkets
- 9.2.2. Pharmacies/Drug Stores
- 9.2.3. Convenience Stores
- 9.2.4. Online Retail Stores
- 9.2.5. Other Distribution Channels
- 9.3. Market Analysis, Insights and Forecast - by Geography
- 9.3.1. China
- 9.3.2. India
- 9.3.3. Japan
- 9.3.4. Australia
- 9.3.5. Rest of Asia-Pacific
- 9.1. Market Analysis, Insights and Forecast - by Product Type
- 10. Rest of Asia Pacific Asia Pacific Functional Beverages Industry Analysis, Insights and Forecast, 2019-2031
- 10.1. Market Analysis, Insights and Forecast - by Product Type
- 10.1.1. Energy Drinks
- 10.1.2. Sports Drinks
- 10.1.3. Fortified Juices
- 10.1.4. Dairy and Dairy Alternative Beverage
- 10.1.5. Other Product Types
- 10.2. Market Analysis, Insights and Forecast - by Distribution Channel
- 10.2.1. Supermarkets/Hypermarkets
- 10.2.2. Pharmacies/Drug Stores
- 10.2.3. Convenience Stores
- 10.2.4. Online Retail Stores
- 10.2.5. Other Distribution Channels
- 10.3. Market Analysis, Insights and Forecast - by Geography
- 10.3.1. China
- 10.3.2. India
- 10.3.3. Japan
- 10.3.4. Australia
- 10.3.5. Rest of Asia-Pacific
- 10.1. Market Analysis, Insights and Forecast - by Product Type
- 11. China Asia Pacific Functional Beverages Industry Analysis, Insights and Forecast, 2019-2031
- 12. Japan Asia Pacific Functional Beverages Industry Analysis, Insights and Forecast, 2019-2031
- 13. India Asia Pacific Functional Beverages Industry Analysis, Insights and Forecast, 2019-2031
- 14. South Korea Asia Pacific Functional Beverages Industry Analysis, Insights and Forecast, 2019-2031
- 15. Taiwan Asia Pacific Functional Beverages Industry Analysis, Insights and Forecast, 2019-2031
- 16. Australia Asia Pacific Functional Beverages Industry Analysis, Insights and Forecast, 2019-2031
- 17. Rest of Asia-Pacific Asia Pacific Functional Beverages Industry Analysis, Insights and Forecast, 2019-2031
- 18. Competitive Analysis
- 18.1. Market Share Analysis 2024
- 18.2. Company Profiles
- 18.2.1 Vitasoy International Holdings Ltd*List Not Exhaustive
- 18.2.1.1. Overview
- 18.2.1.2. Products
- 18.2.1.3. SWOT Analysis
- 18.2.1.4. Recent Developments
- 18.2.1.5. Financials (Based on Availability)
- 18.2.2 PepsiCo Inc
- 18.2.2.1. Overview
- 18.2.2.2. Products
- 18.2.2.3. SWOT Analysis
- 18.2.2.4. Recent Developments
- 18.2.2.5. Financials (Based on Availability)
- 18.2.3 Otsuka Holdings
- 18.2.3.1. Overview
- 18.2.3.2. Products
- 18.2.3.3. SWOT Analysis
- 18.2.3.4. Recent Developments
- 18.2.3.5. Financials (Based on Availability)
- 18.2.4 Suntory Holdings Limited
- 18.2.4.1. Overview
- 18.2.4.2. Products
- 18.2.4.3. SWOT Analysis
- 18.2.4.4. Recent Developments
- 18.2.4.5. Financials (Based on Availability)
- 18.2.5 Keurig Dr Pepper Inc
- 18.2.5.1. Overview
- 18.2.5.2. Products
- 18.2.5.3. SWOT Analysis
- 18.2.5.4. Recent Developments
- 18.2.5.5. Financials (Based on Availability)
- 18.2.6 Red Bull GmbH
- 18.2.6.1. Overview
- 18.2.6.2. Products
- 18.2.6.3. SWOT Analysis
- 18.2.6.4. Recent Developments
- 18.2.6.5. Financials (Based on Availability)
- 18.2.7 Danone S A
- 18.2.7.1. Overview
- 18.2.7.2. Products
- 18.2.7.3. SWOT Analysis
- 18.2.7.4. Recent Developments
- 18.2.7.5. Financials (Based on Availability)
- 18.2.8 The Coca-Cola Company
- 18.2.8.1. Overview
- 18.2.8.2. Products
- 18.2.8.3. SWOT Analysis
- 18.2.8.4. Recent Developments
- 18.2.8.5. Financials (Based on Availability)
- 18.2.9 Fonterra Co-operative Group Limited
- 18.2.9.1. Overview
- 18.2.9.2. Products
- 18.2.9.3. SWOT Analysis
- 18.2.9.4. Recent Developments
- 18.2.9.5. Financials (Based on Availability)
- 18.2.10 Nestlé S A
- 18.2.10.1. Overview
- 18.2.10.2. Products
- 18.2.10.3. SWOT Analysis
- 18.2.10.4. Recent Developments
- 18.2.10.5. Financials (Based on Availability)
- 18.2.1 Vitasoy International Holdings Ltd*List Not Exhaustive
List of Figures
- Figure 1: Asia Pacific Functional Beverages Industry Revenue Breakdown (Million, %) by Product 2024 & 2032
- Figure 2: Asia Pacific Functional Beverages Industry Share (%) by Company 2024
List of Tables
- Table 1: Asia Pacific Functional Beverages Industry Revenue Million Forecast, by Region 2019 & 2032
- Table 2: Asia Pacific Functional Beverages Industry Revenue Million Forecast, by Product Type 2019 & 2032
- Table 3: Asia Pacific Functional Beverages Industry Revenue Million Forecast, by Distribution Channel 2019 & 2032
- Table 4: Asia Pacific Functional Beverages Industry Revenue Million Forecast, by Geography 2019 & 2032
- Table 5: Asia Pacific Functional Beverages Industry Revenue Million Forecast, by Region 2019 & 2032
- Table 6: Asia Pacific Functional Beverages Industry Revenue Million Forecast, by Country 2019 & 2032
- Table 7: China Asia Pacific Functional Beverages Industry Revenue (Million) Forecast, by Application 2019 & 2032
- Table 8: Japan Asia Pacific Functional Beverages Industry Revenue (Million) Forecast, by Application 2019 & 2032
- Table 9: India Asia Pacific Functional Beverages Industry Revenue (Million) Forecast, by Application 2019 & 2032
- Table 10: South Korea Asia Pacific Functional Beverages Industry Revenue (Million) Forecast, by Application 2019 & 2032
- Table 11: Taiwan Asia Pacific Functional Beverages Industry Revenue (Million) Forecast, by Application 2019 & 2032
- Table 12: Australia Asia Pacific Functional Beverages Industry Revenue (Million) Forecast, by Application 2019 & 2032
- Table 13: Rest of Asia-Pacific Asia Pacific Functional Beverages Industry Revenue (Million) Forecast, by Application 2019 & 2032
- Table 14: Asia Pacific Functional Beverages Industry Revenue Million Forecast, by Product Type 2019 & 2032
- Table 15: Asia Pacific Functional Beverages Industry Revenue Million Forecast, by Distribution Channel 2019 & 2032
- Table 16: Asia Pacific Functional Beverages Industry Revenue Million Forecast, by Geography 2019 & 2032
- Table 17: Asia Pacific Functional Beverages Industry Revenue Million Forecast, by Country 2019 & 2032
- Table 18: Asia Pacific Functional Beverages Industry Revenue Million Forecast, by Product Type 2019 & 2032
- Table 19: Asia Pacific Functional Beverages Industry Revenue Million Forecast, by Distribution Channel 2019 & 2032
- Table 20: Asia Pacific Functional Beverages Industry Revenue Million Forecast, by Geography 2019 & 2032
- Table 21: Asia Pacific Functional Beverages Industry Revenue Million Forecast, by Country 2019 & 2032
- Table 22: Asia Pacific Functional Beverages Industry Revenue Million Forecast, by Product Type 2019 & 2032
- Table 23: Asia Pacific Functional Beverages Industry Revenue Million Forecast, by Distribution Channel 2019 & 2032
- Table 24: Asia Pacific Functional Beverages Industry Revenue Million Forecast, by Geography 2019 & 2032
- Table 25: Asia Pacific Functional Beverages Industry Revenue Million Forecast, by Country 2019 & 2032
- Table 26: Asia Pacific Functional Beverages Industry Revenue Million Forecast, by Product Type 2019 & 2032
- Table 27: Asia Pacific Functional Beverages Industry Revenue Million Forecast, by Distribution Channel 2019 & 2032
- Table 28: Asia Pacific Functional Beverages Industry Revenue Million Forecast, by Geography 2019 & 2032
- Table 29: Asia Pacific Functional Beverages Industry Revenue Million Forecast, by Country 2019 & 2032
- Table 30: Asia Pacific Functional Beverages Industry Revenue Million Forecast, by Product Type 2019 & 2032
- Table 31: Asia Pacific Functional Beverages Industry Revenue Million Forecast, by Distribution Channel 2019 & 2032
- Table 32: Asia Pacific Functional Beverages Industry Revenue Million Forecast, by Geography 2019 & 2032
- Table 33: Asia Pacific Functional Beverages Industry Revenue Million Forecast, by Country 2019 & 2032
Frequently Asked Questions
1. What is the projected Compound Annual Growth Rate (CAGR) of the Asia Pacific Functional Beverages Industry?
The projected CAGR is approximately 8.33%.
2. Which companies are prominent players in the Asia Pacific Functional Beverages Industry?
Key companies in the market include Vitasoy International Holdings Ltd*List Not Exhaustive, PepsiCo Inc, Otsuka Holdings, Suntory Holdings Limited, Keurig Dr Pepper Inc, Red Bull GmbH, Danone S A, The Coca-Cola Company, Fonterra Co-operative Group Limited, Nestlé S A.
3. What are the main segments of the Asia Pacific Functional Beverages Industry?
The market segments include Product Type, Distribution Channel, Geography.
4. Can you provide details about the market size?
The market size is estimated to be USD 98.53 Million as of 2022.
5. What are some drivers contributing to market growth?
Growing Consumer Inclination Toward Low-sugar/Sugar-free Beverages; Expenditure on Advertisement and Promotional Activities.
6. What are the notable trends driving market growth?
Growing Consumer Inclination Toward Low-Sugar/Sugar-free Beverages.
7. Are there any restraints impacting market growth?
Concerns Over Health Issues Associated with Functional Beverages.
8. Can you provide examples of recent developments in the market?
August 2022: Coca-Cola India introduced Limca Sportz, an n-fizz beverage based on glucose and electrolytes. Limca Sportz, which is made of water, helps people who are doing physically demanding activities like sports, exercise, and very hard chores rehydrate more quickly.
9. What pricing options are available for accessing the report?
Pricing options include single-user, multi-user, and enterprise licenses priced at USD 4750, USD 5250, and USD 8750 respectively.
10. Is the market size provided in terms of value or volume?
The market size is provided in terms of value, measured in Million.
11. Are there any specific market keywords associated with the report?
Yes, the market keyword associated with the report is "Asia Pacific Functional Beverages Industry," which aids in identifying and referencing the specific market segment covered.
12. How do I determine which pricing option suits my needs best?
The pricing options vary based on user requirements and access needs. Individual users may opt for single-user licenses, while businesses requiring broader access may choose multi-user or enterprise licenses for cost-effective access to the report.
13. Are there any additional resources or data provided in the Asia Pacific Functional Beverages Industry report?
While the report offers comprehensive insights, it's advisable to review the specific contents or supplementary materials provided to ascertain if additional resources or data are available.
14. How can I stay updated on further developments or reports in the Asia Pacific Functional Beverages Industry?
To stay informed about further developments, trends, and reports in the Asia Pacific Functional Beverages Industry, consider subscribing to industry newsletters, following relevant companies and organizations, or regularly checking reputable industry news sources and publications.
Methodology
Step 1 - Identification of Relevant Samples Size from Population Database


Step 2 - Approaches for Defining Global Market Size (Value, Volume* & Price*)

Note*: In applicable scenarios
Step 3 - Data Sources
Primary Research
- Web Analytics
- Survey Reports
- Research Institute
- Latest Research Reports
- Opinion Leaders
Secondary Research
- Annual Reports
- White Paper
- Latest Press Release
- Industry Association
- Paid Database
- Investor Presentations

Step 4 - Data Triangulation
Involves using different sources of information in order to increase the validity of a study
These sources are likely to be stakeholders in a program - participants, other researchers, program staff, other community members, and so on.
Then we put all data in single framework & apply various statistical tools to find out the dynamic on the market.
During the analysis stage, feedback from the stakeholder groups would be compared to determine areas of agreement as well as areas of divergence


