
Key Insights
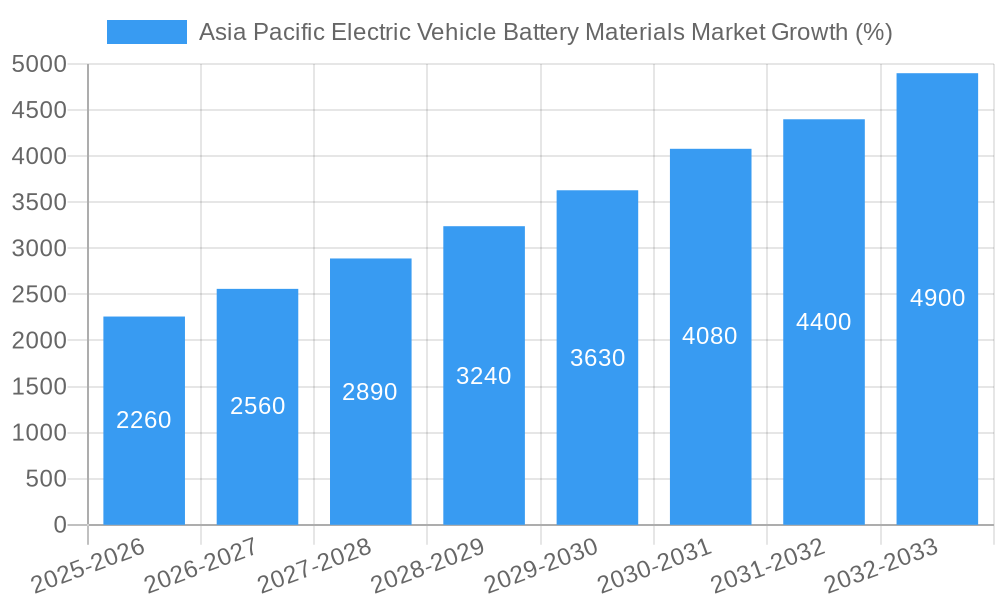
The Asia Pacific Electric Vehicle (EV) Battery Materials market is experiencing robust growth, projected to reach \$16.84 billion in 2025 and maintain a Compound Annual Growth Rate (CAGR) of 13.61% from 2025 to 2033. This expansion is driven by the accelerating adoption of electric vehicles across the region, fueled by government incentives, stringent emission regulations, and increasing consumer demand for eco-friendly transportation. Key market drivers include the rising investments in EV infrastructure, advancements in battery technology leading to improved energy density and lifespan, and the increasing focus on reducing carbon emissions. Furthermore, the growing presence of major automotive manufacturers and battery producers in the Asia Pacific region significantly contributes to market expansion. Trends such as the development of solid-state batteries and the increasing use of recycled materials are further shaping the market landscape. While challenges exist, such as the price volatility of raw materials and the need for efficient recycling infrastructure, the overall outlook remains positive, indicating significant opportunities for market players in the coming years. Leading companies such as Sumitomo Chemical, BASF, and LG Chem are strategically positioning themselves to capitalize on this growth.
The market segmentation, while not explicitly detailed, can be inferred to include various materials crucial for EV battery production, such as cathode materials (lithium, cobalt, nickel, manganese), anode materials (graphite), electrolytes, and separators. The regional composition likely reflects the strong concentration of EV manufacturing and battery production in countries like China, Japan, South Korea, and increasingly, Southeast Asian nations. The historical period (2019-2024) demonstrates a period of steady growth, forming a solid foundation for the robust expansion projected through 2033. The forecast period (2025-2033) highlights the significant potential for this sector, with considerable opportunities for both established players and new entrants.

Asia Pacific Electric Vehicle Battery Materials Market: A Comprehensive Report (2019-2033)
This in-depth report provides a comprehensive analysis of the Asia Pacific Electric Vehicle (EV) Battery Materials market, offering invaluable insights for stakeholders across the value chain. Covering the period 2019-2033, with a base year of 2025, this study meticulously examines market dynamics, competitive landscapes, and future growth trajectories. The report incorporates data from 2019-2024 (historical period), estimates for 2025 (estimated year), and forecasts for 2025-2033 (forecast period). Expect detailed analysis on market sizing in Millions, CAGR calculations, and impactful trends shaping this rapidly evolving sector.
Asia Pacific Electric Vehicle Battery Materials Market Market Structure & Competitive Dynamics
This section delves into the intricate structure of the Asia Pacific EV battery materials market, encompassing market concentration, innovation ecosystems, regulatory frameworks, product substitutes, end-user trends, and mergers & acquisitions (M&A) activities. We analyze the competitive landscape, assessing market share held by key players and exploring the implications of strategic alliances and acquisitions. The analysis considers the impact of government regulations on market growth and identifies potential disruptive technologies that could alter the existing market structure.
- Market Concentration: The market exhibits a [Insert Level of Concentration e.g., moderately concentrated] structure with the top five players holding approximately xx% of the market share in 2024.
- Innovation Ecosystems: Significant investments in R&D are driving innovation in battery material technologies, particularly in areas like solid-state batteries and improved cathode materials. Collaboration between material suppliers and battery manufacturers is crucial for innovation.
- Regulatory Frameworks: Government policies promoting EV adoption and stringent emission regulations are creating a favorable environment for market growth, particularly in China, Japan, and South Korea.
- Product Substitutes: While lithium-ion batteries currently dominate, research into alternative battery chemistries presents a potential threat.
- End-User Trends: The increasing demand for EVs across diverse segments, including passenger cars, commercial vehicles, and two-wheelers, is a key driver of market growth.
- M&A Activities: The past five years have witnessed [Number] significant M&A deals in the Asia Pacific EV battery materials market, with a total transaction value of approximately xx Million. These deals reflect the strategic importance of securing raw materials and technological capabilities.
Asia Pacific Electric Vehicle Battery Materials Market Industry Trends & Insights
This section provides a detailed examination of the key trends and insights shaping the Asia Pacific EV battery materials market. We analyze market growth drivers, technological disruptions, consumer preferences, and competitive dynamics. The impact of evolving consumer preferences, particularly concerning range and charging times, on battery material demand is evaluated, along with a forecast of the market's Compound Annual Growth Rate (CAGR) and market penetration during the forecast period. The influence of technological advancements on the adoption of various battery chemistries and the market's response to these changes are explored in detail. Specific metrics, such as market share by material type and region, are presented to illuminate the market landscape. The impact of geopolitical factors on supply chains and material costs is also assessed.
Dominant Markets & Segments in Asia Pacific Electric Vehicle Battery Materials Market
This section identifies the leading regions, countries, and segments within the Asia Pacific EV battery materials market. We analyze the key factors driving the dominance of these specific areas, using bullet points to highlight the critical drivers and dedicated paragraphs for a more thorough analysis. The dominance analysis considers both current market share and projected growth over the forecast period.
- China:
- Strong government support for EV adoption.
- Large domestic EV market.
- Extensive manufacturing base for battery materials.
- Japan:
- Technological advancements in battery materials.
- Established automotive industry.
- Focus on high-quality, long-lasting batteries.
- South Korea:
- Presence of major battery manufacturers.
- Investment in research and development.
- Strong export-oriented economy.
(Similar bullet points and paragraphs will be provided for other dominant regions/countries and segments)
Asia Pacific Electric Vehicle Battery Materials Market Product Innovations
Recent years have witnessed significant advancements in EV battery materials, focusing on enhancing energy density, extending lifespan, and improving safety. Key innovations include improvements in cathode and anode materials, solid-state battery technology, and advanced manufacturing processes. These innovations are driving the adoption of higher-performance batteries, shaping the competitive landscape and catering to growing consumer demand for improved EV performance. The market is witnessing a shift towards materials offering higher energy density and longer cycle life, along with increased focus on sustainability and cost reduction.
Report Segmentation & Scope
This report segments the Asia Pacific EV battery materials market based on [List segmentation criteria, e.g., Material Type (Cathode, Anode, Electrolyte), Battery Chemistry (Lithium-ion, Solid-State), Application (Passenger Vehicles, Commercial Vehicles), and Region (China, Japan, South Korea, etc.)]. Each segment's growth projections, market sizes, and competitive dynamics are analyzed separately. The report provides detailed information on each segment's market size, CAGR and key players.
Key Drivers of Asia Pacific Electric Vehicle Battery Materials Market Growth
Several key factors are driving the growth of the Asia Pacific EV battery materials market. Stringent emission regulations in various countries are pushing for greater EV adoption. Government incentives and subsidies are making EVs more affordable and accessible. Technological advancements are continuously improving battery performance, leading to increased consumer demand. The increasing awareness of environmental concerns is also fueling the shift towards eco-friendly transportation options. The expansion of charging infrastructure further contributes to market growth.
Challenges in the Asia Pacific Electric Vehicle Battery Materials Market Sector
Despite the significant growth potential, the Asia Pacific EV battery materials market faces several challenges. Supply chain disruptions, particularly for critical raw materials like lithium and cobalt, can impact production and pricing. Fluctuations in raw material prices pose a risk to the profitability of battery manufacturers. The development of advanced battery technologies requires substantial R&D investment. Geopolitical factors can also impact market stability and access to raw materials. Competition is intensifying as new players enter the market.
Leading Players in the Asia Pacific Electric Vehicle Battery Materials Market Market
This report profiles leading companies in the Asia Pacific EV battery materials market, including:
- Sumitomo Chemical Co Ltd
- BASF SE
- Mitsubishi Chemical Group Corporation
- UBE Corporation
- Umicore SA
- Contemporary Amperex Technology Co Limited
- Nichia Corporation
- ENTEK International LLC
- LG Chem
- Kureha Corporation
- List Not Exhaustive
Key Developments in Asia Pacific Electric Vehicle Battery Materials Market Sector
- November 2023: SK On Co. and BASF SE collaborated to develop industry-leading battery materials for lithium-ion batteries in North America and the Asia-Pacific, aiming to enhance long-term competitiveness.
- June 2023: Researchers in Japan developed a rechargeable solid-air battery using a proton-conductive polymer electrolyte and a redox-active organic negative electrode, demonstrating high performance near theoretical maximum capacity.
Strategic Asia Pacific Electric Vehicle Battery Materials Market Market Outlook
The Asia Pacific EV battery materials market is poised for significant growth over the forecast period. The increasing demand for EVs, coupled with ongoing technological advancements and supportive government policies, will drive market expansion. Strategic opportunities exist for companies focusing on sustainable and cost-effective battery materials, as well as those developing innovative battery technologies. The market will likely see further consolidation through mergers and acquisitions as companies seek to enhance their market position and secure access to key resources.
Asia Pacific Electric Vehicle Battery Materials Market Segmentation
-
1. Battery Type
- 1.1. Lithium-ion Battery
- 1.2. Lead-Acid Battery
- 1.3. Others
-
2. Material
- 2.1. Cathode
- 2.2. Anode
- 2.3. Electrolyte
- 2.4. Separator
- 2.5. Others
-
3. Geography
- 3.1. China
- 3.2. India
- 3.3. Australia
- 3.4. Japan
- 3.5. South Korea
- 3.6. Malaysia
- 3.7. Thailand
- 3.8. Indonesia
- 3.9. Vietnam
- 3.10. Rest of Asia-Pacific
Asia Pacific Electric Vehicle Battery Materials Market Segmentation By Geography
- 1. China
- 2. India
- 3. Australia
- 4. Japan
- 5. South Korea
- 6. Malaysia
- 7. Thailand
- 8. Indonesia
- 9. Vietnam
- 10. Rest of Asia Pacific

Asia Pacific Electric Vehicle Battery Materials Market REPORT HIGHLIGHTS
| Aspects | Details |
|---|---|
| Study Period | 2019-2033 |
| Base Year | 2024 |
| Estimated Year | 2025 |
| Forecast Period | 2025-2033 |
| Historical Period | 2019-2024 |
| Growth Rate | CAGR of 13.61% from 2019-2033 |
| Segmentation |
|
Table of Contents
- 1. Introduction
- 1.1. Research Scope
- 1.2. Market Segmentation
- 1.3. Research Methodology
- 1.4. Definitions and Assumptions
- 2. Executive Summary
- 2.1. Introduction
- 3. Market Dynamics
- 3.1. Introduction
- 3.2. Market Drivers
- 3.2.1. 4.; Growing Electric Vehicle Sales4.; Supportive Government Policies and Regulations
- 3.3. Market Restrains
- 3.3.1. 4.; Growing Electric Vehicle Sales4.; Supportive Government Policies and Regulations
- 3.4. Market Trends
- 3.4.1. Lithium-Ion Battery Type Dominate the Market
- 4. Market Factor Analysis
- 4.1. Porters Five Forces
- 4.2. Supply/Value Chain
- 4.3. PESTEL analysis
- 4.4. Market Entropy
- 4.5. Patent/Trademark Analysis
- 5. Global Asia Pacific Electric Vehicle Battery Materials Market Analysis, Insights and Forecast, 2019-2031
- 5.1. Market Analysis, Insights and Forecast - by Battery Type
- 5.1.1. Lithium-ion Battery
- 5.1.2. Lead-Acid Battery
- 5.1.3. Others
- 5.2. Market Analysis, Insights and Forecast - by Material
- 5.2.1. Cathode
- 5.2.2. Anode
- 5.2.3. Electrolyte
- 5.2.4. Separator
- 5.2.5. Others
- 5.3. Market Analysis, Insights and Forecast - by Geography
- 5.3.1. China
- 5.3.2. India
- 5.3.3. Australia
- 5.3.4. Japan
- 5.3.5. South Korea
- 5.3.6. Malaysia
- 5.3.7. Thailand
- 5.3.8. Indonesia
- 5.3.9. Vietnam
- 5.3.10. Rest of Asia-Pacific
- 5.4. Market Analysis, Insights and Forecast - by Region
- 5.4.1. China
- 5.4.2. India
- 5.4.3. Australia
- 5.4.4. Japan
- 5.4.5. South Korea
- 5.4.6. Malaysia
- 5.4.7. Thailand
- 5.4.8. Indonesia
- 5.4.9. Vietnam
- 5.4.10. Rest of Asia Pacific
- 5.1. Market Analysis, Insights and Forecast - by Battery Type
- 6. China Asia Pacific Electric Vehicle Battery Materials Market Analysis, Insights and Forecast, 2019-2031
- 6.1. Market Analysis, Insights and Forecast - by Battery Type
- 6.1.1. Lithium-ion Battery
- 6.1.2. Lead-Acid Battery
- 6.1.3. Others
- 6.2. Market Analysis, Insights and Forecast - by Material
- 6.2.1. Cathode
- 6.2.2. Anode
- 6.2.3. Electrolyte
- 6.2.4. Separator
- 6.2.5. Others
- 6.3. Market Analysis, Insights and Forecast - by Geography
- 6.3.1. China
- 6.3.2. India
- 6.3.3. Australia
- 6.3.4. Japan
- 6.3.5. South Korea
- 6.3.6. Malaysia
- 6.3.7. Thailand
- 6.3.8. Indonesia
- 6.3.9. Vietnam
- 6.3.10. Rest of Asia-Pacific
- 6.1. Market Analysis, Insights and Forecast - by Battery Type
- 7. India Asia Pacific Electric Vehicle Battery Materials Market Analysis, Insights and Forecast, 2019-2031
- 7.1. Market Analysis, Insights and Forecast - by Battery Type
- 7.1.1. Lithium-ion Battery
- 7.1.2. Lead-Acid Battery
- 7.1.3. Others
- 7.2. Market Analysis, Insights and Forecast - by Material
- 7.2.1. Cathode
- 7.2.2. Anode
- 7.2.3. Electrolyte
- 7.2.4. Separator
- 7.2.5. Others
- 7.3. Market Analysis, Insights and Forecast - by Geography
- 7.3.1. China
- 7.3.2. India
- 7.3.3. Australia
- 7.3.4. Japan
- 7.3.5. South Korea
- 7.3.6. Malaysia
- 7.3.7. Thailand
- 7.3.8. Indonesia
- 7.3.9. Vietnam
- 7.3.10. Rest of Asia-Pacific
- 7.1. Market Analysis, Insights and Forecast - by Battery Type
- 8. Australia Asia Pacific Electric Vehicle Battery Materials Market Analysis, Insights and Forecast, 2019-2031
- 8.1. Market Analysis, Insights and Forecast - by Battery Type
- 8.1.1. Lithium-ion Battery
- 8.1.2. Lead-Acid Battery
- 8.1.3. Others
- 8.2. Market Analysis, Insights and Forecast - by Material
- 8.2.1. Cathode
- 8.2.2. Anode
- 8.2.3. Electrolyte
- 8.2.4. Separator
- 8.2.5. Others
- 8.3. Market Analysis, Insights and Forecast - by Geography
- 8.3.1. China
- 8.3.2. India
- 8.3.3. Australia
- 8.3.4. Japan
- 8.3.5. South Korea
- 8.3.6. Malaysia
- 8.3.7. Thailand
- 8.3.8. Indonesia
- 8.3.9. Vietnam
- 8.3.10. Rest of Asia-Pacific
- 8.1. Market Analysis, Insights and Forecast - by Battery Type
- 9. Japan Asia Pacific Electric Vehicle Battery Materials Market Analysis, Insights and Forecast, 2019-2031
- 9.1. Market Analysis, Insights and Forecast - by Battery Type
- 9.1.1. Lithium-ion Battery
- 9.1.2. Lead-Acid Battery
- 9.1.3. Others
- 9.2. Market Analysis, Insights and Forecast - by Material
- 9.2.1. Cathode
- 9.2.2. Anode
- 9.2.3. Electrolyte
- 9.2.4. Separator
- 9.2.5. Others
- 9.3. Market Analysis, Insights and Forecast - by Geography
- 9.3.1. China
- 9.3.2. India
- 9.3.3. Australia
- 9.3.4. Japan
- 9.3.5. South Korea
- 9.3.6. Malaysia
- 9.3.7. Thailand
- 9.3.8. Indonesia
- 9.3.9. Vietnam
- 9.3.10. Rest of Asia-Pacific
- 9.1. Market Analysis, Insights and Forecast - by Battery Type
- 10. South Korea Asia Pacific Electric Vehicle Battery Materials Market Analysis, Insights and Forecast, 2019-2031
- 10.1. Market Analysis, Insights and Forecast - by Battery Type
- 10.1.1. Lithium-ion Battery
- 10.1.2. Lead-Acid Battery
- 10.1.3. Others
- 10.2. Market Analysis, Insights and Forecast - by Material
- 10.2.1. Cathode
- 10.2.2. Anode
- 10.2.3. Electrolyte
- 10.2.4. Separator
- 10.2.5. Others
- 10.3. Market Analysis, Insights and Forecast - by Geography
- 10.3.1. China
- 10.3.2. India
- 10.3.3. Australia
- 10.3.4. Japan
- 10.3.5. South Korea
- 10.3.6. Malaysia
- 10.3.7. Thailand
- 10.3.8. Indonesia
- 10.3.9. Vietnam
- 10.3.10. Rest of Asia-Pacific
- 10.1. Market Analysis, Insights and Forecast - by Battery Type
- 11. Malaysia Asia Pacific Electric Vehicle Battery Materials Market Analysis, Insights and Forecast, 2019-2031
- 11.1. Market Analysis, Insights and Forecast - by Battery Type
- 11.1.1. Lithium-ion Battery
- 11.1.2. Lead-Acid Battery
- 11.1.3. Others
- 11.2. Market Analysis, Insights and Forecast - by Material
- 11.2.1. Cathode
- 11.2.2. Anode
- 11.2.3. Electrolyte
- 11.2.4. Separator
- 11.2.5. Others
- 11.3. Market Analysis, Insights and Forecast - by Geography
- 11.3.1. China
- 11.3.2. India
- 11.3.3. Australia
- 11.3.4. Japan
- 11.3.5. South Korea
- 11.3.6. Malaysia
- 11.3.7. Thailand
- 11.3.8. Indonesia
- 11.3.9. Vietnam
- 11.3.10. Rest of Asia-Pacific
- 11.1. Market Analysis, Insights and Forecast - by Battery Type
- 12. Thailand Asia Pacific Electric Vehicle Battery Materials Market Analysis, Insights and Forecast, 2019-2031
- 12.1. Market Analysis, Insights and Forecast - by Battery Type
- 12.1.1. Lithium-ion Battery
- 12.1.2. Lead-Acid Battery
- 12.1.3. Others
- 12.2. Market Analysis, Insights and Forecast - by Material
- 12.2.1. Cathode
- 12.2.2. Anode
- 12.2.3. Electrolyte
- 12.2.4. Separator
- 12.2.5. Others
- 12.3. Market Analysis, Insights and Forecast - by Geography
- 12.3.1. China
- 12.3.2. India
- 12.3.3. Australia
- 12.3.4. Japan
- 12.3.5. South Korea
- 12.3.6. Malaysia
- 12.3.7. Thailand
- 12.3.8. Indonesia
- 12.3.9. Vietnam
- 12.3.10. Rest of Asia-Pacific
- 12.1. Market Analysis, Insights and Forecast - by Battery Type
- 13. Indonesia Asia Pacific Electric Vehicle Battery Materials Market Analysis, Insights and Forecast, 2019-2031
- 13.1. Market Analysis, Insights and Forecast - by Battery Type
- 13.1.1. Lithium-ion Battery
- 13.1.2. Lead-Acid Battery
- 13.1.3. Others
- 13.2. Market Analysis, Insights and Forecast - by Material
- 13.2.1. Cathode
- 13.2.2. Anode
- 13.2.3. Electrolyte
- 13.2.4. Separator
- 13.2.5. Others
- 13.3. Market Analysis, Insights and Forecast - by Geography
- 13.3.1. China
- 13.3.2. India
- 13.3.3. Australia
- 13.3.4. Japan
- 13.3.5. South Korea
- 13.3.6. Malaysia
- 13.3.7. Thailand
- 13.3.8. Indonesia
- 13.3.9. Vietnam
- 13.3.10. Rest of Asia-Pacific
- 13.1. Market Analysis, Insights and Forecast - by Battery Type
- 14. Vietnam Asia Pacific Electric Vehicle Battery Materials Market Analysis, Insights and Forecast, 2019-2031
- 14.1. Market Analysis, Insights and Forecast - by Battery Type
- 14.1.1. Lithium-ion Battery
- 14.1.2. Lead-Acid Battery
- 14.1.3. Others
- 14.2. Market Analysis, Insights and Forecast - by Material
- 14.2.1. Cathode
- 14.2.2. Anode
- 14.2.3. Electrolyte
- 14.2.4. Separator
- 14.2.5. Others
- 14.3. Market Analysis, Insights and Forecast - by Geography
- 14.3.1. China
- 14.3.2. India
- 14.3.3. Australia
- 14.3.4. Japan
- 14.3.5. South Korea
- 14.3.6. Malaysia
- 14.3.7. Thailand
- 14.3.8. Indonesia
- 14.3.9. Vietnam
- 14.3.10. Rest of Asia-Pacific
- 14.1. Market Analysis, Insights and Forecast - by Battery Type
- 15. Rest of Asia Pacific Asia Pacific Electric Vehicle Battery Materials Market Analysis, Insights and Forecast, 2019-2031
- 15.1. Market Analysis, Insights and Forecast - by Battery Type
- 15.1.1. Lithium-ion Battery
- 15.1.2. Lead-Acid Battery
- 15.1.3. Others
- 15.2. Market Analysis, Insights and Forecast - by Material
- 15.2.1. Cathode
- 15.2.2. Anode
- 15.2.3. Electrolyte
- 15.2.4. Separator
- 15.2.5. Others
- 15.3. Market Analysis, Insights and Forecast - by Geography
- 15.3.1. China
- 15.3.2. India
- 15.3.3. Australia
- 15.3.4. Japan
- 15.3.5. South Korea
- 15.3.6. Malaysia
- 15.3.7. Thailand
- 15.3.8. Indonesia
- 15.3.9. Vietnam
- 15.3.10. Rest of Asia-Pacific
- 15.1. Market Analysis, Insights and Forecast - by Battery Type
- 16. Competitive Analysis
- 16.1. Global Market Share Analysis 2024
- 16.2. Company Profiles
- 16.2.1 Sumitomo Chemical Co Ltd
- 16.2.1.1. Overview
- 16.2.1.2. Products
- 16.2.1.3. SWOT Analysis
- 16.2.1.4. Recent Developments
- 16.2.1.5. Financials (Based on Availability)
- 16.2.2 BASF SE
- 16.2.2.1. Overview
- 16.2.2.2. Products
- 16.2.2.3. SWOT Analysis
- 16.2.2.4. Recent Developments
- 16.2.2.5. Financials (Based on Availability)
- 16.2.3 Mitsubishi Chemical Group Corporation
- 16.2.3.1. Overview
- 16.2.3.2. Products
- 16.2.3.3. SWOT Analysis
- 16.2.3.4. Recent Developments
- 16.2.3.5. Financials (Based on Availability)
- 16.2.4 UBE Corporation
- 16.2.4.1. Overview
- 16.2.4.2. Products
- 16.2.4.3. SWOT Analysis
- 16.2.4.4. Recent Developments
- 16.2.4.5. Financials (Based on Availability)
- 16.2.5 Umicore SA
- 16.2.5.1. Overview
- 16.2.5.2. Products
- 16.2.5.3. SWOT Analysis
- 16.2.5.4. Recent Developments
- 16.2.5.5. Financials (Based on Availability)
- 16.2.6 Contemporary Amperex Technology Co Limited
- 16.2.6.1. Overview
- 16.2.6.2. Products
- 16.2.6.3. SWOT Analysis
- 16.2.6.4. Recent Developments
- 16.2.6.5. Financials (Based on Availability)
- 16.2.7 Nichia Corporation
- 16.2.7.1. Overview
- 16.2.7.2. Products
- 16.2.7.3. SWOT Analysis
- 16.2.7.4. Recent Developments
- 16.2.7.5. Financials (Based on Availability)
- 16.2.8 ENTEK International LLC
- 16.2.8.1. Overview
- 16.2.8.2. Products
- 16.2.8.3. SWOT Analysis
- 16.2.8.4. Recent Developments
- 16.2.8.5. Financials (Based on Availability)
- 16.2.9 LG Chem
- 16.2.9.1. Overview
- 16.2.9.2. Products
- 16.2.9.3. SWOT Analysis
- 16.2.9.4. Recent Developments
- 16.2.9.5. Financials (Based on Availability)
- 16.2.10 Kureha Corporation*List Not Exhaustive 6 4 List of Other Prominent Companies6 5 Market Ranking/ Share Analysi
- 16.2.10.1. Overview
- 16.2.10.2. Products
- 16.2.10.3. SWOT Analysis
- 16.2.10.4. Recent Developments
- 16.2.10.5. Financials (Based on Availability)
- 16.2.1 Sumitomo Chemical Co Ltd
List of Figures
- Figure 1: Global Asia Pacific Electric Vehicle Battery Materials Market Revenue Breakdown (Million, %) by Region 2024 & 2032
- Figure 2: Global Asia Pacific Electric Vehicle Battery Materials Market Volume Breakdown (Billion, %) by Region 2024 & 2032
- Figure 3: China Asia Pacific Electric Vehicle Battery Materials Market Revenue (Million), by Battery Type 2024 & 2032
- Figure 4: China Asia Pacific Electric Vehicle Battery Materials Market Volume (Billion), by Battery Type 2024 & 2032
- Figure 5: China Asia Pacific Electric Vehicle Battery Materials Market Revenue Share (%), by Battery Type 2024 & 2032
- Figure 6: China Asia Pacific Electric Vehicle Battery Materials Market Volume Share (%), by Battery Type 2024 & 2032
- Figure 7: China Asia Pacific Electric Vehicle Battery Materials Market Revenue (Million), by Material 2024 & 2032
- Figure 8: China Asia Pacific Electric Vehicle Battery Materials Market Volume (Billion), by Material 2024 & 2032
- Figure 9: China Asia Pacific Electric Vehicle Battery Materials Market Revenue Share (%), by Material 2024 & 2032
- Figure 10: China Asia Pacific Electric Vehicle Battery Materials Market Volume Share (%), by Material 2024 & 2032
- Figure 11: China Asia Pacific Electric Vehicle Battery Materials Market Revenue (Million), by Geography 2024 & 2032
- Figure 12: China Asia Pacific Electric Vehicle Battery Materials Market Volume (Billion), by Geography 2024 & 2032
- Figure 13: China Asia Pacific Electric Vehicle Battery Materials Market Revenue Share (%), by Geography 2024 & 2032
- Figure 14: China Asia Pacific Electric Vehicle Battery Materials Market Volume Share (%), by Geography 2024 & 2032
- Figure 15: China Asia Pacific Electric Vehicle Battery Materials Market Revenue (Million), by Country 2024 & 2032
- Figure 16: China Asia Pacific Electric Vehicle Battery Materials Market Volume (Billion), by Country 2024 & 2032
- Figure 17: China Asia Pacific Electric Vehicle Battery Materials Market Revenue Share (%), by Country 2024 & 2032
- Figure 18: China Asia Pacific Electric Vehicle Battery Materials Market Volume Share (%), by Country 2024 & 2032
- Figure 19: India Asia Pacific Electric Vehicle Battery Materials Market Revenue (Million), by Battery Type 2024 & 2032
- Figure 20: India Asia Pacific Electric Vehicle Battery Materials Market Volume (Billion), by Battery Type 2024 & 2032
- Figure 21: India Asia Pacific Electric Vehicle Battery Materials Market Revenue Share (%), by Battery Type 2024 & 2032
- Figure 22: India Asia Pacific Electric Vehicle Battery Materials Market Volume Share (%), by Battery Type 2024 & 2032
- Figure 23: India Asia Pacific Electric Vehicle Battery Materials Market Revenue (Million), by Material 2024 & 2032
- Figure 24: India Asia Pacific Electric Vehicle Battery Materials Market Volume (Billion), by Material 2024 & 2032
- Figure 25: India Asia Pacific Electric Vehicle Battery Materials Market Revenue Share (%), by Material 2024 & 2032
- Figure 26: India Asia Pacific Electric Vehicle Battery Materials Market Volume Share (%), by Material 2024 & 2032
- Figure 27: India Asia Pacific Electric Vehicle Battery Materials Market Revenue (Million), by Geography 2024 & 2032
- Figure 28: India Asia Pacific Electric Vehicle Battery Materials Market Volume (Billion), by Geography 2024 & 2032
- Figure 29: India Asia Pacific Electric Vehicle Battery Materials Market Revenue Share (%), by Geography 2024 & 2032
- Figure 30: India Asia Pacific Electric Vehicle Battery Materials Market Volume Share (%), by Geography 2024 & 2032
- Figure 31: India Asia Pacific Electric Vehicle Battery Materials Market Revenue (Million), by Country 2024 & 2032
- Figure 32: India Asia Pacific Electric Vehicle Battery Materials Market Volume (Billion), by Country 2024 & 2032
- Figure 33: India Asia Pacific Electric Vehicle Battery Materials Market Revenue Share (%), by Country 2024 & 2032
- Figure 34: India Asia Pacific Electric Vehicle Battery Materials Market Volume Share (%), by Country 2024 & 2032
- Figure 35: Australia Asia Pacific Electric Vehicle Battery Materials Market Revenue (Million), by Battery Type 2024 & 2032
- Figure 36: Australia Asia Pacific Electric Vehicle Battery Materials Market Volume (Billion), by Battery Type 2024 & 2032
- Figure 37: Australia Asia Pacific Electric Vehicle Battery Materials Market Revenue Share (%), by Battery Type 2024 & 2032
- Figure 38: Australia Asia Pacific Electric Vehicle Battery Materials Market Volume Share (%), by Battery Type 2024 & 2032
- Figure 39: Australia Asia Pacific Electric Vehicle Battery Materials Market Revenue (Million), by Material 2024 & 2032
- Figure 40: Australia Asia Pacific Electric Vehicle Battery Materials Market Volume (Billion), by Material 2024 & 2032
- Figure 41: Australia Asia Pacific Electric Vehicle Battery Materials Market Revenue Share (%), by Material 2024 & 2032
- Figure 42: Australia Asia Pacific Electric Vehicle Battery Materials Market Volume Share (%), by Material 2024 & 2032
- Figure 43: Australia Asia Pacific Electric Vehicle Battery Materials Market Revenue (Million), by Geography 2024 & 2032
- Figure 44: Australia Asia Pacific Electric Vehicle Battery Materials Market Volume (Billion), by Geography 2024 & 2032
- Figure 45: Australia Asia Pacific Electric Vehicle Battery Materials Market Revenue Share (%), by Geography 2024 & 2032
- Figure 46: Australia Asia Pacific Electric Vehicle Battery Materials Market Volume Share (%), by Geography 2024 & 2032
- Figure 47: Australia Asia Pacific Electric Vehicle Battery Materials Market Revenue (Million), by Country 2024 & 2032
- Figure 48: Australia Asia Pacific Electric Vehicle Battery Materials Market Volume (Billion), by Country 2024 & 2032
- Figure 49: Australia Asia Pacific Electric Vehicle Battery Materials Market Revenue Share (%), by Country 2024 & 2032
- Figure 50: Australia Asia Pacific Electric Vehicle Battery Materials Market Volume Share (%), by Country 2024 & 2032
- Figure 51: Japan Asia Pacific Electric Vehicle Battery Materials Market Revenue (Million), by Battery Type 2024 & 2032
- Figure 52: Japan Asia Pacific Electric Vehicle Battery Materials Market Volume (Billion), by Battery Type 2024 & 2032
- Figure 53: Japan Asia Pacific Electric Vehicle Battery Materials Market Revenue Share (%), by Battery Type 2024 & 2032
- Figure 54: Japan Asia Pacific Electric Vehicle Battery Materials Market Volume Share (%), by Battery Type 2024 & 2032
- Figure 55: Japan Asia Pacific Electric Vehicle Battery Materials Market Revenue (Million), by Material 2024 & 2032
- Figure 56: Japan Asia Pacific Electric Vehicle Battery Materials Market Volume (Billion), by Material 2024 & 2032
- Figure 57: Japan Asia Pacific Electric Vehicle Battery Materials Market Revenue Share (%), by Material 2024 & 2032
- Figure 58: Japan Asia Pacific Electric Vehicle Battery Materials Market Volume Share (%), by Material 2024 & 2032
- Figure 59: Japan Asia Pacific Electric Vehicle Battery Materials Market Revenue (Million), by Geography 2024 & 2032
- Figure 60: Japan Asia Pacific Electric Vehicle Battery Materials Market Volume (Billion), by Geography 2024 & 2032
- Figure 61: Japan Asia Pacific Electric Vehicle Battery Materials Market Revenue Share (%), by Geography 2024 & 2032
- Figure 62: Japan Asia Pacific Electric Vehicle Battery Materials Market Volume Share (%), by Geography 2024 & 2032
- Figure 63: Japan Asia Pacific Electric Vehicle Battery Materials Market Revenue (Million), by Country 2024 & 2032
- Figure 64: Japan Asia Pacific Electric Vehicle Battery Materials Market Volume (Billion), by Country 2024 & 2032
- Figure 65: Japan Asia Pacific Electric Vehicle Battery Materials Market Revenue Share (%), by Country 2024 & 2032
- Figure 66: Japan Asia Pacific Electric Vehicle Battery Materials Market Volume Share (%), by Country 2024 & 2032
- Figure 67: South Korea Asia Pacific Electric Vehicle Battery Materials Market Revenue (Million), by Battery Type 2024 & 2032
- Figure 68: South Korea Asia Pacific Electric Vehicle Battery Materials Market Volume (Billion), by Battery Type 2024 & 2032
- Figure 69: South Korea Asia Pacific Electric Vehicle Battery Materials Market Revenue Share (%), by Battery Type 2024 & 2032
- Figure 70: South Korea Asia Pacific Electric Vehicle Battery Materials Market Volume Share (%), by Battery Type 2024 & 2032
- Figure 71: South Korea Asia Pacific Electric Vehicle Battery Materials Market Revenue (Million), by Material 2024 & 2032
- Figure 72: South Korea Asia Pacific Electric Vehicle Battery Materials Market Volume (Billion), by Material 2024 & 2032
- Figure 73: South Korea Asia Pacific Electric Vehicle Battery Materials Market Revenue Share (%), by Material 2024 & 2032
- Figure 74: South Korea Asia Pacific Electric Vehicle Battery Materials Market Volume Share (%), by Material 2024 & 2032
- Figure 75: South Korea Asia Pacific Electric Vehicle Battery Materials Market Revenue (Million), by Geography 2024 & 2032
- Figure 76: South Korea Asia Pacific Electric Vehicle Battery Materials Market Volume (Billion), by Geography 2024 & 2032
- Figure 77: South Korea Asia Pacific Electric Vehicle Battery Materials Market Revenue Share (%), by Geography 2024 & 2032
- Figure 78: South Korea Asia Pacific Electric Vehicle Battery Materials Market Volume Share (%), by Geography 2024 & 2032
- Figure 79: South Korea Asia Pacific Electric Vehicle Battery Materials Market Revenue (Million), by Country 2024 & 2032
- Figure 80: South Korea Asia Pacific Electric Vehicle Battery Materials Market Volume (Billion), by Country 2024 & 2032
- Figure 81: South Korea Asia Pacific Electric Vehicle Battery Materials Market Revenue Share (%), by Country 2024 & 2032
- Figure 82: South Korea Asia Pacific Electric Vehicle Battery Materials Market Volume Share (%), by Country 2024 & 2032
- Figure 83: Malaysia Asia Pacific Electric Vehicle Battery Materials Market Revenue (Million), by Battery Type 2024 & 2032
- Figure 84: Malaysia Asia Pacific Electric Vehicle Battery Materials Market Volume (Billion), by Battery Type 2024 & 2032
- Figure 85: Malaysia Asia Pacific Electric Vehicle Battery Materials Market Revenue Share (%), by Battery Type 2024 & 2032
- Figure 86: Malaysia Asia Pacific Electric Vehicle Battery Materials Market Volume Share (%), by Battery Type 2024 & 2032
- Figure 87: Malaysia Asia Pacific Electric Vehicle Battery Materials Market Revenue (Million), by Material 2024 & 2032
- Figure 88: Malaysia Asia Pacific Electric Vehicle Battery Materials Market Volume (Billion), by Material 2024 & 2032
- Figure 89: Malaysia Asia Pacific Electric Vehicle Battery Materials Market Revenue Share (%), by Material 2024 & 2032
- Figure 90: Malaysia Asia Pacific Electric Vehicle Battery Materials Market Volume Share (%), by Material 2024 & 2032
- Figure 91: Malaysia Asia Pacific Electric Vehicle Battery Materials Market Revenue (Million), by Geography 2024 & 2032
- Figure 92: Malaysia Asia Pacific Electric Vehicle Battery Materials Market Volume (Billion), by Geography 2024 & 2032
- Figure 93: Malaysia Asia Pacific Electric Vehicle Battery Materials Market Revenue Share (%), by Geography 2024 & 2032
- Figure 94: Malaysia Asia Pacific Electric Vehicle Battery Materials Market Volume Share (%), by Geography 2024 & 2032
- Figure 95: Malaysia Asia Pacific Electric Vehicle Battery Materials Market Revenue (Million), by Country 2024 & 2032
- Figure 96: Malaysia Asia Pacific Electric Vehicle Battery Materials Market Volume (Billion), by Country 2024 & 2032
- Figure 97: Malaysia Asia Pacific Electric Vehicle Battery Materials Market Revenue Share (%), by Country 2024 & 2032
- Figure 98: Malaysia Asia Pacific Electric Vehicle Battery Materials Market Volume Share (%), by Country 2024 & 2032
- Figure 99: Thailand Asia Pacific Electric Vehicle Battery Materials Market Revenue (Million), by Battery Type 2024 & 2032
- Figure 100: Thailand Asia Pacific Electric Vehicle Battery Materials Market Volume (Billion), by Battery Type 2024 & 2032
- Figure 101: Thailand Asia Pacific Electric Vehicle Battery Materials Market Revenue Share (%), by Battery Type 2024 & 2032
- Figure 102: Thailand Asia Pacific Electric Vehicle Battery Materials Market Volume Share (%), by Battery Type 2024 & 2032
- Figure 103: Thailand Asia Pacific Electric Vehicle Battery Materials Market Revenue (Million), by Material 2024 & 2032
- Figure 104: Thailand Asia Pacific Electric Vehicle Battery Materials Market Volume (Billion), by Material 2024 & 2032
- Figure 105: Thailand Asia Pacific Electric Vehicle Battery Materials Market Revenue Share (%), by Material 2024 & 2032
- Figure 106: Thailand Asia Pacific Electric Vehicle Battery Materials Market Volume Share (%), by Material 2024 & 2032
- Figure 107: Thailand Asia Pacific Electric Vehicle Battery Materials Market Revenue (Million), by Geography 2024 & 2032
- Figure 108: Thailand Asia Pacific Electric Vehicle Battery Materials Market Volume (Billion), by Geography 2024 & 2032
- Figure 109: Thailand Asia Pacific Electric Vehicle Battery Materials Market Revenue Share (%), by Geography 2024 & 2032
- Figure 110: Thailand Asia Pacific Electric Vehicle Battery Materials Market Volume Share (%), by Geography 2024 & 2032
- Figure 111: Thailand Asia Pacific Electric Vehicle Battery Materials Market Revenue (Million), by Country 2024 & 2032
- Figure 112: Thailand Asia Pacific Electric Vehicle Battery Materials Market Volume (Billion), by Country 2024 & 2032
- Figure 113: Thailand Asia Pacific Electric Vehicle Battery Materials Market Revenue Share (%), by Country 2024 & 2032
- Figure 114: Thailand Asia Pacific Electric Vehicle Battery Materials Market Volume Share (%), by Country 2024 & 2032
- Figure 115: Indonesia Asia Pacific Electric Vehicle Battery Materials Market Revenue (Million), by Battery Type 2024 & 2032
- Figure 116: Indonesia Asia Pacific Electric Vehicle Battery Materials Market Volume (Billion), by Battery Type 2024 & 2032
- Figure 117: Indonesia Asia Pacific Electric Vehicle Battery Materials Market Revenue Share (%), by Battery Type 2024 & 2032
- Figure 118: Indonesia Asia Pacific Electric Vehicle Battery Materials Market Volume Share (%), by Battery Type 2024 & 2032
- Figure 119: Indonesia Asia Pacific Electric Vehicle Battery Materials Market Revenue (Million), by Material 2024 & 2032
- Figure 120: Indonesia Asia Pacific Electric Vehicle Battery Materials Market Volume (Billion), by Material 2024 & 2032
- Figure 121: Indonesia Asia Pacific Electric Vehicle Battery Materials Market Revenue Share (%), by Material 2024 & 2032
- Figure 122: Indonesia Asia Pacific Electric Vehicle Battery Materials Market Volume Share (%), by Material 2024 & 2032
- Figure 123: Indonesia Asia Pacific Electric Vehicle Battery Materials Market Revenue (Million), by Geography 2024 & 2032
- Figure 124: Indonesia Asia Pacific Electric Vehicle Battery Materials Market Volume (Billion), by Geography 2024 & 2032
- Figure 125: Indonesia Asia Pacific Electric Vehicle Battery Materials Market Revenue Share (%), by Geography 2024 & 2032
- Figure 126: Indonesia Asia Pacific Electric Vehicle Battery Materials Market Volume Share (%), by Geography 2024 & 2032
- Figure 127: Indonesia Asia Pacific Electric Vehicle Battery Materials Market Revenue (Million), by Country 2024 & 2032
- Figure 128: Indonesia Asia Pacific Electric Vehicle Battery Materials Market Volume (Billion), by Country 2024 & 2032
- Figure 129: Indonesia Asia Pacific Electric Vehicle Battery Materials Market Revenue Share (%), by Country 2024 & 2032
- Figure 130: Indonesia Asia Pacific Electric Vehicle Battery Materials Market Volume Share (%), by Country 2024 & 2032
- Figure 131: Vietnam Asia Pacific Electric Vehicle Battery Materials Market Revenue (Million), by Battery Type 2024 & 2032
- Figure 132: Vietnam Asia Pacific Electric Vehicle Battery Materials Market Volume (Billion), by Battery Type 2024 & 2032
- Figure 133: Vietnam Asia Pacific Electric Vehicle Battery Materials Market Revenue Share (%), by Battery Type 2024 & 2032
- Figure 134: Vietnam Asia Pacific Electric Vehicle Battery Materials Market Volume Share (%), by Battery Type 2024 & 2032
- Figure 135: Vietnam Asia Pacific Electric Vehicle Battery Materials Market Revenue (Million), by Material 2024 & 2032
- Figure 136: Vietnam Asia Pacific Electric Vehicle Battery Materials Market Volume (Billion), by Material 2024 & 2032
- Figure 137: Vietnam Asia Pacific Electric Vehicle Battery Materials Market Revenue Share (%), by Material 2024 & 2032
- Figure 138: Vietnam Asia Pacific Electric Vehicle Battery Materials Market Volume Share (%), by Material 2024 & 2032
- Figure 139: Vietnam Asia Pacific Electric Vehicle Battery Materials Market Revenue (Million), by Geography 2024 & 2032
- Figure 140: Vietnam Asia Pacific Electric Vehicle Battery Materials Market Volume (Billion), by Geography 2024 & 2032
- Figure 141: Vietnam Asia Pacific Electric Vehicle Battery Materials Market Revenue Share (%), by Geography 2024 & 2032
- Figure 142: Vietnam Asia Pacific Electric Vehicle Battery Materials Market Volume Share (%), by Geography 2024 & 2032
- Figure 143: Vietnam Asia Pacific Electric Vehicle Battery Materials Market Revenue (Million), by Country 2024 & 2032
- Figure 144: Vietnam Asia Pacific Electric Vehicle Battery Materials Market Volume (Billion), by Country 2024 & 2032
- Figure 145: Vietnam Asia Pacific Electric Vehicle Battery Materials Market Revenue Share (%), by Country 2024 & 2032
- Figure 146: Vietnam Asia Pacific Electric Vehicle Battery Materials Market Volume Share (%), by Country 2024 & 2032
- Figure 147: Rest of Asia Pacific Asia Pacific Electric Vehicle Battery Materials Market Revenue (Million), by Battery Type 2024 & 2032
- Figure 148: Rest of Asia Pacific Asia Pacific Electric Vehicle Battery Materials Market Volume (Billion), by Battery Type 2024 & 2032
- Figure 149: Rest of Asia Pacific Asia Pacific Electric Vehicle Battery Materials Market Revenue Share (%), by Battery Type 2024 & 2032
- Figure 150: Rest of Asia Pacific Asia Pacific Electric Vehicle Battery Materials Market Volume Share (%), by Battery Type 2024 & 2032
- Figure 151: Rest of Asia Pacific Asia Pacific Electric Vehicle Battery Materials Market Revenue (Million), by Material 2024 & 2032
- Figure 152: Rest of Asia Pacific Asia Pacific Electric Vehicle Battery Materials Market Volume (Billion), by Material 2024 & 2032
- Figure 153: Rest of Asia Pacific Asia Pacific Electric Vehicle Battery Materials Market Revenue Share (%), by Material 2024 & 2032
- Figure 154: Rest of Asia Pacific Asia Pacific Electric Vehicle Battery Materials Market Volume Share (%), by Material 2024 & 2032
- Figure 155: Rest of Asia Pacific Asia Pacific Electric Vehicle Battery Materials Market Revenue (Million), by Geography 2024 & 2032
- Figure 156: Rest of Asia Pacific Asia Pacific Electric Vehicle Battery Materials Market Volume (Billion), by Geography 2024 & 2032
- Figure 157: Rest of Asia Pacific Asia Pacific Electric Vehicle Battery Materials Market Revenue Share (%), by Geography 2024 & 2032
- Figure 158: Rest of Asia Pacific Asia Pacific Electric Vehicle Battery Materials Market Volume Share (%), by Geography 2024 & 2032
- Figure 159: Rest of Asia Pacific Asia Pacific Electric Vehicle Battery Materials Market Revenue (Million), by Country 2024 & 2032
- Figure 160: Rest of Asia Pacific Asia Pacific Electric Vehicle Battery Materials Market Volume (Billion), by Country 2024 & 2032
- Figure 161: Rest of Asia Pacific Asia Pacific Electric Vehicle Battery Materials Market Revenue Share (%), by Country 2024 & 2032
- Figure 162: Rest of Asia Pacific Asia Pacific Electric Vehicle Battery Materials Market Volume Share (%), by Country 2024 & 2032
List of Tables
- Table 1: Global Asia Pacific Electric Vehicle Battery Materials Market Revenue Million Forecast, by Region 2019 & 2032
- Table 2: Global Asia Pacific Electric Vehicle Battery Materials Market Volume Billion Forecast, by Region 2019 & 2032
- Table 3: Global Asia Pacific Electric Vehicle Battery Materials Market Revenue Million Forecast, by Battery Type 2019 & 2032
- Table 4: Global Asia Pacific Electric Vehicle Battery Materials Market Volume Billion Forecast, by Battery Type 2019 & 2032
- Table 5: Global Asia Pacific Electric Vehicle Battery Materials Market Revenue Million Forecast, by Material 2019 & 2032
- Table 6: Global Asia Pacific Electric Vehicle Battery Materials Market Volume Billion Forecast, by Material 2019 & 2032
- Table 7: Global Asia Pacific Electric Vehicle Battery Materials Market Revenue Million Forecast, by Geography 2019 & 2032
- Table 8: Global Asia Pacific Electric Vehicle Battery Materials Market Volume Billion Forecast, by Geography 2019 & 2032
- Table 9: Global Asia Pacific Electric Vehicle Battery Materials Market Revenue Million Forecast, by Region 2019 & 2032
- Table 10: Global Asia Pacific Electric Vehicle Battery Materials Market Volume Billion Forecast, by Region 2019 & 2032
- Table 11: Global Asia Pacific Electric Vehicle Battery Materials Market Revenue Million Forecast, by Battery Type 2019 & 2032
- Table 12: Global Asia Pacific Electric Vehicle Battery Materials Market Volume Billion Forecast, by Battery Type 2019 & 2032
- Table 13: Global Asia Pacific Electric Vehicle Battery Materials Market Revenue Million Forecast, by Material 2019 & 2032
- Table 14: Global Asia Pacific Electric Vehicle Battery Materials Market Volume Billion Forecast, by Material 2019 & 2032
- Table 15: Global Asia Pacific Electric Vehicle Battery Materials Market Revenue Million Forecast, by Geography 2019 & 2032
- Table 16: Global Asia Pacific Electric Vehicle Battery Materials Market Volume Billion Forecast, by Geography 2019 & 2032
- Table 17: Global Asia Pacific Electric Vehicle Battery Materials Market Revenue Million Forecast, by Country 2019 & 2032
- Table 18: Global Asia Pacific Electric Vehicle Battery Materials Market Volume Billion Forecast, by Country 2019 & 2032
- Table 19: Global Asia Pacific Electric Vehicle Battery Materials Market Revenue Million Forecast, by Battery Type 2019 & 2032
- Table 20: Global Asia Pacific Electric Vehicle Battery Materials Market Volume Billion Forecast, by Battery Type 2019 & 2032
- Table 21: Global Asia Pacific Electric Vehicle Battery Materials Market Revenue Million Forecast, by Material 2019 & 2032
- Table 22: Global Asia Pacific Electric Vehicle Battery Materials Market Volume Billion Forecast, by Material 2019 & 2032
- Table 23: Global Asia Pacific Electric Vehicle Battery Materials Market Revenue Million Forecast, by Geography 2019 & 2032
- Table 24: Global Asia Pacific Electric Vehicle Battery Materials Market Volume Billion Forecast, by Geography 2019 & 2032
- Table 25: Global Asia Pacific Electric Vehicle Battery Materials Market Revenue Million Forecast, by Country 2019 & 2032
- Table 26: Global Asia Pacific Electric Vehicle Battery Materials Market Volume Billion Forecast, by Country 2019 & 2032
- Table 27: Global Asia Pacific Electric Vehicle Battery Materials Market Revenue Million Forecast, by Battery Type 2019 & 2032
- Table 28: Global Asia Pacific Electric Vehicle Battery Materials Market Volume Billion Forecast, by Battery Type 2019 & 2032
- Table 29: Global Asia Pacific Electric Vehicle Battery Materials Market Revenue Million Forecast, by Material 2019 & 2032
- Table 30: Global Asia Pacific Electric Vehicle Battery Materials Market Volume Billion Forecast, by Material 2019 & 2032
- Table 31: Global Asia Pacific Electric Vehicle Battery Materials Market Revenue Million Forecast, by Geography 2019 & 2032
- Table 32: Global Asia Pacific Electric Vehicle Battery Materials Market Volume Billion Forecast, by Geography 2019 & 2032
- Table 33: Global Asia Pacific Electric Vehicle Battery Materials Market Revenue Million Forecast, by Country 2019 & 2032
- Table 34: Global Asia Pacific Electric Vehicle Battery Materials Market Volume Billion Forecast, by Country 2019 & 2032
- Table 35: Global Asia Pacific Electric Vehicle Battery Materials Market Revenue Million Forecast, by Battery Type 2019 & 2032
- Table 36: Global Asia Pacific Electric Vehicle Battery Materials Market Volume Billion Forecast, by Battery Type 2019 & 2032
- Table 37: Global Asia Pacific Electric Vehicle Battery Materials Market Revenue Million Forecast, by Material 2019 & 2032
- Table 38: Global Asia Pacific Electric Vehicle Battery Materials Market Volume Billion Forecast, by Material 2019 & 2032
- Table 39: Global Asia Pacific Electric Vehicle Battery Materials Market Revenue Million Forecast, by Geography 2019 & 2032
- Table 40: Global Asia Pacific Electric Vehicle Battery Materials Market Volume Billion Forecast, by Geography 2019 & 2032
- Table 41: Global Asia Pacific Electric Vehicle Battery Materials Market Revenue Million Forecast, by Country 2019 & 2032
- Table 42: Global Asia Pacific Electric Vehicle Battery Materials Market Volume Billion Forecast, by Country 2019 & 2032
- Table 43: Global Asia Pacific Electric Vehicle Battery Materials Market Revenue Million Forecast, by Battery Type 2019 & 2032
- Table 44: Global Asia Pacific Electric Vehicle Battery Materials Market Volume Billion Forecast, by Battery Type 2019 & 2032
- Table 45: Global Asia Pacific Electric Vehicle Battery Materials Market Revenue Million Forecast, by Material 2019 & 2032
- Table 46: Global Asia Pacific Electric Vehicle Battery Materials Market Volume Billion Forecast, by Material 2019 & 2032
- Table 47: Global Asia Pacific Electric Vehicle Battery Materials Market Revenue Million Forecast, by Geography 2019 & 2032
- Table 48: Global Asia Pacific Electric Vehicle Battery Materials Market Volume Billion Forecast, by Geography 2019 & 2032
- Table 49: Global Asia Pacific Electric Vehicle Battery Materials Market Revenue Million Forecast, by Country 2019 & 2032
- Table 50: Global Asia Pacific Electric Vehicle Battery Materials Market Volume Billion Forecast, by Country 2019 & 2032
- Table 51: Global Asia Pacific Electric Vehicle Battery Materials Market Revenue Million Forecast, by Battery Type 2019 & 2032
- Table 52: Global Asia Pacific Electric Vehicle Battery Materials Market Volume Billion Forecast, by Battery Type 2019 & 2032
- Table 53: Global Asia Pacific Electric Vehicle Battery Materials Market Revenue Million Forecast, by Material 2019 & 2032
- Table 54: Global Asia Pacific Electric Vehicle Battery Materials Market Volume Billion Forecast, by Material 2019 & 2032
- Table 55: Global Asia Pacific Electric Vehicle Battery Materials Market Revenue Million Forecast, by Geography 2019 & 2032
- Table 56: Global Asia Pacific Electric Vehicle Battery Materials Market Volume Billion Forecast, by Geography 2019 & 2032
- Table 57: Global Asia Pacific Electric Vehicle Battery Materials Market Revenue Million Forecast, by Country 2019 & 2032
- Table 58: Global Asia Pacific Electric Vehicle Battery Materials Market Volume Billion Forecast, by Country 2019 & 2032
- Table 59: Global Asia Pacific Electric Vehicle Battery Materials Market Revenue Million Forecast, by Battery Type 2019 & 2032
- Table 60: Global Asia Pacific Electric Vehicle Battery Materials Market Volume Billion Forecast, by Battery Type 2019 & 2032
- Table 61: Global Asia Pacific Electric Vehicle Battery Materials Market Revenue Million Forecast, by Material 2019 & 2032
- Table 62: Global Asia Pacific Electric Vehicle Battery Materials Market Volume Billion Forecast, by Material 2019 & 2032
- Table 63: Global Asia Pacific Electric Vehicle Battery Materials Market Revenue Million Forecast, by Geography 2019 & 2032
- Table 64: Global Asia Pacific Electric Vehicle Battery Materials Market Volume Billion Forecast, by Geography 2019 & 2032
- Table 65: Global Asia Pacific Electric Vehicle Battery Materials Market Revenue Million Forecast, by Country 2019 & 2032
- Table 66: Global Asia Pacific Electric Vehicle Battery Materials Market Volume Billion Forecast, by Country 2019 & 2032
- Table 67: Global Asia Pacific Electric Vehicle Battery Materials Market Revenue Million Forecast, by Battery Type 2019 & 2032
- Table 68: Global Asia Pacific Electric Vehicle Battery Materials Market Volume Billion Forecast, by Battery Type 2019 & 2032
- Table 69: Global Asia Pacific Electric Vehicle Battery Materials Market Revenue Million Forecast, by Material 2019 & 2032
- Table 70: Global Asia Pacific Electric Vehicle Battery Materials Market Volume Billion Forecast, by Material 2019 & 2032
- Table 71: Global Asia Pacific Electric Vehicle Battery Materials Market Revenue Million Forecast, by Geography 2019 & 2032
- Table 72: Global Asia Pacific Electric Vehicle Battery Materials Market Volume Billion Forecast, by Geography 2019 & 2032
- Table 73: Global Asia Pacific Electric Vehicle Battery Materials Market Revenue Million Forecast, by Country 2019 & 2032
- Table 74: Global Asia Pacific Electric Vehicle Battery Materials Market Volume Billion Forecast, by Country 2019 & 2032
- Table 75: Global Asia Pacific Electric Vehicle Battery Materials Market Revenue Million Forecast, by Battery Type 2019 & 2032
- Table 76: Global Asia Pacific Electric Vehicle Battery Materials Market Volume Billion Forecast, by Battery Type 2019 & 2032
- Table 77: Global Asia Pacific Electric Vehicle Battery Materials Market Revenue Million Forecast, by Material 2019 & 2032
- Table 78: Global Asia Pacific Electric Vehicle Battery Materials Market Volume Billion Forecast, by Material 2019 & 2032
- Table 79: Global Asia Pacific Electric Vehicle Battery Materials Market Revenue Million Forecast, by Geography 2019 & 2032
- Table 80: Global Asia Pacific Electric Vehicle Battery Materials Market Volume Billion Forecast, by Geography 2019 & 2032
- Table 81: Global Asia Pacific Electric Vehicle Battery Materials Market Revenue Million Forecast, by Country 2019 & 2032
- Table 82: Global Asia Pacific Electric Vehicle Battery Materials Market Volume Billion Forecast, by Country 2019 & 2032
- Table 83: Global Asia Pacific Electric Vehicle Battery Materials Market Revenue Million Forecast, by Battery Type 2019 & 2032
- Table 84: Global Asia Pacific Electric Vehicle Battery Materials Market Volume Billion Forecast, by Battery Type 2019 & 2032
- Table 85: Global Asia Pacific Electric Vehicle Battery Materials Market Revenue Million Forecast, by Material 2019 & 2032
- Table 86: Global Asia Pacific Electric Vehicle Battery Materials Market Volume Billion Forecast, by Material 2019 & 2032
- Table 87: Global Asia Pacific Electric Vehicle Battery Materials Market Revenue Million Forecast, by Geography 2019 & 2032
- Table 88: Global Asia Pacific Electric Vehicle Battery Materials Market Volume Billion Forecast, by Geography 2019 & 2032
- Table 89: Global Asia Pacific Electric Vehicle Battery Materials Market Revenue Million Forecast, by Country 2019 & 2032
- Table 90: Global Asia Pacific Electric Vehicle Battery Materials Market Volume Billion Forecast, by Country 2019 & 2032
Frequently Asked Questions
1. What is the projected Compound Annual Growth Rate (CAGR) of the Asia Pacific Electric Vehicle Battery Materials Market?
The projected CAGR is approximately 13.61%.
2. Which companies are prominent players in the Asia Pacific Electric Vehicle Battery Materials Market?
Key companies in the market include Sumitomo Chemical Co Ltd, BASF SE, Mitsubishi Chemical Group Corporation, UBE Corporation, Umicore SA, Contemporary Amperex Technology Co Limited, Nichia Corporation, ENTEK International LLC, LG Chem, Kureha Corporation*List Not Exhaustive 6 4 List of Other Prominent Companies6 5 Market Ranking/ Share Analysi.
3. What are the main segments of the Asia Pacific Electric Vehicle Battery Materials Market?
The market segments include Battery Type, Material, Geography.
4. Can you provide details about the market size?
The market size is estimated to be USD 16.84 Million as of 2022.
5. What are some drivers contributing to market growth?
4.; Growing Electric Vehicle Sales4.; Supportive Government Policies and Regulations.
6. What are the notable trends driving market growth?
Lithium-Ion Battery Type Dominate the Market.
7. Are there any restraints impacting market growth?
4.; Growing Electric Vehicle Sales4.; Supportive Government Policies and Regulations.
8. Can you provide examples of recent developments in the market?
November 2023: SK On Co., an electric vehicle battery maker, and BASF SE, a battery materials producer, collaborated to develop industry-leading battery materials for lithium-ion batteries in North America and the Asia-Pacific. The companies intended to improve long-term competitiveness amid slowing growth in the eco-friendly automobile industry.June 2023: Japan created a solid-air battery that can be recharged. Researchers have shown an all-solid-state rechargeable air battery made of a proton-conductive polymer electrolyte and a redox-active organic negative electrode. These batteries function well in the vicinity of their theoretical maximum capacity.
9. What pricing options are available for accessing the report?
Pricing options include single-user, multi-user, and enterprise licenses priced at USD 4750, USD 5250, and USD 8750 respectively.
10. Is the market size provided in terms of value or volume?
The market size is provided in terms of value, measured in Million and volume, measured in Billion.
11. Are there any specific market keywords associated with the report?
Yes, the market keyword associated with the report is "Asia Pacific Electric Vehicle Battery Materials Market," which aids in identifying and referencing the specific market segment covered.
12. How do I determine which pricing option suits my needs best?
The pricing options vary based on user requirements and access needs. Individual users may opt for single-user licenses, while businesses requiring broader access may choose multi-user or enterprise licenses for cost-effective access to the report.
13. Are there any additional resources or data provided in the Asia Pacific Electric Vehicle Battery Materials Market report?
While the report offers comprehensive insights, it's advisable to review the specific contents or supplementary materials provided to ascertain if additional resources or data are available.
14. How can I stay updated on further developments or reports in the Asia Pacific Electric Vehicle Battery Materials Market?
To stay informed about further developments, trends, and reports in the Asia Pacific Electric Vehicle Battery Materials Market, consider subscribing to industry newsletters, following relevant companies and organizations, or regularly checking reputable industry news sources and publications.
Methodology
Step 1 - Identification of Relevant Samples Size from Population Database


Step 2 - Approaches for Defining Global Market Size (Value, Volume* & Price*)

Note*: In applicable scenarios
Step 3 - Data Sources
Primary Research
- Web Analytics
- Survey Reports
- Research Institute
- Latest Research Reports
- Opinion Leaders
Secondary Research
- Annual Reports
- White Paper
- Latest Press Release
- Industry Association
- Paid Database
- Investor Presentations

Step 4 - Data Triangulation
Involves using different sources of information in order to increase the validity of a study
These sources are likely to be stakeholders in a program - participants, other researchers, program staff, other community members, and so on.
Then we put all data in single framework & apply various statistical tools to find out the dynamic on the market.
During the analysis stage, feedback from the stakeholder groups would be compared to determine areas of agreement as well as areas of divergence


