
Key Insights
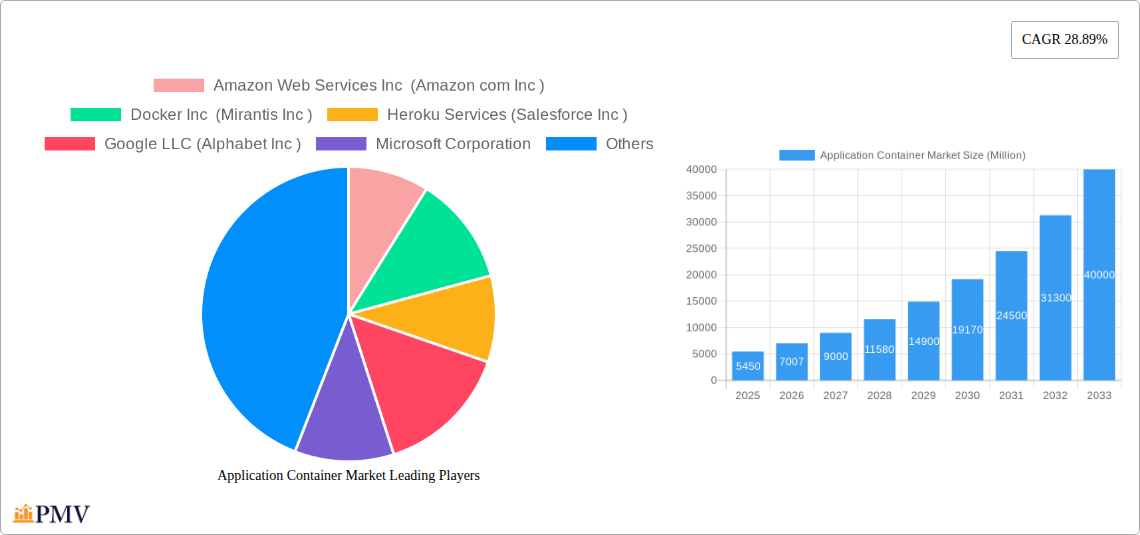
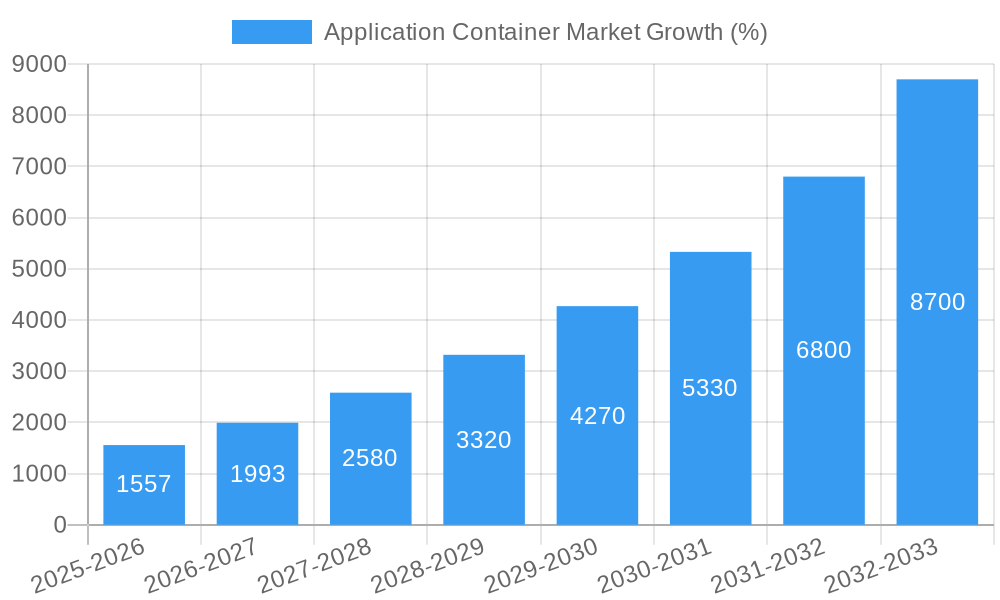
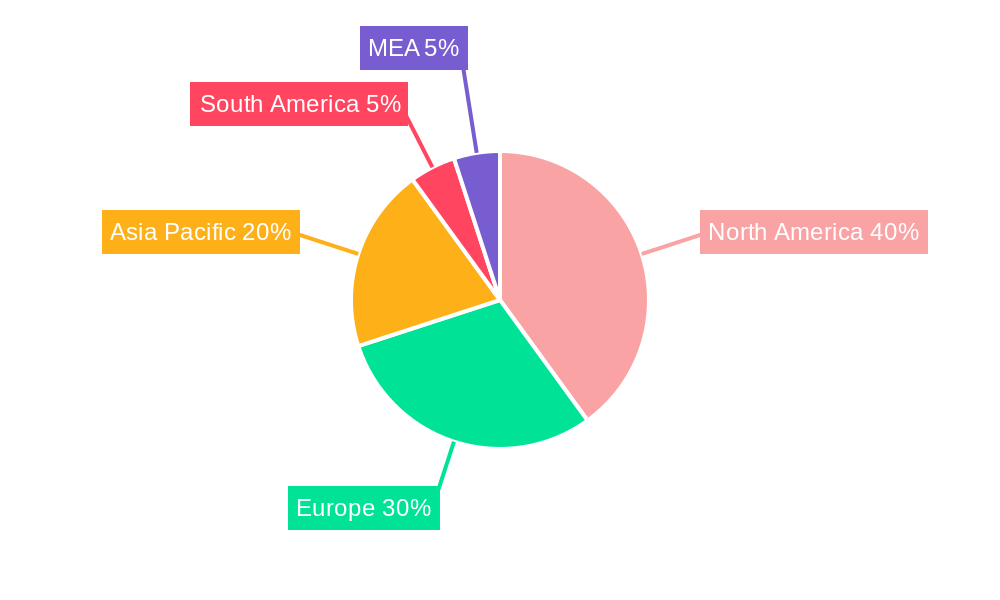
The Application Container market is experiencing robust growth, projected to reach \$5.45 billion in 2025 and exhibiting a remarkable Compound Annual Growth Rate (CAGR) of 28.89% from 2025 to 2033. This expansion is fueled by several key drivers. The increasing adoption of cloud-native architectures and microservices, coupled with the need for enhanced application portability and scalability, is significantly boosting market demand. Organizations across various industries, including BFSI, healthcare, and telecommunications, are increasingly leveraging containerization to streamline DevOps processes, improve resource utilization, and accelerate application deployment cycles. Furthermore, the rising popularity of Kubernetes and other container orchestration platforms is simplifying the management of complex containerized environments, further fueling market growth. The market's segmentation reveals strong performance across deployment types (cloud and on-premises), organization sizes (SMEs and large enterprises), and service offerings (monitoring, data management, networking, and support). North America currently holds a significant market share, followed by Europe and the Asia-Pacific region, reflecting a global trend towards containerization adoption.
Despite this positive outlook, certain restraints could impact market trajectory. The complexity associated with securing and managing containerized environments, coupled with the need for skilled professionals, could hinder wider adoption, particularly among smaller organizations. However, the continuous development of robust security tools and the emergence of managed container services are mitigating these concerns. The competitive landscape is dynamic, with prominent players like Amazon Web Services, Docker, Google, Microsoft, and Red Hat vying for market dominance through continuous innovation and strategic partnerships. The ongoing evolution of container technology and the emergence of serverless computing will likely further shape market dynamics in the coming years, fostering continued growth albeit with potential shifts in market share amongst the leading vendors.
Application Container Market: A Comprehensive Report (2019-2033)
This in-depth report provides a comprehensive analysis of the Application Container Market, offering valuable insights for businesses, investors, and industry professionals. The study period covers 2019-2033, with 2025 as the base and estimated year, and a forecast period of 2025-2033. The historical period analyzed is 2019-2024. The report delves into market segmentation, competitive dynamics, growth drivers, and challenges, providing a detailed understanding of this rapidly evolving market. The total market size in 2025 is estimated to be xx Million, projected to reach xx Million by 2033, exhibiting a CAGR of xx%.
Application Container Market Structure & Competitive Dynamics
This section analyzes the Application Container market's competitive landscape, encompassing market concentration, innovation ecosystems, regulatory frameworks, product substitutes, end-user trends, and mergers & acquisitions (M&A) activities. The market is characterized by a moderately consolidated structure with key players holding significant market share. Amazon Web Services, Microsoft, Docker, and Google are amongst the dominant players. The market share of these players is estimated to be around xx% collectively in 2025. Innovation within the application container space is rapid, driven by the need for enhanced security, scalability, and efficient resource management. Regulatory frameworks, particularly concerning data privacy and security, significantly influence market operations. The increasing adoption of cloud computing and microservices architecture fuels the demand for application containers, making them less susceptible to substitute technologies. End-user trends indicate a growing preference for container orchestration platforms and managed container services. M&A activity is prevalent, with several strategic acquisitions enhancing the capabilities and market reach of key players. For example, the acquisition of Engine Yard by Crossover Corporate Group demonstrates the consolidation within the application container market. The estimated total value of M&A deals in the Application Container Market between 2019 and 2024 was approximately xx Million.
- Market Concentration: Moderately consolidated, with a few major players dominating.
- Innovation Ecosystems: Rapid innovation driven by cloud adoption and microservices.
- Regulatory Frameworks: Significant impact on data security and privacy.
- Product Substitutes: Limited, with strong market position for containers.
- End-User Trends: Increased demand for orchestration and managed services.
- M&A Activity: Significant consolidation through acquisitions, valued at approximately xx Million (2019-2024).
Application Container Market Industry Trends & Insights
The Application Container market is experiencing robust growth, propelled by several key factors. The increasing adoption of cloud-native applications, the need for enhanced agility and scalability in IT infrastructure, and the rise of microservices architecture are driving the market's expansion. Technological disruptions, such as the development of serverless computing and edge computing, are further shaping the market landscape. Consumer preferences are shifting towards more efficient and secure container solutions. The competitive landscape is dynamic, with continuous innovation and strategic partnerships reshaping the market. The market penetration of application containers across various industries is steadily increasing, with higher adoption rates observed in sectors like IT and telecommunications. This high adoption stems from the need for faster deployment and increased efficiency in these industries.
Dominant Markets & Segments in Application Container Market
The Application Container market is segmented by deployment type (on-premises and cloud), organization size (SMEs and large enterprises), service (container monitoring & security, container data management & orchestration, container networking, container support & maintenance, and other services), and industry vertical (BFSI, healthcare and life science, telecommunication and IT, retail and e-commerce, education, media and entertainment, and others).
By Deployment Type: The cloud segment is dominating due to its scalability, cost-effectiveness, and ease of management. On-premises deployment remains relevant for organizations with stringent security requirements or legacy infrastructure.
By Organization Size: Large enterprises are leading the adoption due to their greater IT budgets and the need to manage complex applications. However, SMEs are increasingly adopting containers for their cost-effectiveness and improved agility.
By Service: Container orchestration and management solutions dominate the market, followed by container monitoring and security services. This is mainly due to the increasing complexity of managing containerized applications.
By Industry Vertical: The Telecommunication and IT sector leads in adoption due to their significant reliance on cloud-native applications and microservices. This sector's high adoption stems from the need for flexibility and scalability to handle large data loads and high traffic volumes.
Key drivers for dominance in specific segments include:
- Economic Policies: Government initiatives promoting digital transformation and cloud adoption.
- Infrastructure: Availability of robust cloud infrastructure and internet connectivity.
Application Container Market Product Innovations
Recent advancements in application containers focus on improving security, performance, and ease of management. Innovations include serverless Kubernetes solutions, enhanced container orchestration platforms, and improved container security tools. These innovations are driven by the need for better scalability, efficiency, and security in managing containerized applications, aligning with market demands for more robust and manageable solutions. The focus is on enhancing the developer experience, improving operational efficiency, and addressing security concerns.
Report Segmentation & Scope
This report provides a detailed analysis of the Application Container market across various segments. By Deployment Type: On-premises and Cloud deployments are analyzed, projecting significant growth for cloud deployments due to its inherent benefits. By Organization Size: SMEs and Large Enterprises are assessed, revealing distinct adoption patterns and growth trajectories for each. By Service: Market sizes and competitive dynamics are examined across Container Monitoring & Security, Container Data Management & Orchestration, Container Networking, Container Support & Maintenance, and Other Services, reflecting the varying growth rates and market shares of each service segment. By Industry Vertical: BFSI, Healthcare, Telecommunications, Retail, Education, Media & Entertainment and Other industry verticals' adoption trends, market sizes, and competitive dynamics are analyzed, providing insights into segment-specific growth drivers.
Key Drivers of Application Container Market Growth
The Application Container market's growth is driven by several key factors: the rise of microservices architecture, which favors containerized applications, the increasing adoption of cloud computing and cloud-native applications, the need for enhanced agility and scalability in IT operations, and the growing demand for improved security and management of containerized workloads. The development of efficient container orchestration platforms simplifies the deployment and management of containerized applications, boosting adoption.
Challenges in the Application Container Market Sector
Several factors hinder the Application Container market's growth. These include the complexity of managing containerized applications, the need for skilled professionals to operate containerized environments, security concerns relating to container vulnerabilities, and the potential for vendor lock-in with specific container platforms. Furthermore, the high cost of implementation and maintenance can be a barrier for some organizations.
Leading Players in the Application Container Market
- Amazon Web Services Inc (Amazon com Inc )
- Docker Inc (Mirantis Inc )
- Heroku Services (Salesforce Inc )
- Google LLC (Alphabet Inc )
- Microsoft Corporation
- Joyent Inc (Samsung Corporation)
- VMware Inc (Broadcom Inc )
- Red Hat Inc (IBM Corporation)
- Engine Yard Inc (Crossover Corporate Group)
- Oracle Corporation
Key Developments in Application Container Market Sector
- October 2022: Oracle launched serverless Kubernetes container management, simplifying cloud-native application development.
- January 2023: Landis+Gyr and MicroEJ partnered to enhance app development for smart meters, improving energy management.
Strategic Application Container Market Outlook
The Application Container market exhibits significant growth potential, fueled by the continued expansion of cloud computing, the rise of serverless computing, and the increasing adoption of microservices architecture. Strategic opportunities exist in developing innovative container security solutions, enhancing container orchestration platforms, and providing comprehensive managed container services. The focus on improving developer experience and addressing security concerns will drive further market growth.
Application Container Market Segmentation
-
1. Production Analysis
- 1.1. Container Platforms
- 1.2. Orchestration Tools
- 1.3. Software
-
2. Consumption Analysis
- 2.1. Cloud-Native Applications
- 2.2. Microservices
- 2.3. Data-Centric Applications
-
3. Import Market Analysis
- 3.1. Value
- 3.2. Volume
-
4. Export Market Analysis
- 4.1. Value
- 4.2. Volume
-
5. Price Trend Analysis
- 5.1. Container Platform Pricing
- 5.2. Orchestration Tool Pricing
- 5.3. Software Pricing
Application Container Market Segmentation By Geography
-
1. North America
- 1.1. United States
- 1.2. Canada
-
2. Europe
- 2.1. United Kingdom
- 2.2. Germany
- 2.3. France
- 2.4. Spain
-
3. Asia
- 3.1. China
- 3.2. India
- 3.3. Japan
- 4. Australia and New Zealand
-
5. Latin America
- 5.1. Brazil
- 5.2. Argentina
- 5.3. Mexico
-
6. Middle East and Africa
- 6.1. United Arab Emirates
- 6.2. Saudi Arabia
- 6.3. South Africa
Application Container Market REPORT HIGHLIGHTS
| Aspects | Details |
|---|---|
| Study Period | 2019-2033 |
| Base Year | 2024 |
| Estimated Year | 2025 |
| Forecast Period | 2025-2033 |
| Historical Period | 2019-2024 |
| Growth Rate | CAGR of 28.89% from 2019-2033 |
| Segmentation |
|
Table of Contents
- 1. Introduction
- 1.1. Research Scope
- 1.2. Market Segmentation
- 1.3. Research Methodology
- 1.4. Definitions and Assumptions
- 2. Executive Summary
- 2.1. Introduction
- 3. Market Dynamics
- 3.1. Introduction
- 3.2. Market Drivers
- 3.2.1. Efficient and Portable Characteristics of Application Containers to Drive the Market Growth; Rising Shift Towards Cloud-native Application Development
- 3.3. Market Restrains
- 3.3.1. Security Risks Associated With the Technology; Proliferation of Container Sprawl
- 3.4. Market Trends
- 3.4.1. Efficient and Portable Characteristics of Application Containers to Drive the Market Growth
- 4. Market Factor Analysis
- 4.1. Porters Five Forces
- 4.2. Supply/Value Chain
- 4.3. PESTEL analysis
- 4.4. Market Entropy
- 4.5. Patent/Trademark Analysis
- 5. Global Application Container Market Analysis, Insights and Forecast, 2019-2031
- 5.1. Market Analysis, Insights and Forecast - by Production Analysis
- 5.1.1. Container Platforms
- 5.1.2. Orchestration Tools
- 5.1.3. Software
- 5.2. Market Analysis, Insights and Forecast - by Consumption Analysis
- 5.2.1. Cloud-Native Applications
- 5.2.2. Microservices
- 5.2.3. Data-Centric Applications
- 5.3. Market Analysis, Insights and Forecast - by Import Market Analysis
- 5.3.1. Value
- 5.3.2. Volume
- 5.4. Market Analysis, Insights and Forecast - by Export Market Analysis
- 5.4.1. Value
- 5.4.2. Volume
- 5.5. Market Analysis, Insights and Forecast - by Price Trend Analysis
- 5.5.1. Container Platform Pricing
- 5.5.2. Orchestration Tool Pricing
- 5.5.3. Software Pricing
- 5.6. Market Analysis, Insights and Forecast - by Region
- 5.6.1. North America
- 5.6.2. Europe
- 5.6.3. Asia
- 5.6.4. Australia and New Zealand
- 5.6.5. Latin America
- 5.6.6. Middle East and Africa
- 5.1. Market Analysis, Insights and Forecast - by Production Analysis
- 6. North America Application Container Market Analysis, Insights and Forecast, 2019-2031
- 6.1. Market Analysis, Insights and Forecast - by Production Analysis
- 6.1.1. Container Platforms
- 6.1.2. Orchestration Tools
- 6.1.3. Software
- 6.2. Market Analysis, Insights and Forecast - by Consumption Analysis
- 6.2.1. Cloud-Native Applications
- 6.2.2. Microservices
- 6.2.3. Data-Centric Applications
- 6.3. Market Analysis, Insights and Forecast - by Import Market Analysis
- 6.3.1. Value
- 6.3.2. Volume
- 6.4. Market Analysis, Insights and Forecast - by Export Market Analysis
- 6.4.1. Value
- 6.4.2. Volume
- 6.5. Market Analysis, Insights and Forecast - by Price Trend Analysis
- 6.5.1. Container Platform Pricing
- 6.5.2. Orchestration Tool Pricing
- 6.5.3. Software Pricing
- 6.1. Market Analysis, Insights and Forecast - by Production Analysis
- 7. Europe Application Container Market Analysis, Insights and Forecast, 2019-2031
- 7.1. Market Analysis, Insights and Forecast - by Production Analysis
- 7.1.1. Container Platforms
- 7.1.2. Orchestration Tools
- 7.1.3. Software
- 7.2. Market Analysis, Insights and Forecast - by Consumption Analysis
- 7.2.1. Cloud-Native Applications
- 7.2.2. Microservices
- 7.2.3. Data-Centric Applications
- 7.3. Market Analysis, Insights and Forecast - by Import Market Analysis
- 7.3.1. Value
- 7.3.2. Volume
- 7.4. Market Analysis, Insights and Forecast - by Export Market Analysis
- 7.4.1. Value
- 7.4.2. Volume
- 7.5. Market Analysis, Insights and Forecast - by Price Trend Analysis
- 7.5.1. Container Platform Pricing
- 7.5.2. Orchestration Tool Pricing
- 7.5.3. Software Pricing
- 7.1. Market Analysis, Insights and Forecast - by Production Analysis
- 8. Asia Application Container Market Analysis, Insights and Forecast, 2019-2031
- 8.1. Market Analysis, Insights and Forecast - by Production Analysis
- 8.1.1. Container Platforms
- 8.1.2. Orchestration Tools
- 8.1.3. Software
- 8.2. Market Analysis, Insights and Forecast - by Consumption Analysis
- 8.2.1. Cloud-Native Applications
- 8.2.2. Microservices
- 8.2.3. Data-Centric Applications
- 8.3. Market Analysis, Insights and Forecast - by Import Market Analysis
- 8.3.1. Value
- 8.3.2. Volume
- 8.4. Market Analysis, Insights and Forecast - by Export Market Analysis
- 8.4.1. Value
- 8.4.2. Volume
- 8.5. Market Analysis, Insights and Forecast - by Price Trend Analysis
- 8.5.1. Container Platform Pricing
- 8.5.2. Orchestration Tool Pricing
- 8.5.3. Software Pricing
- 8.1. Market Analysis, Insights and Forecast - by Production Analysis
- 9. Australia and New Zealand Application Container Market Analysis, Insights and Forecast, 2019-2031
- 9.1. Market Analysis, Insights and Forecast - by Production Analysis
- 9.1.1. Container Platforms
- 9.1.2. Orchestration Tools
- 9.1.3. Software
- 9.2. Market Analysis, Insights and Forecast - by Consumption Analysis
- 9.2.1. Cloud-Native Applications
- 9.2.2. Microservices
- 9.2.3. Data-Centric Applications
- 9.3. Market Analysis, Insights and Forecast - by Import Market Analysis
- 9.3.1. Value
- 9.3.2. Volume
- 9.4. Market Analysis, Insights and Forecast - by Export Market Analysis
- 9.4.1. Value
- 9.4.2. Volume
- 9.5. Market Analysis, Insights and Forecast - by Price Trend Analysis
- 9.5.1. Container Platform Pricing
- 9.5.2. Orchestration Tool Pricing
- 9.5.3. Software Pricing
- 9.1. Market Analysis, Insights and Forecast - by Production Analysis
- 10. Latin America Application Container Market Analysis, Insights and Forecast, 2019-2031
- 10.1. Market Analysis, Insights and Forecast - by Production Analysis
- 10.1.1. Container Platforms
- 10.1.2. Orchestration Tools
- 10.1.3. Software
- 10.2. Market Analysis, Insights and Forecast - by Consumption Analysis
- 10.2.1. Cloud-Native Applications
- 10.2.2. Microservices
- 10.2.3. Data-Centric Applications
- 10.3. Market Analysis, Insights and Forecast - by Import Market Analysis
- 10.3.1. Value
- 10.3.2. Volume
- 10.4. Market Analysis, Insights and Forecast - by Export Market Analysis
- 10.4.1. Value
- 10.4.2. Volume
- 10.5. Market Analysis, Insights and Forecast - by Price Trend Analysis
- 10.5.1. Container Platform Pricing
- 10.5.2. Orchestration Tool Pricing
- 10.5.3. Software Pricing
- 10.1. Market Analysis, Insights and Forecast - by Production Analysis
- 11. Middle East and Africa Application Container Market Analysis, Insights and Forecast, 2019-2031
- 11.1. Market Analysis, Insights and Forecast - by Production Analysis
- 11.1.1. Container Platforms
- 11.1.2. Orchestration Tools
- 11.1.3. Software
- 11.2. Market Analysis, Insights and Forecast - by Consumption Analysis
- 11.2.1. Cloud-Native Applications
- 11.2.2. Microservices
- 11.2.3. Data-Centric Applications
- 11.3. Market Analysis, Insights and Forecast - by Import Market Analysis
- 11.3.1. Value
- 11.3.2. Volume
- 11.4. Market Analysis, Insights and Forecast - by Export Market Analysis
- 11.4.1. Value
- 11.4.2. Volume
- 11.5. Market Analysis, Insights and Forecast - by Price Trend Analysis
- 11.5.1. Container Platform Pricing
- 11.5.2. Orchestration Tool Pricing
- 11.5.3. Software Pricing
- 11.1. Market Analysis, Insights and Forecast - by Production Analysis
- 12. North America Application Container Market Analysis, Insights and Forecast, 2019-2031
- 12.1. Market Analysis, Insights and Forecast - By Country/Sub-region
- 12.1.1 United States
- 12.1.2 Canada
- 12.1.3 Mexico
- 13. Europe Application Container Market Analysis, Insights and Forecast, 2019-2031
- 13.1. Market Analysis, Insights and Forecast - By Country/Sub-region
- 13.1.1 Germany
- 13.1.2 United Kingdom
- 13.1.3 France
- 13.1.4 Spain
- 13.1.5 Italy
- 13.1.6 Spain
- 13.1.7 Belgium
- 13.1.8 Netherland
- 13.1.9 Nordics
- 13.1.10 Rest of Europe
- 14. Asia Pacific Application Container Market Analysis, Insights and Forecast, 2019-2031
- 14.1. Market Analysis, Insights and Forecast - By Country/Sub-region
- 14.1.1 China
- 14.1.2 Japan
- 14.1.3 India
- 14.1.4 South Korea
- 14.1.5 Southeast Asia
- 14.1.6 Australia
- 14.1.7 Indonesia
- 14.1.8 Phillipes
- 14.1.9 Singapore
- 14.1.10 Thailandc
- 14.1.11 Rest of Asia Pacific
- 15. South America Application Container Market Analysis, Insights and Forecast, 2019-2031
- 15.1. Market Analysis, Insights and Forecast - By Country/Sub-region
- 15.1.1 Brazil
- 15.1.2 Argentina
- 15.1.3 Peru
- 15.1.4 Chile
- 15.1.5 Colombia
- 15.1.6 Ecuador
- 15.1.7 Venezuela
- 15.1.8 Rest of South America
- 16. North America Application Container Market Analysis, Insights and Forecast, 2019-2031
- 16.1. Market Analysis, Insights and Forecast - By Country/Sub-region
- 16.1.1 United States
- 16.1.2 Canada
- 16.1.3 Mexico
- 17. MEA Application Container Market Analysis, Insights and Forecast, 2019-2031
- 17.1. Market Analysis, Insights and Forecast - By Country/Sub-region
- 17.1.1 United Arab Emirates
- 17.1.2 Saudi Arabia
- 17.1.3 South Africa
- 17.1.4 Rest of Middle East and Africa
- 18. Competitive Analysis
- 18.1. Global Market Share Analysis 2024
- 18.2. Company Profiles
- 18.2.1 Amazon Web Services Inc (Amazon com Inc )
- 18.2.1.1. Overview
- 18.2.1.2. Products
- 18.2.1.3. SWOT Analysis
- 18.2.1.4. Recent Developments
- 18.2.1.5. Financials (Based on Availability)
- 18.2.2 Docker Inc (Mirantis Inc )
- 18.2.2.1. Overview
- 18.2.2.2. Products
- 18.2.2.3. SWOT Analysis
- 18.2.2.4. Recent Developments
- 18.2.2.5. Financials (Based on Availability)
- 18.2.3 Heroku Services (Salesforce Inc )
- 18.2.3.1. Overview
- 18.2.3.2. Products
- 18.2.3.3. SWOT Analysis
- 18.2.3.4. Recent Developments
- 18.2.3.5. Financials (Based on Availability)
- 18.2.4 Google LLC (Alphabet Inc )
- 18.2.4.1. Overview
- 18.2.4.2. Products
- 18.2.4.3. SWOT Analysis
- 18.2.4.4. Recent Developments
- 18.2.4.5. Financials (Based on Availability)
- 18.2.5 Microsoft Corporation
- 18.2.5.1. Overview
- 18.2.5.2. Products
- 18.2.5.3. SWOT Analysis
- 18.2.5.4. Recent Developments
- 18.2.5.5. Financials (Based on Availability)
- 18.2.6 Joyent Inc (Samsung Corporation)
- 18.2.6.1. Overview
- 18.2.6.2. Products
- 18.2.6.3. SWOT Analysis
- 18.2.6.4. Recent Developments
- 18.2.6.5. Financials (Based on Availability)
- 18.2.7 VMware Inc (Broadcom Inc )
- 18.2.7.1. Overview
- 18.2.7.2. Products
- 18.2.7.3. SWOT Analysis
- 18.2.7.4. Recent Developments
- 18.2.7.5. Financials (Based on Availability)
- 18.2.8 Red Hat Inc (IBM Corporation)
- 18.2.8.1. Overview
- 18.2.8.2. Products
- 18.2.8.3. SWOT Analysis
- 18.2.8.4. Recent Developments
- 18.2.8.5. Financials (Based on Availability)
- 18.2.9 Engine Yard Inc (Crossover Corporate Group)
- 18.2.9.1. Overview
- 18.2.9.2. Products
- 18.2.9.3. SWOT Analysis
- 18.2.9.4. Recent Developments
- 18.2.9.5. Financials (Based on Availability)
- 18.2.10 Oracle Corporation
- 18.2.10.1. Overview
- 18.2.10.2. Products
- 18.2.10.3. SWOT Analysis
- 18.2.10.4. Recent Developments
- 18.2.10.5. Financials (Based on Availability)
- 18.2.1 Amazon Web Services Inc (Amazon com Inc )
List of Figures
- Figure 1: Global Application Container Market Revenue Breakdown (Million, %) by Region 2024 & 2032
- Figure 2: Global Application Container Market Volume Breakdown (K Unit, %) by Region 2024 & 2032
- Figure 3: North America Application Container Market Revenue (Million), by Country 2024 & 2032
- Figure 4: North America Application Container Market Volume (K Unit), by Country 2024 & 2032
- Figure 5: North America Application Container Market Revenue Share (%), by Country 2024 & 2032
- Figure 6: North America Application Container Market Volume Share (%), by Country 2024 & 2032
- Figure 7: Europe Application Container Market Revenue (Million), by Country 2024 & 2032
- Figure 8: Europe Application Container Market Volume (K Unit), by Country 2024 & 2032
- Figure 9: Europe Application Container Market Revenue Share (%), by Country 2024 & 2032
- Figure 10: Europe Application Container Market Volume Share (%), by Country 2024 & 2032
- Figure 11: Asia Pacific Application Container Market Revenue (Million), by Country 2024 & 2032
- Figure 12: Asia Pacific Application Container Market Volume (K Unit), by Country 2024 & 2032
- Figure 13: Asia Pacific Application Container Market Revenue Share (%), by Country 2024 & 2032
- Figure 14: Asia Pacific Application Container Market Volume Share (%), by Country 2024 & 2032
- Figure 15: South America Application Container Market Revenue (Million), by Country 2024 & 2032
- Figure 16: South America Application Container Market Volume (K Unit), by Country 2024 & 2032
- Figure 17: South America Application Container Market Revenue Share (%), by Country 2024 & 2032
- Figure 18: South America Application Container Market Volume Share (%), by Country 2024 & 2032
- Figure 19: North America Application Container Market Revenue (Million), by Country 2024 & 2032
- Figure 20: North America Application Container Market Volume (K Unit), by Country 2024 & 2032
- Figure 21: North America Application Container Market Revenue Share (%), by Country 2024 & 2032
- Figure 22: North America Application Container Market Volume Share (%), by Country 2024 & 2032
- Figure 23: MEA Application Container Market Revenue (Million), by Country 2024 & 2032
- Figure 24: MEA Application Container Market Volume (K Unit), by Country 2024 & 2032
- Figure 25: MEA Application Container Market Revenue Share (%), by Country 2024 & 2032
- Figure 26: MEA Application Container Market Volume Share (%), by Country 2024 & 2032
- Figure 27: North America Application Container Market Revenue (Million), by Production Analysis 2024 & 2032
- Figure 28: North America Application Container Market Volume (K Unit), by Production Analysis 2024 & 2032
- Figure 29: North America Application Container Market Revenue Share (%), by Production Analysis 2024 & 2032
- Figure 30: North America Application Container Market Volume Share (%), by Production Analysis 2024 & 2032
- Figure 31: North America Application Container Market Revenue (Million), by Consumption Analysis 2024 & 2032
- Figure 32: North America Application Container Market Volume (K Unit), by Consumption Analysis 2024 & 2032
- Figure 33: North America Application Container Market Revenue Share (%), by Consumption Analysis 2024 & 2032
- Figure 34: North America Application Container Market Volume Share (%), by Consumption Analysis 2024 & 2032
- Figure 35: North America Application Container Market Revenue (Million), by Import Market Analysis 2024 & 2032
- Figure 36: North America Application Container Market Volume (K Unit), by Import Market Analysis 2024 & 2032
- Figure 37: North America Application Container Market Revenue Share (%), by Import Market Analysis 2024 & 2032
- Figure 38: North America Application Container Market Volume Share (%), by Import Market Analysis 2024 & 2032
- Figure 39: North America Application Container Market Revenue (Million), by Export Market Analysis 2024 & 2032
- Figure 40: North America Application Container Market Volume (K Unit), by Export Market Analysis 2024 & 2032
- Figure 41: North America Application Container Market Revenue Share (%), by Export Market Analysis 2024 & 2032
- Figure 42: North America Application Container Market Volume Share (%), by Export Market Analysis 2024 & 2032
- Figure 43: North America Application Container Market Revenue (Million), by Price Trend Analysis 2024 & 2032
- Figure 44: North America Application Container Market Volume (K Unit), by Price Trend Analysis 2024 & 2032
- Figure 45: North America Application Container Market Revenue Share (%), by Price Trend Analysis 2024 & 2032
- Figure 46: North America Application Container Market Volume Share (%), by Price Trend Analysis 2024 & 2032
- Figure 47: North America Application Container Market Revenue (Million), by Country 2024 & 2032
- Figure 48: North America Application Container Market Volume (K Unit), by Country 2024 & 2032
- Figure 49: North America Application Container Market Revenue Share (%), by Country 2024 & 2032
- Figure 50: North America Application Container Market Volume Share (%), by Country 2024 & 2032
- Figure 51: Europe Application Container Market Revenue (Million), by Production Analysis 2024 & 2032
- Figure 52: Europe Application Container Market Volume (K Unit), by Production Analysis 2024 & 2032
- Figure 53: Europe Application Container Market Revenue Share (%), by Production Analysis 2024 & 2032
- Figure 54: Europe Application Container Market Volume Share (%), by Production Analysis 2024 & 2032
- Figure 55: Europe Application Container Market Revenue (Million), by Consumption Analysis 2024 & 2032
- Figure 56: Europe Application Container Market Volume (K Unit), by Consumption Analysis 2024 & 2032
- Figure 57: Europe Application Container Market Revenue Share (%), by Consumption Analysis 2024 & 2032
- Figure 58: Europe Application Container Market Volume Share (%), by Consumption Analysis 2024 & 2032
- Figure 59: Europe Application Container Market Revenue (Million), by Import Market Analysis 2024 & 2032
- Figure 60: Europe Application Container Market Volume (K Unit), by Import Market Analysis 2024 & 2032
- Figure 61: Europe Application Container Market Revenue Share (%), by Import Market Analysis 2024 & 2032
- Figure 62: Europe Application Container Market Volume Share (%), by Import Market Analysis 2024 & 2032
- Figure 63: Europe Application Container Market Revenue (Million), by Export Market Analysis 2024 & 2032
- Figure 64: Europe Application Container Market Volume (K Unit), by Export Market Analysis 2024 & 2032
- Figure 65: Europe Application Container Market Revenue Share (%), by Export Market Analysis 2024 & 2032
- Figure 66: Europe Application Container Market Volume Share (%), by Export Market Analysis 2024 & 2032
- Figure 67: Europe Application Container Market Revenue (Million), by Price Trend Analysis 2024 & 2032
- Figure 68: Europe Application Container Market Volume (K Unit), by Price Trend Analysis 2024 & 2032
- Figure 69: Europe Application Container Market Revenue Share (%), by Price Trend Analysis 2024 & 2032
- Figure 70: Europe Application Container Market Volume Share (%), by Price Trend Analysis 2024 & 2032
- Figure 71: Europe Application Container Market Revenue (Million), by Country 2024 & 2032
- Figure 72: Europe Application Container Market Volume (K Unit), by Country 2024 & 2032
- Figure 73: Europe Application Container Market Revenue Share (%), by Country 2024 & 2032
- Figure 74: Europe Application Container Market Volume Share (%), by Country 2024 & 2032
- Figure 75: Asia Application Container Market Revenue (Million), by Production Analysis 2024 & 2032
- Figure 76: Asia Application Container Market Volume (K Unit), by Production Analysis 2024 & 2032
- Figure 77: Asia Application Container Market Revenue Share (%), by Production Analysis 2024 & 2032
- Figure 78: Asia Application Container Market Volume Share (%), by Production Analysis 2024 & 2032
- Figure 79: Asia Application Container Market Revenue (Million), by Consumption Analysis 2024 & 2032
- Figure 80: Asia Application Container Market Volume (K Unit), by Consumption Analysis 2024 & 2032
- Figure 81: Asia Application Container Market Revenue Share (%), by Consumption Analysis 2024 & 2032
- Figure 82: Asia Application Container Market Volume Share (%), by Consumption Analysis 2024 & 2032
- Figure 83: Asia Application Container Market Revenue (Million), by Import Market Analysis 2024 & 2032
- Figure 84: Asia Application Container Market Volume (K Unit), by Import Market Analysis 2024 & 2032
- Figure 85: Asia Application Container Market Revenue Share (%), by Import Market Analysis 2024 & 2032
- Figure 86: Asia Application Container Market Volume Share (%), by Import Market Analysis 2024 & 2032
- Figure 87: Asia Application Container Market Revenue (Million), by Export Market Analysis 2024 & 2032
- Figure 88: Asia Application Container Market Volume (K Unit), by Export Market Analysis 2024 & 2032
- Figure 89: Asia Application Container Market Revenue Share (%), by Export Market Analysis 2024 & 2032
- Figure 90: Asia Application Container Market Volume Share (%), by Export Market Analysis 2024 & 2032
- Figure 91: Asia Application Container Market Revenue (Million), by Price Trend Analysis 2024 & 2032
- Figure 92: Asia Application Container Market Volume (K Unit), by Price Trend Analysis 2024 & 2032
- Figure 93: Asia Application Container Market Revenue Share (%), by Price Trend Analysis 2024 & 2032
- Figure 94: Asia Application Container Market Volume Share (%), by Price Trend Analysis 2024 & 2032
- Figure 95: Asia Application Container Market Revenue (Million), by Country 2024 & 2032
- Figure 96: Asia Application Container Market Volume (K Unit), by Country 2024 & 2032
- Figure 97: Asia Application Container Market Revenue Share (%), by Country 2024 & 2032
- Figure 98: Asia Application Container Market Volume Share (%), by Country 2024 & 2032
- Figure 99: Australia and New Zealand Application Container Market Revenue (Million), by Production Analysis 2024 & 2032
- Figure 100: Australia and New Zealand Application Container Market Volume (K Unit), by Production Analysis 2024 & 2032
- Figure 101: Australia and New Zealand Application Container Market Revenue Share (%), by Production Analysis 2024 & 2032
- Figure 102: Australia and New Zealand Application Container Market Volume Share (%), by Production Analysis 2024 & 2032
- Figure 103: Australia and New Zealand Application Container Market Revenue (Million), by Consumption Analysis 2024 & 2032
- Figure 104: Australia and New Zealand Application Container Market Volume (K Unit), by Consumption Analysis 2024 & 2032
- Figure 105: Australia and New Zealand Application Container Market Revenue Share (%), by Consumption Analysis 2024 & 2032
- Figure 106: Australia and New Zealand Application Container Market Volume Share (%), by Consumption Analysis 2024 & 2032
- Figure 107: Australia and New Zealand Application Container Market Revenue (Million), by Import Market Analysis 2024 & 2032
- Figure 108: Australia and New Zealand Application Container Market Volume (K Unit), by Import Market Analysis 2024 & 2032
- Figure 109: Australia and New Zealand Application Container Market Revenue Share (%), by Import Market Analysis 2024 & 2032
- Figure 110: Australia and New Zealand Application Container Market Volume Share (%), by Import Market Analysis 2024 & 2032
- Figure 111: Australia and New Zealand Application Container Market Revenue (Million), by Export Market Analysis 2024 & 2032
- Figure 112: Australia and New Zealand Application Container Market Volume (K Unit), by Export Market Analysis 2024 & 2032
- Figure 113: Australia and New Zealand Application Container Market Revenue Share (%), by Export Market Analysis 2024 & 2032
- Figure 114: Australia and New Zealand Application Container Market Volume Share (%), by Export Market Analysis 2024 & 2032
- Figure 115: Australia and New Zealand Application Container Market Revenue (Million), by Price Trend Analysis 2024 & 2032
- Figure 116: Australia and New Zealand Application Container Market Volume (K Unit), by Price Trend Analysis 2024 & 2032
- Figure 117: Australia and New Zealand Application Container Market Revenue Share (%), by Price Trend Analysis 2024 & 2032
- Figure 118: Australia and New Zealand Application Container Market Volume Share (%), by Price Trend Analysis 2024 & 2032
- Figure 119: Australia and New Zealand Application Container Market Revenue (Million), by Country 2024 & 2032
- Figure 120: Australia and New Zealand Application Container Market Volume (K Unit), by Country 2024 & 2032
- Figure 121: Australia and New Zealand Application Container Market Revenue Share (%), by Country 2024 & 2032
- Figure 122: Australia and New Zealand Application Container Market Volume Share (%), by Country 2024 & 2032
- Figure 123: Latin America Application Container Market Revenue (Million), by Production Analysis 2024 & 2032
- Figure 124: Latin America Application Container Market Volume (K Unit), by Production Analysis 2024 & 2032
- Figure 125: Latin America Application Container Market Revenue Share (%), by Production Analysis 2024 & 2032
- Figure 126: Latin America Application Container Market Volume Share (%), by Production Analysis 2024 & 2032
- Figure 127: Latin America Application Container Market Revenue (Million), by Consumption Analysis 2024 & 2032
- Figure 128: Latin America Application Container Market Volume (K Unit), by Consumption Analysis 2024 & 2032
- Figure 129: Latin America Application Container Market Revenue Share (%), by Consumption Analysis 2024 & 2032
- Figure 130: Latin America Application Container Market Volume Share (%), by Consumption Analysis 2024 & 2032
- Figure 131: Latin America Application Container Market Revenue (Million), by Import Market Analysis 2024 & 2032
- Figure 132: Latin America Application Container Market Volume (K Unit), by Import Market Analysis 2024 & 2032
- Figure 133: Latin America Application Container Market Revenue Share (%), by Import Market Analysis 2024 & 2032
- Figure 134: Latin America Application Container Market Volume Share (%), by Import Market Analysis 2024 & 2032
- Figure 135: Latin America Application Container Market Revenue (Million), by Export Market Analysis 2024 & 2032
- Figure 136: Latin America Application Container Market Volume (K Unit), by Export Market Analysis 2024 & 2032
- Figure 137: Latin America Application Container Market Revenue Share (%), by Export Market Analysis 2024 & 2032
- Figure 138: Latin America Application Container Market Volume Share (%), by Export Market Analysis 2024 & 2032
- Figure 139: Latin America Application Container Market Revenue (Million), by Price Trend Analysis 2024 & 2032
- Figure 140: Latin America Application Container Market Volume (K Unit), by Price Trend Analysis 2024 & 2032
- Figure 141: Latin America Application Container Market Revenue Share (%), by Price Trend Analysis 2024 & 2032
- Figure 142: Latin America Application Container Market Volume Share (%), by Price Trend Analysis 2024 & 2032
- Figure 143: Latin America Application Container Market Revenue (Million), by Country 2024 & 2032
- Figure 144: Latin America Application Container Market Volume (K Unit), by Country 2024 & 2032
- Figure 145: Latin America Application Container Market Revenue Share (%), by Country 2024 & 2032
- Figure 146: Latin America Application Container Market Volume Share (%), by Country 2024 & 2032
- Figure 147: Middle East and Africa Application Container Market Revenue (Million), by Production Analysis 2024 & 2032
- Figure 148: Middle East and Africa Application Container Market Volume (K Unit), by Production Analysis 2024 & 2032
- Figure 149: Middle East and Africa Application Container Market Revenue Share (%), by Production Analysis 2024 & 2032
- Figure 150: Middle East and Africa Application Container Market Volume Share (%), by Production Analysis 2024 & 2032
- Figure 151: Middle East and Africa Application Container Market Revenue (Million), by Consumption Analysis 2024 & 2032
- Figure 152: Middle East and Africa Application Container Market Volume (K Unit), by Consumption Analysis 2024 & 2032
- Figure 153: Middle East and Africa Application Container Market Revenue Share (%), by Consumption Analysis 2024 & 2032
- Figure 154: Middle East and Africa Application Container Market Volume Share (%), by Consumption Analysis 2024 & 2032
- Figure 155: Middle East and Africa Application Container Market Revenue (Million), by Import Market Analysis 2024 & 2032
- Figure 156: Middle East and Africa Application Container Market Volume (K Unit), by Import Market Analysis 2024 & 2032
- Figure 157: Middle East and Africa Application Container Market Revenue Share (%), by Import Market Analysis 2024 & 2032
- Figure 158: Middle East and Africa Application Container Market Volume Share (%), by Import Market Analysis 2024 & 2032
- Figure 159: Middle East and Africa Application Container Market Revenue (Million), by Export Market Analysis 2024 & 2032
- Figure 160: Middle East and Africa Application Container Market Volume (K Unit), by Export Market Analysis 2024 & 2032
- Figure 161: Middle East and Africa Application Container Market Revenue Share (%), by Export Market Analysis 2024 & 2032
- Figure 162: Middle East and Africa Application Container Market Volume Share (%), by Export Market Analysis 2024 & 2032
- Figure 163: Middle East and Africa Application Container Market Revenue (Million), by Price Trend Analysis 2024 & 2032
- Figure 164: Middle East and Africa Application Container Market Volume (K Unit), by Price Trend Analysis 2024 & 2032
- Figure 165: Middle East and Africa Application Container Market Revenue Share (%), by Price Trend Analysis 2024 & 2032
- Figure 166: Middle East and Africa Application Container Market Volume Share (%), by Price Trend Analysis 2024 & 2032
- Figure 167: Middle East and Africa Application Container Market Revenue (Million), by Country 2024 & 2032
- Figure 168: Middle East and Africa Application Container Market Volume (K Unit), by Country 2024 & 2032
- Figure 169: Middle East and Africa Application Container Market Revenue Share (%), by Country 2024 & 2032
- Figure 170: Middle East and Africa Application Container Market Volume Share (%), by Country 2024 & 2032
List of Tables
- Table 1: Global Application Container Market Revenue Million Forecast, by Region 2019 & 2032
- Table 2: Global Application Container Market Volume K Unit Forecast, by Region 2019 & 2032
- Table 3: Global Application Container Market Revenue Million Forecast, by Production Analysis 2019 & 2032
- Table 4: Global Application Container Market Volume K Unit Forecast, by Production Analysis 2019 & 2032
- Table 5: Global Application Container Market Revenue Million Forecast, by Consumption Analysis 2019 & 2032
- Table 6: Global Application Container Market Volume K Unit Forecast, by Consumption Analysis 2019 & 2032
- Table 7: Global Application Container Market Revenue Million Forecast, by Import Market Analysis 2019 & 2032
- Table 8: Global Application Container Market Volume K Unit Forecast, by Import Market Analysis 2019 & 2032
- Table 9: Global Application Container Market Revenue Million Forecast, by Export Market Analysis 2019 & 2032
- Table 10: Global Application Container Market Volume K Unit Forecast, by Export Market Analysis 2019 & 2032
- Table 11: Global Application Container Market Revenue Million Forecast, by Price Trend Analysis 2019 & 2032
- Table 12: Global Application Container Market Volume K Unit Forecast, by Price Trend Analysis 2019 & 2032
- Table 13: Global Application Container Market Revenue Million Forecast, by Region 2019 & 2032
- Table 14: Global Application Container Market Volume K Unit Forecast, by Region 2019 & 2032
- Table 15: Global Application Container Market Revenue Million Forecast, by Country 2019 & 2032
- Table 16: Global Application Container Market Volume K Unit Forecast, by Country 2019 & 2032
- Table 17: United States Application Container Market Revenue (Million) Forecast, by Application 2019 & 2032
- Table 18: United States Application Container Market Volume (K Unit) Forecast, by Application 2019 & 2032
- Table 19: Canada Application Container Market Revenue (Million) Forecast, by Application 2019 & 2032
- Table 20: Canada Application Container Market Volume (K Unit) Forecast, by Application 2019 & 2032
- Table 21: Mexico Application Container Market Revenue (Million) Forecast, by Application 2019 & 2032
- Table 22: Mexico Application Container Market Volume (K Unit) Forecast, by Application 2019 & 2032
- Table 23: Global Application Container Market Revenue Million Forecast, by Country 2019 & 2032
- Table 24: Global Application Container Market Volume K Unit Forecast, by Country 2019 & 2032
- Table 25: Germany Application Container Market Revenue (Million) Forecast, by Application 2019 & 2032
- Table 26: Germany Application Container Market Volume (K Unit) Forecast, by Application 2019 & 2032
- Table 27: United Kingdom Application Container Market Revenue (Million) Forecast, by Application 2019 & 2032
- Table 28: United Kingdom Application Container Market Volume (K Unit) Forecast, by Application 2019 & 2032
- Table 29: France Application Container Market Revenue (Million) Forecast, by Application 2019 & 2032
- Table 30: France Application Container Market Volume (K Unit) Forecast, by Application 2019 & 2032
- Table 31: Spain Application Container Market Revenue (Million) Forecast, by Application 2019 & 2032
- Table 32: Spain Application Container Market Volume (K Unit) Forecast, by Application 2019 & 2032
- Table 33: Italy Application Container Market Revenue (Million) Forecast, by Application 2019 & 2032
- Table 34: Italy Application Container Market Volume (K Unit) Forecast, by Application 2019 & 2032
- Table 35: Spain Application Container Market Revenue (Million) Forecast, by Application 2019 & 2032
- Table 36: Spain Application Container Market Volume (K Unit) Forecast, by Application 2019 & 2032
- Table 37: Belgium Application Container Market Revenue (Million) Forecast, by Application 2019 & 2032
- Table 38: Belgium Application Container Market Volume (K Unit) Forecast, by Application 2019 & 2032
- Table 39: Netherland Application Container Market Revenue (Million) Forecast, by Application 2019 & 2032
- Table 40: Netherland Application Container Market Volume (K Unit) Forecast, by Application 2019 & 2032
- Table 41: Nordics Application Container Market Revenue (Million) Forecast, by Application 2019 & 2032
- Table 42: Nordics Application Container Market Volume (K Unit) Forecast, by Application 2019 & 2032
- Table 43: Rest of Europe Application Container Market Revenue (Million) Forecast, by Application 2019 & 2032
- Table 44: Rest of Europe Application Container Market Volume (K Unit) Forecast, by Application 2019 & 2032
- Table 45: Global Application Container Market Revenue Million Forecast, by Country 2019 & 2032
- Table 46: Global Application Container Market Volume K Unit Forecast, by Country 2019 & 2032
- Table 47: China Application Container Market Revenue (Million) Forecast, by Application 2019 & 2032
- Table 48: China Application Container Market Volume (K Unit) Forecast, by Application 2019 & 2032
- Table 49: Japan Application Container Market Revenue (Million) Forecast, by Application 2019 & 2032
- Table 50: Japan Application Container Market Volume (K Unit) Forecast, by Application 2019 & 2032
- Table 51: India Application Container Market Revenue (Million) Forecast, by Application 2019 & 2032
- Table 52: India Application Container Market Volume (K Unit) Forecast, by Application 2019 & 2032
- Table 53: South Korea Application Container Market Revenue (Million) Forecast, by Application 2019 & 2032
- Table 54: South Korea Application Container Market Volume (K Unit) Forecast, by Application 2019 & 2032
- Table 55: Southeast Asia Application Container Market Revenue (Million) Forecast, by Application 2019 & 2032
- Table 56: Southeast Asia Application Container Market Volume (K Unit) Forecast, by Application 2019 & 2032
- Table 57: Australia Application Container Market Revenue (Million) Forecast, by Application 2019 & 2032
- Table 58: Australia Application Container Market Volume (K Unit) Forecast, by Application 2019 & 2032
- Table 59: Indonesia Application Container Market Revenue (Million) Forecast, by Application 2019 & 2032
- Table 60: Indonesia Application Container Market Volume (K Unit) Forecast, by Application 2019 & 2032
- Table 61: Phillipes Application Container Market Revenue (Million) Forecast, by Application 2019 & 2032
- Table 62: Phillipes Application Container Market Volume (K Unit) Forecast, by Application 2019 & 2032
- Table 63: Singapore Application Container Market Revenue (Million) Forecast, by Application 2019 & 2032
- Table 64: Singapore Application Container Market Volume (K Unit) Forecast, by Application 2019 & 2032
- Table 65: Thailandc Application Container Market Revenue (Million) Forecast, by Application 2019 & 2032
- Table 66: Thailandc Application Container Market Volume (K Unit) Forecast, by Application 2019 & 2032
- Table 67: Rest of Asia Pacific Application Container Market Revenue (Million) Forecast, by Application 2019 & 2032
- Table 68: Rest of Asia Pacific Application Container Market Volume (K Unit) Forecast, by Application 2019 & 2032
- Table 69: Global Application Container Market Revenue Million Forecast, by Country 2019 & 2032
- Table 70: Global Application Container Market Volume K Unit Forecast, by Country 2019 & 2032
- Table 71: Brazil Application Container Market Revenue (Million) Forecast, by Application 2019 & 2032
- Table 72: Brazil Application Container Market Volume (K Unit) Forecast, by Application 2019 & 2032
- Table 73: Argentina Application Container Market Revenue (Million) Forecast, by Application 2019 & 2032
- Table 74: Argentina Application Container Market Volume (K Unit) Forecast, by Application 2019 & 2032
- Table 75: Peru Application Container Market Revenue (Million) Forecast, by Application 2019 & 2032
- Table 76: Peru Application Container Market Volume (K Unit) Forecast, by Application 2019 & 2032
- Table 77: Chile Application Container Market Revenue (Million) Forecast, by Application 2019 & 2032
- Table 78: Chile Application Container Market Volume (K Unit) Forecast, by Application 2019 & 2032
- Table 79: Colombia Application Container Market Revenue (Million) Forecast, by Application 2019 & 2032
- Table 80: Colombia Application Container Market Volume (K Unit) Forecast, by Application 2019 & 2032
- Table 81: Ecuador Application Container Market Revenue (Million) Forecast, by Application 2019 & 2032
- Table 82: Ecuador Application Container Market Volume (K Unit) Forecast, by Application 2019 & 2032
- Table 83: Venezuela Application Container Market Revenue (Million) Forecast, by Application 2019 & 2032
- Table 84: Venezuela Application Container Market Volume (K Unit) Forecast, by Application 2019 & 2032
- Table 85: Rest of South America Application Container Market Revenue (Million) Forecast, by Application 2019 & 2032
- Table 86: Rest of South America Application Container Market Volume (K Unit) Forecast, by Application 2019 & 2032
- Table 87: Global Application Container Market Revenue Million Forecast, by Country 2019 & 2032
- Table 88: Global Application Container Market Volume K Unit Forecast, by Country 2019 & 2032
- Table 89: United States Application Container Market Revenue (Million) Forecast, by Application 2019 & 2032
- Table 90: United States Application Container Market Volume (K Unit) Forecast, by Application 2019 & 2032
- Table 91: Canada Application Container Market Revenue (Million) Forecast, by Application 2019 & 2032
- Table 92: Canada Application Container Market Volume (K Unit) Forecast, by Application 2019 & 2032
- Table 93: Mexico Application Container Market Revenue (Million) Forecast, by Application 2019 & 2032
- Table 94: Mexico Application Container Market Volume (K Unit) Forecast, by Application 2019 & 2032
- Table 95: Global Application Container Market Revenue Million Forecast, by Country 2019 & 2032
- Table 96: Global Application Container Market Volume K Unit Forecast, by Country 2019 & 2032
- Table 97: United Arab Emirates Application Container Market Revenue (Million) Forecast, by Application 2019 & 2032
- Table 98: United Arab Emirates Application Container Market Volume (K Unit) Forecast, by Application 2019 & 2032
- Table 99: Saudi Arabia Application Container Market Revenue (Million) Forecast, by Application 2019 & 2032
- Table 100: Saudi Arabia Application Container Market Volume (K Unit) Forecast, by Application 2019 & 2032
- Table 101: South Africa Application Container Market Revenue (Million) Forecast, by Application 2019 & 2032
- Table 102: South Africa Application Container Market Volume (K Unit) Forecast, by Application 2019 & 2032
- Table 103: Rest of Middle East and Africa Application Container Market Revenue (Million) Forecast, by Application 2019 & 2032
- Table 104: Rest of Middle East and Africa Application Container Market Volume (K Unit) Forecast, by Application 2019 & 2032
- Table 105: Global Application Container Market Revenue Million Forecast, by Production Analysis 2019 & 2032
- Table 106: Global Application Container Market Volume K Unit Forecast, by Production Analysis 2019 & 2032
- Table 107: Global Application Container Market Revenue Million Forecast, by Consumption Analysis 2019 & 2032
- Table 108: Global Application Container Market Volume K Unit Forecast, by Consumption Analysis 2019 & 2032
- Table 109: Global Application Container Market Revenue Million Forecast, by Import Market Analysis 2019 & 2032
- Table 110: Global Application Container Market Volume K Unit Forecast, by Import Market Analysis 2019 & 2032
- Table 111: Global Application Container Market Revenue Million Forecast, by Export Market Analysis 2019 & 2032
- Table 112: Global Application Container Market Volume K Unit Forecast, by Export Market Analysis 2019 & 2032
- Table 113: Global Application Container Market Revenue Million Forecast, by Price Trend Analysis 2019 & 2032
- Table 114: Global Application Container Market Volume K Unit Forecast, by Price Trend Analysis 2019 & 2032
- Table 115: Global Application Container Market Revenue Million Forecast, by Country 2019 & 2032
- Table 116: Global Application Container Market Volume K Unit Forecast, by Country 2019 & 2032
- Table 117: United States Application Container Market Revenue (Million) Forecast, by Application 2019 & 2032
- Table 118: United States Application Container Market Volume (K Unit) Forecast, by Application 2019 & 2032
- Table 119: Canada Application Container Market Revenue (Million) Forecast, by Application 2019 & 2032
- Table 120: Canada Application Container Market Volume (K Unit) Forecast, by Application 2019 & 2032
- Table 121: Global Application Container Market Revenue Million Forecast, by Production Analysis 2019 & 2032
- Table 122: Global Application Container Market Volume K Unit Forecast, by Production Analysis 2019 & 2032
- Table 123: Global Application Container Market Revenue Million Forecast, by Consumption Analysis 2019 & 2032
- Table 124: Global Application Container Market Volume K Unit Forecast, by Consumption Analysis 2019 & 2032
- Table 125: Global Application Container Market Revenue Million Forecast, by Import Market Analysis 2019 & 2032
- Table 126: Global Application Container Market Volume K Unit Forecast, by Import Market Analysis 2019 & 2032
- Table 127: Global Application Container Market Revenue Million Forecast, by Export Market Analysis 2019 & 2032
- Table 128: Global Application Container Market Volume K Unit Forecast, by Export Market Analysis 2019 & 2032
- Table 129: Global Application Container Market Revenue Million Forecast, by Price Trend Analysis 2019 & 2032
- Table 130: Global Application Container Market Volume K Unit Forecast, by Price Trend Analysis 2019 & 2032
- Table 131: Global Application Container Market Revenue Million Forecast, by Country 2019 & 2032
- Table 132: Global Application Container Market Volume K Unit Forecast, by Country 2019 & 2032
- Table 133: United Kingdom Application Container Market Revenue (Million) Forecast, by Application 2019 & 2032
- Table 134: United Kingdom Application Container Market Volume (K Unit) Forecast, by Application 2019 & 2032
- Table 135: Germany Application Container Market Revenue (Million) Forecast, by Application 2019 & 2032
- Table 136: Germany Application Container Market Volume (K Unit) Forecast, by Application 2019 & 2032
- Table 137: France Application Container Market Revenue (Million) Forecast, by Application 2019 & 2032
- Table 138: France Application Container Market Volume (K Unit) Forecast, by Application 2019 & 2032
- Table 139: Spain Application Container Market Revenue (Million) Forecast, by Application 2019 & 2032
- Table 140: Spain Application Container Market Volume (K Unit) Forecast, by Application 2019 & 2032
- Table 141: Global Application Container Market Revenue Million Forecast, by Production Analysis 2019 & 2032
- Table 142: Global Application Container Market Volume K Unit Forecast, by Production Analysis 2019 & 2032
- Table 143: Global Application Container Market Revenue Million Forecast, by Consumption Analysis 2019 & 2032
- Table 144: Global Application Container Market Volume K Unit Forecast, by Consumption Analysis 2019 & 2032
- Table 145: Global Application Container Market Revenue Million Forecast, by Import Market Analysis 2019 & 2032
- Table 146: Global Application Container Market Volume K Unit Forecast, by Import Market Analysis 2019 & 2032
- Table 147: Global Application Container Market Revenue Million Forecast, by Export Market Analysis 2019 & 2032
- Table 148: Global Application Container Market Volume K Unit Forecast, by Export Market Analysis 2019 & 2032
- Table 149: Global Application Container Market Revenue Million Forecast, by Price Trend Analysis 2019 & 2032
- Table 150: Global Application Container Market Volume K Unit Forecast, by Price Trend Analysis 2019 & 2032
- Table 151: Global Application Container Market Revenue Million Forecast, by Country 2019 & 2032
- Table 152: Global Application Container Market Volume K Unit Forecast, by Country 2019 & 2032
- Table 153: China Application Container Market Revenue (Million) Forecast, by Application 2019 & 2032
- Table 154: China Application Container Market Volume (K Unit) Forecast, by Application 2019 & 2032
- Table 155: India Application Container Market Revenue (Million) Forecast, by Application 2019 & 2032
- Table 156: India Application Container Market Volume (K Unit) Forecast, by Application 2019 & 2032
- Table 157: Japan Application Container Market Revenue (Million) Forecast, by Application 2019 & 2032
- Table 158: Japan Application Container Market Volume (K Unit) Forecast, by Application 2019 & 2032
- Table 159: Global Application Container Market Revenue Million Forecast, by Production Analysis 2019 & 2032
- Table 160: Global Application Container Market Volume K Unit Forecast, by Production Analysis 2019 & 2032
- Table 161: Global Application Container Market Revenue Million Forecast, by Consumption Analysis 2019 & 2032
- Table 162: Global Application Container Market Volume K Unit Forecast, by Consumption Analysis 2019 & 2032
- Table 163: Global Application Container Market Revenue Million Forecast, by Import Market Analysis 2019 & 2032
- Table 164: Global Application Container Market Volume K Unit Forecast, by Import Market Analysis 2019 & 2032
- Table 165: Global Application Container Market Revenue Million Forecast, by Export Market Analysis 2019 & 2032
- Table 166: Global Application Container Market Volume K Unit Forecast, by Export Market Analysis 2019 & 2032
- Table 167: Global Application Container Market Revenue Million Forecast, by Price Trend Analysis 2019 & 2032
- Table 168: Global Application Container Market Volume K Unit Forecast, by Price Trend Analysis 2019 & 2032
- Table 169: Global Application Container Market Revenue Million Forecast, by Country 2019 & 2032
- Table 170: Global Application Container Market Volume K Unit Forecast, by Country 2019 & 2032
- Table 171: Global Application Container Market Revenue Million Forecast, by Production Analysis 2019 & 2032
- Table 172: Global Application Container Market Volume K Unit Forecast, by Production Analysis 2019 & 2032
- Table 173: Global Application Container Market Revenue Million Forecast, by Consumption Analysis 2019 & 2032
- Table 174: Global Application Container Market Volume K Unit Forecast, by Consumption Analysis 2019 & 2032
- Table 175: Global Application Container Market Revenue Million Forecast, by Import Market Analysis 2019 & 2032
- Table 176: Global Application Container Market Volume K Unit Forecast, by Import Market Analysis 2019 & 2032
- Table 177: Global Application Container Market Revenue Million Forecast, by Export Market Analysis 2019 & 2032
- Table 178: Global Application Container Market Volume K Unit Forecast, by Export Market Analysis 2019 & 2032
- Table 179: Global Application Container Market Revenue Million Forecast, by Price Trend Analysis 2019 & 2032
- Table 180: Global Application Container Market Volume K Unit Forecast, by Price Trend Analysis 2019 & 2032
- Table 181: Global Application Container Market Revenue Million Forecast, by Country 2019 & 2032
- Table 182: Global Application Container Market Volume K Unit Forecast, by Country 2019 & 2032
- Table 183: Brazil Application Container Market Revenue (Million) Forecast, by Application 2019 & 2032
- Table 184: Brazil Application Container Market Volume (K Unit) Forecast, by Application 2019 & 2032
- Table 185: Argentina Application Container Market Revenue (Million) Forecast, by Application 2019 & 2032
- Table 186: Argentina Application Container Market Volume (K Unit) Forecast, by Application 2019 & 2032
- Table 187: Mexico Application Container Market Revenue (Million) Forecast, by Application 2019 & 2032
- Table 188: Mexico Application Container Market Volume (K Unit) Forecast, by Application 2019 & 2032
- Table 189: Global Application Container Market Revenue Million Forecast, by Production Analysis 2019 & 2032
- Table 190: Global Application Container Market Volume K Unit Forecast, by Production Analysis 2019 & 2032
- Table 191: Global Application Container Market Revenue Million Forecast, by Consumption Analysis 2019 & 2032
- Table 192: Global Application Container Market Volume K Unit Forecast, by Consumption Analysis 2019 & 2032
- Table 193: Global Application Container Market Revenue Million Forecast, by Import Market Analysis 2019 & 2032
- Table 194: Global Application Container Market Volume K Unit Forecast, by Import Market Analysis 2019 & 2032
- Table 195: Global Application Container Market Revenue Million Forecast, by Export Market Analysis 2019 & 2032
- Table 196: Global Application Container Market Volume K Unit Forecast, by Export Market Analysis 2019 & 2032
- Table 197: Global Application Container Market Revenue Million Forecast, by Price Trend Analysis 2019 & 2032
- Table 198: Global Application Container Market Volume K Unit Forecast, by Price Trend Analysis 2019 & 2032
- Table 199: Global Application Container Market Revenue Million Forecast, by Country 2019 & 2032
- Table 200: Global Application Container Market Volume K Unit Forecast, by Country 2019 & 2032
- Table 201: United Arab Emirates Application Container Market Revenue (Million) Forecast, by Application 2019 & 2032
- Table 202: United Arab Emirates Application Container Market Volume (K Unit) Forecast, by Application 2019 & 2032
- Table 203: Saudi Arabia Application Container Market Revenue (Million) Forecast, by Application 2019 & 2032
- Table 204: Saudi Arabia Application Container Market Volume (K Unit) Forecast, by Application 2019 & 2032
- Table 205: South Africa Application Container Market Revenue (Million) Forecast, by Application 2019 & 2032
- Table 206: South Africa Application Container Market Volume (K Unit) Forecast, by Application 2019 & 2032
Frequently Asked Questions
1. What is the projected Compound Annual Growth Rate (CAGR) of the Application Container Market?
The projected CAGR is approximately 28.89%.
2. Which companies are prominent players in the Application Container Market?
Key companies in the market include Amazon Web Services Inc (Amazon com Inc ), Docker Inc (Mirantis Inc ), Heroku Services (Salesforce Inc ), Google LLC (Alphabet Inc ), Microsoft Corporation, Joyent Inc (Samsung Corporation), VMware Inc (Broadcom Inc ), Red Hat Inc (IBM Corporation), Engine Yard Inc (Crossover Corporate Group), Oracle Corporation.
3. What are the main segments of the Application Container Market?
The market segments include Production Analysis, Consumption Analysis, Import Market Analysis, Export Market Analysis, Price Trend Analysis.
4. Can you provide details about the market size?
The market size is estimated to be USD 5.45 Million as of 2022.
5. What are some drivers contributing to market growth?
Efficient and Portable Characteristics of Application Containers to Drive the Market Growth; Rising Shift Towards Cloud-native Application Development.
6. What are the notable trends driving market growth?
Efficient and Portable Characteristics of Application Containers to Drive the Market Growth.
7. Are there any restraints impacting market growth?
Security Risks Associated With the Technology; Proliferation of Container Sprawl.
8. Can you provide examples of recent developments in the market?
January 2023: Landis+Gyr, a global company in energy management systems, and MicroEJ, the supplier of software containers for IoT and embedded devices, announced their partnership to improve the app development environment for the following generation of smart meters. This partnership would set the digital groundwork for more effective and environmentally friendly energy management.
9. What pricing options are available for accessing the report?
Pricing options include single-user, multi-user, and enterprise licenses priced at USD 4750, USD 5250, and USD 8750 respectively.
10. Is the market size provided in terms of value or volume?
The market size is provided in terms of value, measured in Million and volume, measured in K Unit.
11. Are there any specific market keywords associated with the report?
Yes, the market keyword associated with the report is "Application Container Market," which aids in identifying and referencing the specific market segment covered.
12. How do I determine which pricing option suits my needs best?
The pricing options vary based on user requirements and access needs. Individual users may opt for single-user licenses, while businesses requiring broader access may choose multi-user or enterprise licenses for cost-effective access to the report.
13. Are there any additional resources or data provided in the Application Container Market report?
While the report offers comprehensive insights, it's advisable to review the specific contents or supplementary materials provided to ascertain if additional resources or data are available.
14. How can I stay updated on further developments or reports in the Application Container Market?
To stay informed about further developments, trends, and reports in the Application Container Market, consider subscribing to industry newsletters, following relevant companies and organizations, or regularly checking reputable industry news sources and publications.
Methodology
Step 1 - Identification of Relevant Samples Size from Population Database


Step 2 - Approaches for Defining Global Market Size (Value, Volume* & Price*)

Note*: In applicable scenarios
Step 3 - Data Sources
Primary Research
- Web Analytics
- Survey Reports
- Research Institute
- Latest Research Reports
- Opinion Leaders
Secondary Research
- Annual Reports
- White Paper
- Latest Press Release
- Industry Association
- Paid Database
- Investor Presentations

Step 4 - Data Triangulation
Involves using different sources of information in order to increase the validity of a study
These sources are likely to be stakeholders in a program - participants, other researchers, program staff, other community members, and so on.
Then we put all data in single framework & apply various statistical tools to find out the dynamic on the market.
During the analysis stage, feedback from the stakeholder groups would be compared to determine areas of agreement as well as areas of divergence


