
Key Insights
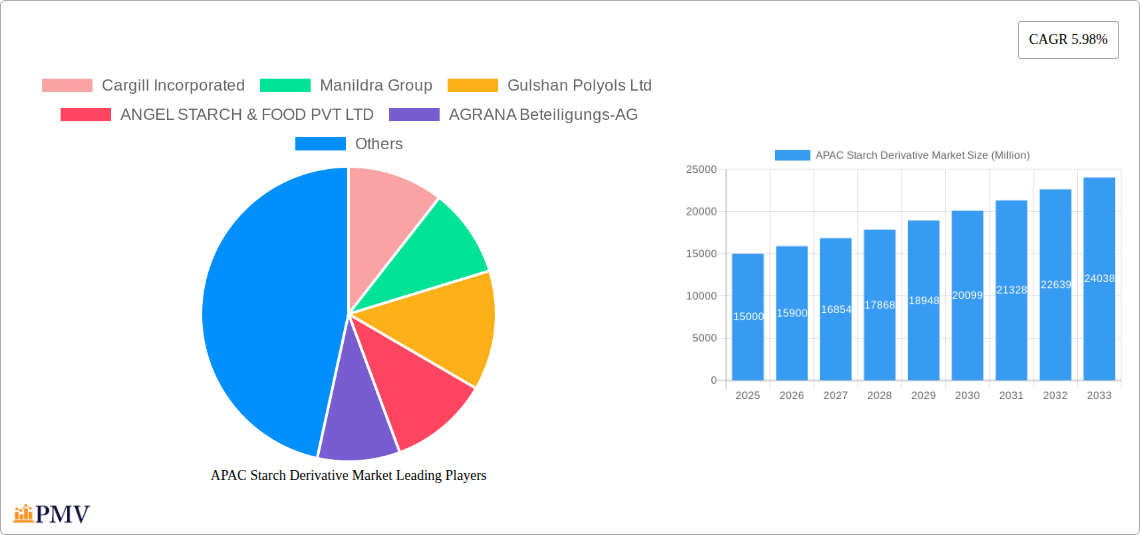
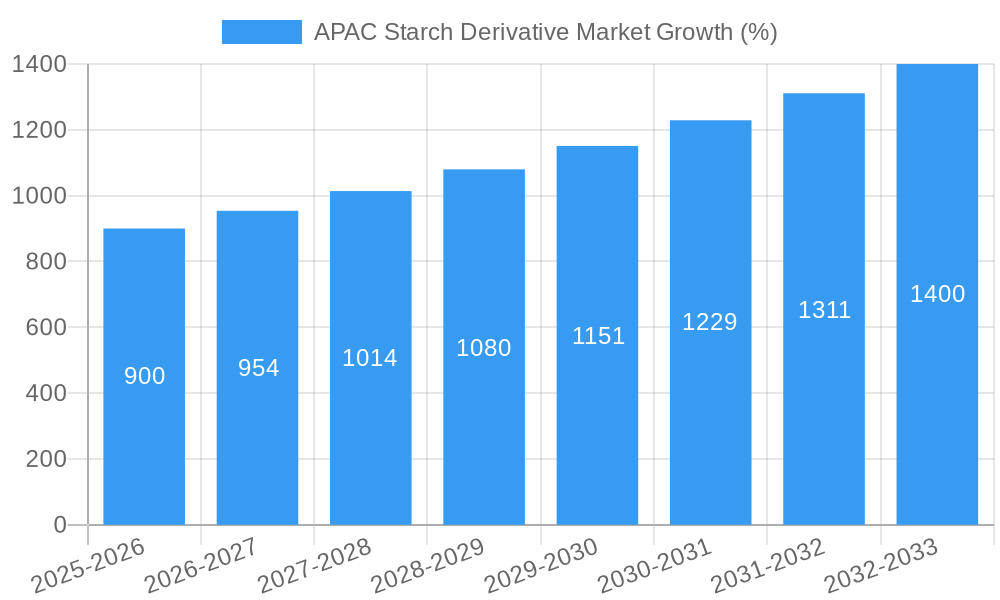
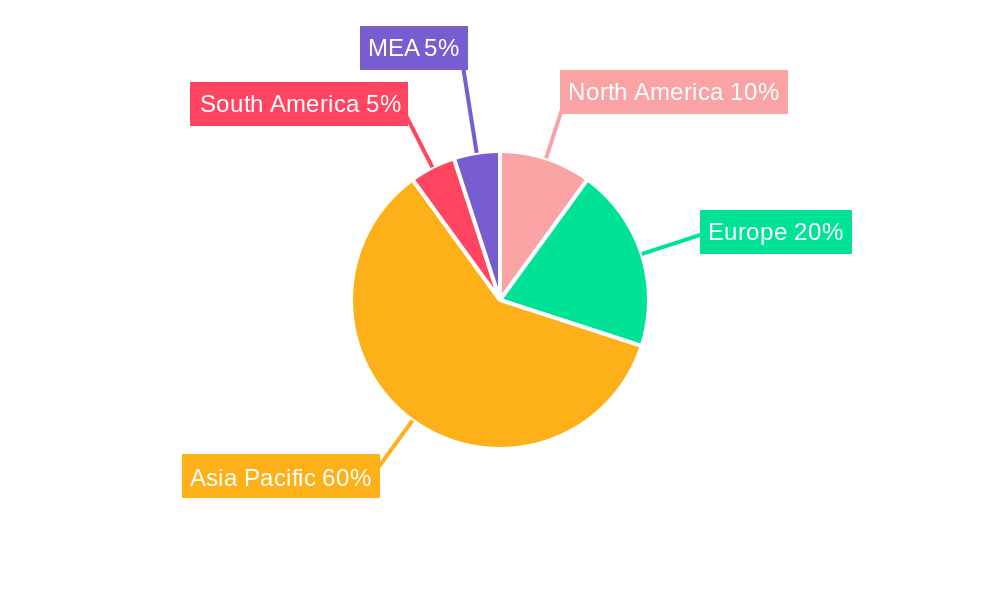
The Asia-Pacific (APAC) starch derivative market is experiencing robust growth, driven by the region's burgeoning food and beverage industry, expanding pharmaceutical sector, and increasing demand for bioethanol. The market's Compound Annual Growth Rate (CAGR) of 5.98% from 2019-2024 suggests a significant upward trajectory, projected to continue through 2033. Key application segments like food & beverage (including sweeteners, thickeners, and stabilizers in processed foods) and feed (animal nutrition) are major contributors to this growth. The rising disposable incomes and changing dietary habits within APAC are further fueling the demand for processed foods, which rely heavily on starch derivatives. Furthermore, the pharmaceutical industry's utilization of starch derivatives as excipients in drug formulations is also a considerable driver. While specific market size figures for APAC are not provided, considering the global market size and the region's significant economic growth and population, a reasonable estimation places APAC's 2025 market value at a significant portion – perhaps 30-40% – of the global market, given its large and growing consumer base. This segment is witnessing a notable shift towards sustainably sourced starch, reflecting growing environmental consciousness. The increasing adoption of advanced starch modification technologies to enhance product functionality and create value-added derivatives also promises further growth.
Within the APAC region, China, India, and Southeast Asia are expected to be key contributors to the overall market growth. China's substantial food processing industry and India's expanding pharmaceutical sector will likely drive significant demand. Southeast Asia's burgeoning population and rising middle class also present substantial opportunities. However, price fluctuations in raw materials (corn, wheat, cassava, etc.) and potential regulatory changes related to food safety and environmental sustainability could pose challenges. Competition among established players like Cargill, Ingredion, and Tate & Lyle alongside regional producers will continue to shape the market dynamics. The focus on innovation, particularly in developing novel starch derivatives with improved functionality and sustainability, will be crucial for companies seeking to gain a competitive edge in this expanding market.
APAC Starch Derivative Market: A Comprehensive Report (2019-2033)
This detailed report provides a comprehensive analysis of the Asia-Pacific (APAC) starch derivative market, offering invaluable insights for industry stakeholders, investors, and strategic decision-makers. The study covers the period 2019-2033, with 2025 as the base year and a forecast period extending to 2033. The report segments the market by application, type, and source, offering a granular understanding of market dynamics and future growth potential. The market size is valued at xx Million in 2025 and is projected to reach xx Million by 2033, exhibiting a CAGR of xx%.
APAC Starch Derivative Market Structure & Competitive Dynamics
This section analyzes the competitive landscape of the APAC starch derivative market, examining market concentration, innovation, regulatory frameworks, and key industry trends. The market is characterized by a mix of large multinational corporations and regional players. Market share is concentrated among key players like Cargill Incorporated, Ingredion Incorporated, and Tate & Lyle PLC, but smaller, regional players also hold significant market share within their respective territories. The market exhibits moderate concentration with a Herfindahl-Hirschman Index (HHI) of approximately xx.
Innovation is driven by investments in R&D focused on developing novel starch derivatives with enhanced functionalities and improved sustainability. The regulatory landscape varies across APAC nations, influencing product approvals and market access. Product substitutes, such as synthetic polymers, present some competition, but starch derivatives retain their advantage due to biodegradability and cost-effectiveness in many applications. End-user trends are driving the demand for specific starch derivative types; for example, increasing health consciousness fuels demand for low-calorie sweeteners, while the rise of eco-friendly packaging increases demand for biodegradable starch-based films.
Mergers and acquisitions (M&A) are frequently observed, with significant deals valued at xx Million in the past five years. These activities primarily focus on expanding market reach, enhancing product portfolios, and acquiring specialized technologies.
- Key Players' Market Share: Cargill (xx%), Ingredion (xx%), Tate & Lyle (xx%), Others (xx%)
- Recent M&A Activity: Three major acquisitions have been recorded in the last 5 years, with a total deal value exceeding xx Million.
- Regulatory Landscape: Significant variations exist across countries within APAC, requiring companies to navigate differing regulations for food safety, labeling, and environmental standards.
APAC Starch Derivative Market Industry Trends & Insights
The APAC starch derivative market is witnessing robust growth fueled by several factors. Rising disposable incomes and changing consumer preferences are boosting demand in the food and beverage sector. The growth in the animal feed industry is also a major driver, particularly in rapidly developing economies within the region. The pharmaceutical industry's reliance on starch derivatives as excipients for drug formulations further contributes to market expansion. Technological advancements in starch modification techniques are enabling the creation of new products with specialized properties, broadening the application scope. These factors collectively contribute to an expanding market, projected to grow at a CAGR of xx% during the forecast period. Market penetration in certain niche applications, like bioplastics, remains low but holds significant future potential. The increased focus on sustainability is driving demand for bio-based and biodegradable alternatives, enhancing the market prospects of starch-based products. Competitive dynamics are characterized by product innovation, price competition, and strategic partnerships.
Dominant Markets & Segments in APAC Starch Derivative Market
The Food and Beverage segment holds the largest market share within the APAC starch derivative market due to the widespread use of starch derivatives as thickeners, stabilizers, and sweeteners. China and India are the leading countries, driven by their vast populations and burgeoning food processing industries. Growth in these countries is being driven by:
- Economic growth: Increasing disposable incomes are boosting demand for processed foods.
- Expanding middle class: The growing middle class prefers convenience foods and is driving the demand for processed food ingredients.
- Government support: Policies promoting food processing and agriculture are fostering market growth.
The Corn segment dominates as the primary source for starch derivatives due to its cost-effectiveness and widespread availability. Maltodextrin holds significant market share among the different types due to its versatility and diverse applications.
Within the application segments, Food and Beverage accounts for the highest share, followed by Feed. Within types, Maltodextrin enjoys the largest share, with a projected market value of xx Million in 2025.
APAC Starch Derivative Market Product Innovations
Recent innovations focus on creating starch derivatives with enhanced functionalities, such as improved solubility, viscosity, and thermal stability. There is increasing interest in developing starch-based bioplastics and biodegradable packaging films. The integration of nanotechnology to enhance the properties of starch derivatives is gaining traction. This aligns with the rising consumer demand for sustainable and eco-friendly products, opening up new avenues for market expansion.
Report Segmentation & Scope
The APAC starch derivative market is segmented by application (Food and Beverage, Feed, Paper Industry, Pharmaceutical Industry, Bioethanol, Cosmetics, Others), type (Maltodextrin, Cyclodextrin, Glucose Syrups, Hydrolysates, Modified Starch, Others), and source (Corn, Wheat, Cassava, Potato, Others). Each segment's growth is influenced by specific factors. For example, the pharmaceutical industry's segment growth is linked to the increasing demand for drug excipients, while the food and beverage segment's expansion is driven by changing consumer preferences. The market size for each segment is detailed in the full report, along with growth projections and competitive analyses.
Key Drivers of APAC Starch Derivative Market Growth
Several factors are driving the APAC starch derivative market growth. The rising demand for processed foods and beverages fuels the need for starch derivatives as functional ingredients. The growing animal feed industry requires starch derivatives as nutritional supplements. The burgeoning pharmaceutical industry relies on starch derivatives as excipients. Furthermore, government initiatives promoting sustainable and bio-based materials drive the development and adoption of starch-based solutions.
Challenges in the APAP Starch Derivative Market Sector
The APAC starch derivative market faces several challenges, including fluctuations in raw material prices and supply chain disruptions. Stringent regulatory frameworks and evolving consumer preferences demand continuous innovation and adaptation. Intense competition from synthetic alternatives and the need to address sustainability concerns are also significant hurdles.
Leading Players in the APAC Starch Derivative Market Market
- Cargill Incorporated
- Manildra Group
- Gulshan Polyols Ltd
- ANGEL STARCH & FOOD PVT LTD
- AGRANA Beteiligungs-AG
- Tate & Lyle PLC
- JAPAN CORN STARCH CO LTD
- Ingredion Incorporated
Key Developments in APAC Starch Derivative Market Sector
- 2022 Q4: Cargill Incorporated acquired a smaller regional starch producer, expanding its market share in Southeast Asia.
- 2023 Q1: Ingredion Incorporated and a local research institute formed a partnership to develop novel starch derivatives for the food industry.
- 2023 Q2: Tate & Lyle PLC invested xx Million in a new R&D facility focused on developing sustainable starch-based packaging solutions.
Strategic APAC Starch Derivative Market Outlook
The APAC starch derivative market is poised for sustained growth, driven by increasing demand across various sectors. Strategic opportunities lie in developing innovative, sustainable, and functional starch derivatives, catering to the evolving needs of consumers and industries. Focus on eco-friendly production processes and expansion into high-growth niche markets will be crucial for achieving long-term success.
APAC Starch Derivative Market Segmentation
-
1. Type
- 1.1. Maltodextrin
- 1.2. Cyclodextrin
- 1.3. Glucose Syrups
- 1.4. Hydrolysates
- 1.5. Modified Starch
- 1.6. Others
-
2. Source
- 2.1. Corn
- 2.2. Wheat
- 2.3. Cassava
- 2.4. Potato
- 2.5. Others
-
3. Application
- 3.1. Food and Beverage
- 3.2. Feed
- 3.3. Paper Industry
- 3.4. Pharmaceutical Industry
- 3.5. Bioethanol
- 3.6. Cosmetics
- 3.7. Others
-
4. Geography
- 4.1. China
- 4.2. Japan
- 4.3. India
- 4.4. Australia
- 4.5. Rest of Asia-Pacific
APAC Starch Derivative Market Segmentation By Geography
- 1. China
- 2. Japan
- 3. India
- 4. Australia
- 5. Rest of Asia Pacific
APAC Starch Derivative Market REPORT HIGHLIGHTS
| Aspects | Details |
|---|---|
| Study Period | 2019-2033 |
| Base Year | 2024 |
| Estimated Year | 2025 |
| Forecast Period | 2025-2033 |
| Historical Period | 2019-2024 |
| Growth Rate | CAGR of 5.98% from 2019-2033 |
| Segmentation |
|
Table of Contents
- 1. Introduction
- 1.1. Research Scope
- 1.2. Market Segmentation
- 1.3. Research Methodology
- 1.4. Definitions and Assumptions
- 2. Executive Summary
- 2.1. Introduction
- 3. Market Dynamics
- 3.1. Introduction
- 3.2. Market Drivers
- 3.2.1. Wide Applications and Functionality; Demand For Gluten-Free Products
- 3.3. Market Restrains
- 3.3.1. Easy Availability of Economically Feasible Alternatives
- 3.4. Market Trends
- 3.4.1. Textile Industry
- 4. Market Factor Analysis
- 4.1. Porters Five Forces
- 4.2. Supply/Value Chain
- 4.3. PESTEL analysis
- 4.4. Market Entropy
- 4.5. Patent/Trademark Analysis
- 5. Global APAC Starch Derivative Market Analysis, Insights and Forecast, 2019-2031
- 5.1. Market Analysis, Insights and Forecast - by Type
- 5.1.1. Maltodextrin
- 5.1.2. Cyclodextrin
- 5.1.3. Glucose Syrups
- 5.1.4. Hydrolysates
- 5.1.5. Modified Starch
- 5.1.6. Others
- 5.2. Market Analysis, Insights and Forecast - by Source
- 5.2.1. Corn
- 5.2.2. Wheat
- 5.2.3. Cassava
- 5.2.4. Potato
- 5.2.5. Others
- 5.3. Market Analysis, Insights and Forecast - by Application
- 5.3.1. Food and Beverage
- 5.3.2. Feed
- 5.3.3. Paper Industry
- 5.3.4. Pharmaceutical Industry
- 5.3.5. Bioethanol
- 5.3.6. Cosmetics
- 5.3.7. Others
- 5.4. Market Analysis, Insights and Forecast - by Geography
- 5.4.1. China
- 5.4.2. Japan
- 5.4.3. India
- 5.4.4. Australia
- 5.4.5. Rest of Asia-Pacific
- 5.5. Market Analysis, Insights and Forecast - by Region
- 5.5.1. China
- 5.5.2. Japan
- 5.5.3. India
- 5.5.4. Australia
- 5.5.5. Rest of Asia Pacific
- 5.1. Market Analysis, Insights and Forecast - by Type
- 6. China APAC Starch Derivative Market Analysis, Insights and Forecast, 2019-2031
- 6.1. Market Analysis, Insights and Forecast - by Type
- 6.1.1. Maltodextrin
- 6.1.2. Cyclodextrin
- 6.1.3. Glucose Syrups
- 6.1.4. Hydrolysates
- 6.1.5. Modified Starch
- 6.1.6. Others
- 6.2. Market Analysis, Insights and Forecast - by Source
- 6.2.1. Corn
- 6.2.2. Wheat
- 6.2.3. Cassava
- 6.2.4. Potato
- 6.2.5. Others
- 6.3. Market Analysis, Insights and Forecast - by Application
- 6.3.1. Food and Beverage
- 6.3.2. Feed
- 6.3.3. Paper Industry
- 6.3.4. Pharmaceutical Industry
- 6.3.5. Bioethanol
- 6.3.6. Cosmetics
- 6.3.7. Others
- 6.4. Market Analysis, Insights and Forecast - by Geography
- 6.4.1. China
- 6.4.2. Japan
- 6.4.3. India
- 6.4.4. Australia
- 6.4.5. Rest of Asia-Pacific
- 6.1. Market Analysis, Insights and Forecast - by Type
- 7. Japan APAC Starch Derivative Market Analysis, Insights and Forecast, 2019-2031
- 7.1. Market Analysis, Insights and Forecast - by Type
- 7.1.1. Maltodextrin
- 7.1.2. Cyclodextrin
- 7.1.3. Glucose Syrups
- 7.1.4. Hydrolysates
- 7.1.5. Modified Starch
- 7.1.6. Others
- 7.2. Market Analysis, Insights and Forecast - by Source
- 7.2.1. Corn
- 7.2.2. Wheat
- 7.2.3. Cassava
- 7.2.4. Potato
- 7.2.5. Others
- 7.3. Market Analysis, Insights and Forecast - by Application
- 7.3.1. Food and Beverage
- 7.3.2. Feed
- 7.3.3. Paper Industry
- 7.3.4. Pharmaceutical Industry
- 7.3.5. Bioethanol
- 7.3.6. Cosmetics
- 7.3.7. Others
- 7.4. Market Analysis, Insights and Forecast - by Geography
- 7.4.1. China
- 7.4.2. Japan
- 7.4.3. India
- 7.4.4. Australia
- 7.4.5. Rest of Asia-Pacific
- 7.1. Market Analysis, Insights and Forecast - by Type
- 8. India APAC Starch Derivative Market Analysis, Insights and Forecast, 2019-2031
- 8.1. Market Analysis, Insights and Forecast - by Type
- 8.1.1. Maltodextrin
- 8.1.2. Cyclodextrin
- 8.1.3. Glucose Syrups
- 8.1.4. Hydrolysates
- 8.1.5. Modified Starch
- 8.1.6. Others
- 8.2. Market Analysis, Insights and Forecast - by Source
- 8.2.1. Corn
- 8.2.2. Wheat
- 8.2.3. Cassava
- 8.2.4. Potato
- 8.2.5. Others
- 8.3. Market Analysis, Insights and Forecast - by Application
- 8.3.1. Food and Beverage
- 8.3.2. Feed
- 8.3.3. Paper Industry
- 8.3.4. Pharmaceutical Industry
- 8.3.5. Bioethanol
- 8.3.6. Cosmetics
- 8.3.7. Others
- 8.4. Market Analysis, Insights and Forecast - by Geography
- 8.4.1. China
- 8.4.2. Japan
- 8.4.3. India
- 8.4.4. Australia
- 8.4.5. Rest of Asia-Pacific
- 8.1. Market Analysis, Insights and Forecast - by Type
- 9. Australia APAC Starch Derivative Market Analysis, Insights and Forecast, 2019-2031
- 9.1. Market Analysis, Insights and Forecast - by Type
- 9.1.1. Maltodextrin
- 9.1.2. Cyclodextrin
- 9.1.3. Glucose Syrups
- 9.1.4. Hydrolysates
- 9.1.5. Modified Starch
- 9.1.6. Others
- 9.2. Market Analysis, Insights and Forecast - by Source
- 9.2.1. Corn
- 9.2.2. Wheat
- 9.2.3. Cassava
- 9.2.4. Potato
- 9.2.5. Others
- 9.3. Market Analysis, Insights and Forecast - by Application
- 9.3.1. Food and Beverage
- 9.3.2. Feed
- 9.3.3. Paper Industry
- 9.3.4. Pharmaceutical Industry
- 9.3.5. Bioethanol
- 9.3.6. Cosmetics
- 9.3.7. Others
- 9.4. Market Analysis, Insights and Forecast - by Geography
- 9.4.1. China
- 9.4.2. Japan
- 9.4.3. India
- 9.4.4. Australia
- 9.4.5. Rest of Asia-Pacific
- 9.1. Market Analysis, Insights and Forecast - by Type
- 10. Rest of Asia Pacific APAC Starch Derivative Market Analysis, Insights and Forecast, 2019-2031
- 10.1. Market Analysis, Insights and Forecast - by Type
- 10.1.1. Maltodextrin
- 10.1.2. Cyclodextrin
- 10.1.3. Glucose Syrups
- 10.1.4. Hydrolysates
- 10.1.5. Modified Starch
- 10.1.6. Others
- 10.2. Market Analysis, Insights and Forecast - by Source
- 10.2.1. Corn
- 10.2.2. Wheat
- 10.2.3. Cassava
- 10.2.4. Potato
- 10.2.5. Others
- 10.3. Market Analysis, Insights and Forecast - by Application
- 10.3.1. Food and Beverage
- 10.3.2. Feed
- 10.3.3. Paper Industry
- 10.3.4. Pharmaceutical Industry
- 10.3.5. Bioethanol
- 10.3.6. Cosmetics
- 10.3.7. Others
- 10.4. Market Analysis, Insights and Forecast - by Geography
- 10.4.1. China
- 10.4.2. Japan
- 10.4.3. India
- 10.4.4. Australia
- 10.4.5. Rest of Asia-Pacific
- 10.1. Market Analysis, Insights and Forecast - by Type
- 11. North America APAC Starch Derivative Market Analysis, Insights and Forecast, 2019-2031
- 11.1. Market Analysis, Insights and Forecast - By Country/Sub-region
- 11.1.1 United States
- 11.1.2 Canada
- 11.1.3 Mexico
- 12. Europe APAC Starch Derivative Market Analysis, Insights and Forecast, 2019-2031
- 12.1. Market Analysis, Insights and Forecast - By Country/Sub-region
- 12.1.1 Germany
- 12.1.2 United Kingdom
- 12.1.3 France
- 12.1.4 Spain
- 12.1.5 Italy
- 12.1.6 Spain
- 12.1.7 Belgium
- 12.1.8 Netherland
- 12.1.9 Nordics
- 12.1.10 Rest of Europe
- 13. Asia Pacific APAC Starch Derivative Market Analysis, Insights and Forecast, 2019-2031
- 13.1. Market Analysis, Insights and Forecast - By Country/Sub-region
- 13.1.1 China
- 13.1.2 Japan
- 13.1.3 India
- 13.1.4 South Korea
- 13.1.5 Southeast Asia
- 13.1.6 Australia
- 13.1.7 Indonesia
- 13.1.8 Phillipes
- 13.1.9 Singapore
- 13.1.10 Thailandc
- 13.1.11 Rest of Asia Pacific
- 14. South America APAC Starch Derivative Market Analysis, Insights and Forecast, 2019-2031
- 14.1. Market Analysis, Insights and Forecast - By Country/Sub-region
- 14.1.1 Brazil
- 14.1.2 Argentina
- 14.1.3 Peru
- 14.1.4 Chile
- 14.1.5 Colombia
- 14.1.6 Ecuador
- 14.1.7 Venezuela
- 14.1.8 Rest of South America
- 15. North America APAC Starch Derivative Market Analysis, Insights and Forecast, 2019-2031
- 15.1. Market Analysis, Insights and Forecast - By Country/Sub-region
- 15.1.1 United States
- 15.1.2 Canada
- 15.1.3 Mexico
- 16. MEA APAC Starch Derivative Market Analysis, Insights and Forecast, 2019-2031
- 16.1. Market Analysis, Insights and Forecast - By Country/Sub-region
- 16.1.1 United Arab Emirates
- 16.1.2 Saudi Arabia
- 16.1.3 South Africa
- 16.1.4 Rest of Middle East and Africa
- 17. Competitive Analysis
- 17.1. Global Market Share Analysis 2024
- 17.2. Company Profiles
- 17.2.1 Cargill Incorporated
- 17.2.1.1. Overview
- 17.2.1.2. Products
- 17.2.1.3. SWOT Analysis
- 17.2.1.4. Recent Developments
- 17.2.1.5. Financials (Based on Availability)
- 17.2.2 Manildra Group
- 17.2.2.1. Overview
- 17.2.2.2. Products
- 17.2.2.3. SWOT Analysis
- 17.2.2.4. Recent Developments
- 17.2.2.5. Financials (Based on Availability)
- 17.2.3 Gulshan Polyols Ltd
- 17.2.3.1. Overview
- 17.2.3.2. Products
- 17.2.3.3. SWOT Analysis
- 17.2.3.4. Recent Developments
- 17.2.3.5. Financials (Based on Availability)
- 17.2.4 ANGEL STARCH & FOOD PVT LTD
- 17.2.4.1. Overview
- 17.2.4.2. Products
- 17.2.4.3. SWOT Analysis
- 17.2.4.4. Recent Developments
- 17.2.4.5. Financials (Based on Availability)
- 17.2.5 AGRANA Beteiligungs-AG
- 17.2.5.1. Overview
- 17.2.5.2. Products
- 17.2.5.3. SWOT Analysis
- 17.2.5.4. Recent Developments
- 17.2.5.5. Financials (Based on Availability)
- 17.2.6 Tate & Lyle PLC
- 17.2.6.1. Overview
- 17.2.6.2. Products
- 17.2.6.3. SWOT Analysis
- 17.2.6.4. Recent Developments
- 17.2.6.5. Financials (Based on Availability)
- 17.2.7 JAPAN CORN STARCH CO LTD
- 17.2.7.1. Overview
- 17.2.7.2. Products
- 17.2.7.3. SWOT Analysis
- 17.2.7.4. Recent Developments
- 17.2.7.5. Financials (Based on Availability)
- 17.2.8 Ingredion Incorporated
- 17.2.8.1. Overview
- 17.2.8.2. Products
- 17.2.8.3. SWOT Analysis
- 17.2.8.4. Recent Developments
- 17.2.8.5. Financials (Based on Availability)
- 17.2.1 Cargill Incorporated
List of Figures
- Figure 1: Global APAC Starch Derivative Market Revenue Breakdown (Million, %) by Region 2024 & 2032
- Figure 2: North America APAC Starch Derivative Market Revenue (Million), by Country 2024 & 2032
- Figure 3: North America APAC Starch Derivative Market Revenue Share (%), by Country 2024 & 2032
- Figure 4: Europe APAC Starch Derivative Market Revenue (Million), by Country 2024 & 2032
- Figure 5: Europe APAC Starch Derivative Market Revenue Share (%), by Country 2024 & 2032
- Figure 6: Asia Pacific APAC Starch Derivative Market Revenue (Million), by Country 2024 & 2032
- Figure 7: Asia Pacific APAC Starch Derivative Market Revenue Share (%), by Country 2024 & 2032
- Figure 8: South America APAC Starch Derivative Market Revenue (Million), by Country 2024 & 2032
- Figure 9: South America APAC Starch Derivative Market Revenue Share (%), by Country 2024 & 2032
- Figure 10: North America APAC Starch Derivative Market Revenue (Million), by Country 2024 & 2032
- Figure 11: North America APAC Starch Derivative Market Revenue Share (%), by Country 2024 & 2032
- Figure 12: MEA APAC Starch Derivative Market Revenue (Million), by Country 2024 & 2032
- Figure 13: MEA APAC Starch Derivative Market Revenue Share (%), by Country 2024 & 2032
- Figure 14: China APAC Starch Derivative Market Revenue (Million), by Type 2024 & 2032
- Figure 15: China APAC Starch Derivative Market Revenue Share (%), by Type 2024 & 2032
- Figure 16: China APAC Starch Derivative Market Revenue (Million), by Source 2024 & 2032
- Figure 17: China APAC Starch Derivative Market Revenue Share (%), by Source 2024 & 2032
- Figure 18: China APAC Starch Derivative Market Revenue (Million), by Application 2024 & 2032
- Figure 19: China APAC Starch Derivative Market Revenue Share (%), by Application 2024 & 2032
- Figure 20: China APAC Starch Derivative Market Revenue (Million), by Geography 2024 & 2032
- Figure 21: China APAC Starch Derivative Market Revenue Share (%), by Geography 2024 & 2032
- Figure 22: China APAC Starch Derivative Market Revenue (Million), by Country 2024 & 2032
- Figure 23: China APAC Starch Derivative Market Revenue Share (%), by Country 2024 & 2032
- Figure 24: Japan APAC Starch Derivative Market Revenue (Million), by Type 2024 & 2032
- Figure 25: Japan APAC Starch Derivative Market Revenue Share (%), by Type 2024 & 2032
- Figure 26: Japan APAC Starch Derivative Market Revenue (Million), by Source 2024 & 2032
- Figure 27: Japan APAC Starch Derivative Market Revenue Share (%), by Source 2024 & 2032
- Figure 28: Japan APAC Starch Derivative Market Revenue (Million), by Application 2024 & 2032
- Figure 29: Japan APAC Starch Derivative Market Revenue Share (%), by Application 2024 & 2032
- Figure 30: Japan APAC Starch Derivative Market Revenue (Million), by Geography 2024 & 2032
- Figure 31: Japan APAC Starch Derivative Market Revenue Share (%), by Geography 2024 & 2032
- Figure 32: Japan APAC Starch Derivative Market Revenue (Million), by Country 2024 & 2032
- Figure 33: Japan APAC Starch Derivative Market Revenue Share (%), by Country 2024 & 2032
- Figure 34: India APAC Starch Derivative Market Revenue (Million), by Type 2024 & 2032
- Figure 35: India APAC Starch Derivative Market Revenue Share (%), by Type 2024 & 2032
- Figure 36: India APAC Starch Derivative Market Revenue (Million), by Source 2024 & 2032
- Figure 37: India APAC Starch Derivative Market Revenue Share (%), by Source 2024 & 2032
- Figure 38: India APAC Starch Derivative Market Revenue (Million), by Application 2024 & 2032
- Figure 39: India APAC Starch Derivative Market Revenue Share (%), by Application 2024 & 2032
- Figure 40: India APAC Starch Derivative Market Revenue (Million), by Geography 2024 & 2032
- Figure 41: India APAC Starch Derivative Market Revenue Share (%), by Geography 2024 & 2032
- Figure 42: India APAC Starch Derivative Market Revenue (Million), by Country 2024 & 2032
- Figure 43: India APAC Starch Derivative Market Revenue Share (%), by Country 2024 & 2032
- Figure 44: Australia APAC Starch Derivative Market Revenue (Million), by Type 2024 & 2032
- Figure 45: Australia APAC Starch Derivative Market Revenue Share (%), by Type 2024 & 2032
- Figure 46: Australia APAC Starch Derivative Market Revenue (Million), by Source 2024 & 2032
- Figure 47: Australia APAC Starch Derivative Market Revenue Share (%), by Source 2024 & 2032
- Figure 48: Australia APAC Starch Derivative Market Revenue (Million), by Application 2024 & 2032
- Figure 49: Australia APAC Starch Derivative Market Revenue Share (%), by Application 2024 & 2032
- Figure 50: Australia APAC Starch Derivative Market Revenue (Million), by Geography 2024 & 2032
- Figure 51: Australia APAC Starch Derivative Market Revenue Share (%), by Geography 2024 & 2032
- Figure 52: Australia APAC Starch Derivative Market Revenue (Million), by Country 2024 & 2032
- Figure 53: Australia APAC Starch Derivative Market Revenue Share (%), by Country 2024 & 2032
- Figure 54: Rest of Asia Pacific APAC Starch Derivative Market Revenue (Million), by Type 2024 & 2032
- Figure 55: Rest of Asia Pacific APAC Starch Derivative Market Revenue Share (%), by Type 2024 & 2032
- Figure 56: Rest of Asia Pacific APAC Starch Derivative Market Revenue (Million), by Source 2024 & 2032
- Figure 57: Rest of Asia Pacific APAC Starch Derivative Market Revenue Share (%), by Source 2024 & 2032
- Figure 58: Rest of Asia Pacific APAC Starch Derivative Market Revenue (Million), by Application 2024 & 2032
- Figure 59: Rest of Asia Pacific APAC Starch Derivative Market Revenue Share (%), by Application 2024 & 2032
- Figure 60: Rest of Asia Pacific APAC Starch Derivative Market Revenue (Million), by Geography 2024 & 2032
- Figure 61: Rest of Asia Pacific APAC Starch Derivative Market Revenue Share (%), by Geography 2024 & 2032
- Figure 62: Rest of Asia Pacific APAC Starch Derivative Market Revenue (Million), by Country 2024 & 2032
- Figure 63: Rest of Asia Pacific APAC Starch Derivative Market Revenue Share (%), by Country 2024 & 2032
List of Tables
- Table 1: Global APAC Starch Derivative Market Revenue Million Forecast, by Region 2019 & 2032
- Table 2: Global APAC Starch Derivative Market Revenue Million Forecast, by Type 2019 & 2032
- Table 3: Global APAC Starch Derivative Market Revenue Million Forecast, by Source 2019 & 2032
- Table 4: Global APAC Starch Derivative Market Revenue Million Forecast, by Application 2019 & 2032
- Table 5: Global APAC Starch Derivative Market Revenue Million Forecast, by Geography 2019 & 2032
- Table 6: Global APAC Starch Derivative Market Revenue Million Forecast, by Region 2019 & 2032
- Table 7: Global APAC Starch Derivative Market Revenue Million Forecast, by Country 2019 & 2032
- Table 8: United States APAC Starch Derivative Market Revenue (Million) Forecast, by Application 2019 & 2032
- Table 9: Canada APAC Starch Derivative Market Revenue (Million) Forecast, by Application 2019 & 2032
- Table 10: Mexico APAC Starch Derivative Market Revenue (Million) Forecast, by Application 2019 & 2032
- Table 11: Global APAC Starch Derivative Market Revenue Million Forecast, by Country 2019 & 2032
- Table 12: Germany APAC Starch Derivative Market Revenue (Million) Forecast, by Application 2019 & 2032
- Table 13: United Kingdom APAC Starch Derivative Market Revenue (Million) Forecast, by Application 2019 & 2032
- Table 14: France APAC Starch Derivative Market Revenue (Million) Forecast, by Application 2019 & 2032
- Table 15: Spain APAC Starch Derivative Market Revenue (Million) Forecast, by Application 2019 & 2032
- Table 16: Italy APAC Starch Derivative Market Revenue (Million) Forecast, by Application 2019 & 2032
- Table 17: Spain APAC Starch Derivative Market Revenue (Million) Forecast, by Application 2019 & 2032
- Table 18: Belgium APAC Starch Derivative Market Revenue (Million) Forecast, by Application 2019 & 2032
- Table 19: Netherland APAC Starch Derivative Market Revenue (Million) Forecast, by Application 2019 & 2032
- Table 20: Nordics APAC Starch Derivative Market Revenue (Million) Forecast, by Application 2019 & 2032
- Table 21: Rest of Europe APAC Starch Derivative Market Revenue (Million) Forecast, by Application 2019 & 2032
- Table 22: Global APAC Starch Derivative Market Revenue Million Forecast, by Country 2019 & 2032
- Table 23: China APAC Starch Derivative Market Revenue (Million) Forecast, by Application 2019 & 2032
- Table 24: Japan APAC Starch Derivative Market Revenue (Million) Forecast, by Application 2019 & 2032
- Table 25: India APAC Starch Derivative Market Revenue (Million) Forecast, by Application 2019 & 2032
- Table 26: South Korea APAC Starch Derivative Market Revenue (Million) Forecast, by Application 2019 & 2032
- Table 27: Southeast Asia APAC Starch Derivative Market Revenue (Million) Forecast, by Application 2019 & 2032
- Table 28: Australia APAC Starch Derivative Market Revenue (Million) Forecast, by Application 2019 & 2032
- Table 29: Indonesia APAC Starch Derivative Market Revenue (Million) Forecast, by Application 2019 & 2032
- Table 30: Phillipes APAC Starch Derivative Market Revenue (Million) Forecast, by Application 2019 & 2032
- Table 31: Singapore APAC Starch Derivative Market Revenue (Million) Forecast, by Application 2019 & 2032
- Table 32: Thailandc APAC Starch Derivative Market Revenue (Million) Forecast, by Application 2019 & 2032
- Table 33: Rest of Asia Pacific APAC Starch Derivative Market Revenue (Million) Forecast, by Application 2019 & 2032
- Table 34: Global APAC Starch Derivative Market Revenue Million Forecast, by Country 2019 & 2032
- Table 35: Brazil APAC Starch Derivative Market Revenue (Million) Forecast, by Application 2019 & 2032
- Table 36: Argentina APAC Starch Derivative Market Revenue (Million) Forecast, by Application 2019 & 2032
- Table 37: Peru APAC Starch Derivative Market Revenue (Million) Forecast, by Application 2019 & 2032
- Table 38: Chile APAC Starch Derivative Market Revenue (Million) Forecast, by Application 2019 & 2032
- Table 39: Colombia APAC Starch Derivative Market Revenue (Million) Forecast, by Application 2019 & 2032
- Table 40: Ecuador APAC Starch Derivative Market Revenue (Million) Forecast, by Application 2019 & 2032
- Table 41: Venezuela APAC Starch Derivative Market Revenue (Million) Forecast, by Application 2019 & 2032
- Table 42: Rest of South America APAC Starch Derivative Market Revenue (Million) Forecast, by Application 2019 & 2032
- Table 43: Global APAC Starch Derivative Market Revenue Million Forecast, by Country 2019 & 2032
- Table 44: United States APAC Starch Derivative Market Revenue (Million) Forecast, by Application 2019 & 2032
- Table 45: Canada APAC Starch Derivative Market Revenue (Million) Forecast, by Application 2019 & 2032
- Table 46: Mexico APAC Starch Derivative Market Revenue (Million) Forecast, by Application 2019 & 2032
- Table 47: Global APAC Starch Derivative Market Revenue Million Forecast, by Country 2019 & 2032
- Table 48: United Arab Emirates APAC Starch Derivative Market Revenue (Million) Forecast, by Application 2019 & 2032
- Table 49: Saudi Arabia APAC Starch Derivative Market Revenue (Million) Forecast, by Application 2019 & 2032
- Table 50: South Africa APAC Starch Derivative Market Revenue (Million) Forecast, by Application 2019 & 2032
- Table 51: Rest of Middle East and Africa APAC Starch Derivative Market Revenue (Million) Forecast, by Application 2019 & 2032
- Table 52: Global APAC Starch Derivative Market Revenue Million Forecast, by Type 2019 & 2032
- Table 53: Global APAC Starch Derivative Market Revenue Million Forecast, by Source 2019 & 2032
- Table 54: Global APAC Starch Derivative Market Revenue Million Forecast, by Application 2019 & 2032
- Table 55: Global APAC Starch Derivative Market Revenue Million Forecast, by Geography 2019 & 2032
- Table 56: Global APAC Starch Derivative Market Revenue Million Forecast, by Country 2019 & 2032
- Table 57: Global APAC Starch Derivative Market Revenue Million Forecast, by Type 2019 & 2032
- Table 58: Global APAC Starch Derivative Market Revenue Million Forecast, by Source 2019 & 2032
- Table 59: Global APAC Starch Derivative Market Revenue Million Forecast, by Application 2019 & 2032
- Table 60: Global APAC Starch Derivative Market Revenue Million Forecast, by Geography 2019 & 2032
- Table 61: Global APAC Starch Derivative Market Revenue Million Forecast, by Country 2019 & 2032
- Table 62: Global APAC Starch Derivative Market Revenue Million Forecast, by Type 2019 & 2032
- Table 63: Global APAC Starch Derivative Market Revenue Million Forecast, by Source 2019 & 2032
- Table 64: Global APAC Starch Derivative Market Revenue Million Forecast, by Application 2019 & 2032
- Table 65: Global APAC Starch Derivative Market Revenue Million Forecast, by Geography 2019 & 2032
- Table 66: Global APAC Starch Derivative Market Revenue Million Forecast, by Country 2019 & 2032
- Table 67: Global APAC Starch Derivative Market Revenue Million Forecast, by Type 2019 & 2032
- Table 68: Global APAC Starch Derivative Market Revenue Million Forecast, by Source 2019 & 2032
- Table 69: Global APAC Starch Derivative Market Revenue Million Forecast, by Application 2019 & 2032
- Table 70: Global APAC Starch Derivative Market Revenue Million Forecast, by Geography 2019 & 2032
- Table 71: Global APAC Starch Derivative Market Revenue Million Forecast, by Country 2019 & 2032
- Table 72: Global APAC Starch Derivative Market Revenue Million Forecast, by Type 2019 & 2032
- Table 73: Global APAC Starch Derivative Market Revenue Million Forecast, by Source 2019 & 2032
- Table 74: Global APAC Starch Derivative Market Revenue Million Forecast, by Application 2019 & 2032
- Table 75: Global APAC Starch Derivative Market Revenue Million Forecast, by Geography 2019 & 2032
- Table 76: Global APAC Starch Derivative Market Revenue Million Forecast, by Country 2019 & 2032
Frequently Asked Questions
1. What is the projected Compound Annual Growth Rate (CAGR) of the APAC Starch Derivative Market?
The projected CAGR is approximately 5.98%.
2. Which companies are prominent players in the APAC Starch Derivative Market?
Key companies in the market include Cargill Incorporated, Manildra Group, Gulshan Polyols Ltd , ANGEL STARCH & FOOD PVT LTD, AGRANA Beteiligungs-AG, Tate & Lyle PLC, JAPAN CORN STARCH CO LTD, Ingredion Incorporated.
3. What are the main segments of the APAC Starch Derivative Market?
The market segments include Type, Source, Application, Geography.
4. Can you provide details about the market size?
The market size is estimated to be USD XX Million as of 2022.
5. What are some drivers contributing to market growth?
Wide Applications and Functionality; Demand For Gluten-Free Products.
6. What are the notable trends driving market growth?
Textile Industry: Growth Engine of Starch Utilisation.
7. Are there any restraints impacting market growth?
Easy Availability of Economically Feasible Alternatives.
8. Can you provide examples of recent developments in the market?
1. Acquisitions and mergers to expand market share and product portfolios 2. Partnerships for product development and distribution 3. Investments in R&D to enhance product offerings and meet evolving customer needs
9. What pricing options are available for accessing the report?
Pricing options include single-user, multi-user, and enterprise licenses priced at USD 4750, USD 5250, and USD 8750 respectively.
10. Is the market size provided in terms of value or volume?
The market size is provided in terms of value, measured in Million.
11. Are there any specific market keywords associated with the report?
Yes, the market keyword associated with the report is "APAC Starch Derivative Market," which aids in identifying and referencing the specific market segment covered.
12. How do I determine which pricing option suits my needs best?
The pricing options vary based on user requirements and access needs. Individual users may opt for single-user licenses, while businesses requiring broader access may choose multi-user or enterprise licenses for cost-effective access to the report.
13. Are there any additional resources or data provided in the APAC Starch Derivative Market report?
While the report offers comprehensive insights, it's advisable to review the specific contents or supplementary materials provided to ascertain if additional resources or data are available.
14. How can I stay updated on further developments or reports in the APAC Starch Derivative Market?
To stay informed about further developments, trends, and reports in the APAC Starch Derivative Market, consider subscribing to industry newsletters, following relevant companies and organizations, or regularly checking reputable industry news sources and publications.
Methodology
Step 1 - Identification of Relevant Samples Size from Population Database


Step 2 - Approaches for Defining Global Market Size (Value, Volume* & Price*)

Note*: In applicable scenarios
Step 3 - Data Sources
Primary Research
- Web Analytics
- Survey Reports
- Research Institute
- Latest Research Reports
- Opinion Leaders
Secondary Research
- Annual Reports
- White Paper
- Latest Press Release
- Industry Association
- Paid Database
- Investor Presentations

Step 4 - Data Triangulation
Involves using different sources of information in order to increase the validity of a study
These sources are likely to be stakeholders in a program - participants, other researchers, program staff, other community members, and so on.
Then we put all data in single framework & apply various statistical tools to find out the dynamic on the market.
During the analysis stage, feedback from the stakeholder groups would be compared to determine areas of agreement as well as areas of divergence


