
Key Insights
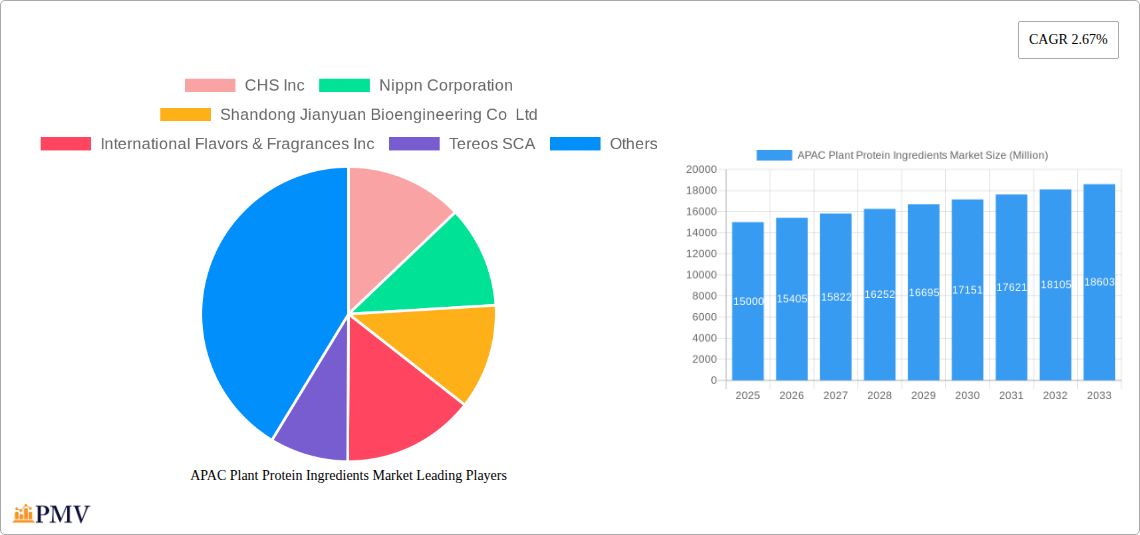
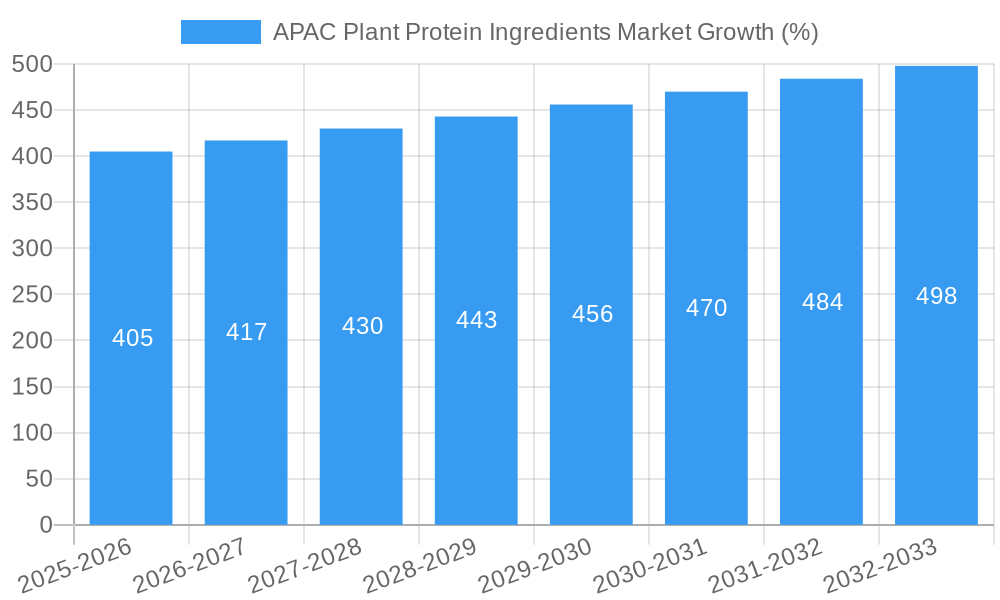
The Asia-Pacific (APAC) plant protein ingredients market is experiencing robust growth, driven by increasing consumer demand for plant-based foods and a rising awareness of health and environmental benefits. The region's burgeoning population, coupled with expanding middle classes in countries like India and China, fuels this demand. Key drivers include the rising prevalence of vegetarianism and veganism, increasing concerns regarding animal welfare, and growing awareness of the environmental impact of animal agriculture. The market is segmented by protein type (hemp, pea, potato, rice, soy, wheat, and others), end-user (animal feed, food and beverages, and sports/performance nutrition), and geography, with China, India, and other Southeast Asian nations representing significant market opportunities. While soy protein currently holds a substantial market share, the popularity of other plant-based proteins, such as pea and rice protein, is rapidly increasing due to their functional properties and consumer preferences for diverse protein sources. The market faces certain restraints, including fluctuations in raw material prices and the need for consistent quality control across different production sources. However, technological advancements in plant protein extraction and processing are mitigating these challenges. The projected CAGR of 2.67% reflects a steady, albeit moderate, growth trajectory, indicating a considerable long-term market potential for plant protein ingredients within the APAC region. Further growth is anticipated through strategic partnerships between ingredient suppliers and food and beverage companies, resulting in innovative product development and market expansion.
The competitive landscape is characterized by a mix of international and regional players. Major global companies like Archer Daniels Midland, Bunge Limited, and Kerry Group are leveraging their established distribution networks and technological capabilities to strengthen their positions in the APAC market. Simultaneously, several regional companies are emerging as key players, benefiting from localized knowledge and efficient production strategies. This competitive dynamic fosters innovation, ensuring a diverse range of plant protein ingredients available to meet the diverse needs of APAC consumers. Future growth will depend on factors such as government regulations concerning food safety and labeling, the ongoing development of sustainable agricultural practices, and the capacity of industry players to adapt to evolving consumer preferences and market trends. The continuous exploration of novel plant protein sources and advancements in processing technologies will also contribute to the expansion of this dynamic and promising market segment.
APAC Plant Protein Ingredients Market Report: 2019-2033
This comprehensive report provides a detailed analysis of the Asia-Pacific (APAC) plant protein ingredients market, offering invaluable insights for industry stakeholders. Covering the period from 2019 to 2033, with a base year of 2025, this report meticulously examines market size, segmentation, growth drivers, challenges, and key players. The study encompasses diverse protein types, end-user applications, and key APAC countries, enabling informed strategic decision-making. The estimated market value for 2025 is xx Million, with a projected Compound Annual Growth Rate (CAGR) of xx% during the forecast period (2025-2033).
APAC Plant Protein Ingredients Market Market Structure & Competitive Dynamics
The APAC plant protein ingredients market exhibits a moderately consolidated structure, with a few major players holding significant market share. The competitive landscape is characterized by intense innovation, driven by the rising demand for plant-based alternatives and the development of novel protein sources. Regulatory frameworks vary across APAC nations, influencing market access and product formulation. Key substitutes include traditional animal-based proteins and other functional ingredients. End-user trends are shifting towards healthier and more sustainable food choices, boosting demand for plant-based options across food and beverages, animal feed, and sports nutrition. Mergers and acquisitions (M&A) activity is substantial, as larger companies seek to expand their product portfolios and geographic reach. For instance, BENEO's acquisition of Meatless BV signifies a strategic move to enhance its texturizing solutions for meat alternatives.
- Market Concentration: Moderately Consolidated (Top 5 players hold approximately xx% market share in 2025).
- M&A Activity: Significant, with deal values totaling xx Million in the past three years. Examples include Bunge Limited's USD 45.7 Million investment in Australian Plant Proteins.
- Innovation Ecosystems: Active, with investments in R&D and the emergence of innovative startups developing novel plant protein sources and processing technologies.
- Regulatory Frameworks: Vary significantly across APAC countries, impacting market entry and product compliance.
APAC Plant Protein Ingredients Market Industry Trends & Insights
The APAC plant protein ingredients market is experiencing robust growth, fueled by several key factors. The rising health-conscious consumer base is driving demand for plant-based protein sources, perceived as healthier and more sustainable alternatives to animal-based proteins. Technological advancements in protein extraction and processing are enhancing the functionality and palatability of plant proteins. Growing awareness of the environmental impact of animal agriculture further propels the adoption of plant-based alternatives. These factors, combined with increasing disposable incomes in several APAC nations, contribute to the market’s remarkable growth trajectory. The market is expected to reach xx Million by 2033. A key trend is the increased focus on specialized plant proteins, catering to niche consumer needs and end-use applications. The increasing penetration of plant-based products in the food and beverage industry is a significant contributor. This is reflected in the growth of the plant-based meat and dairy alternatives market, which significantly impacts demand for plant proteins. The CAGR for the forecast period is projected to be xx%, driven primarily by strong growth in key markets like China and India.
Dominant Markets & Segments in APAC Plant Protein Ingredients Market
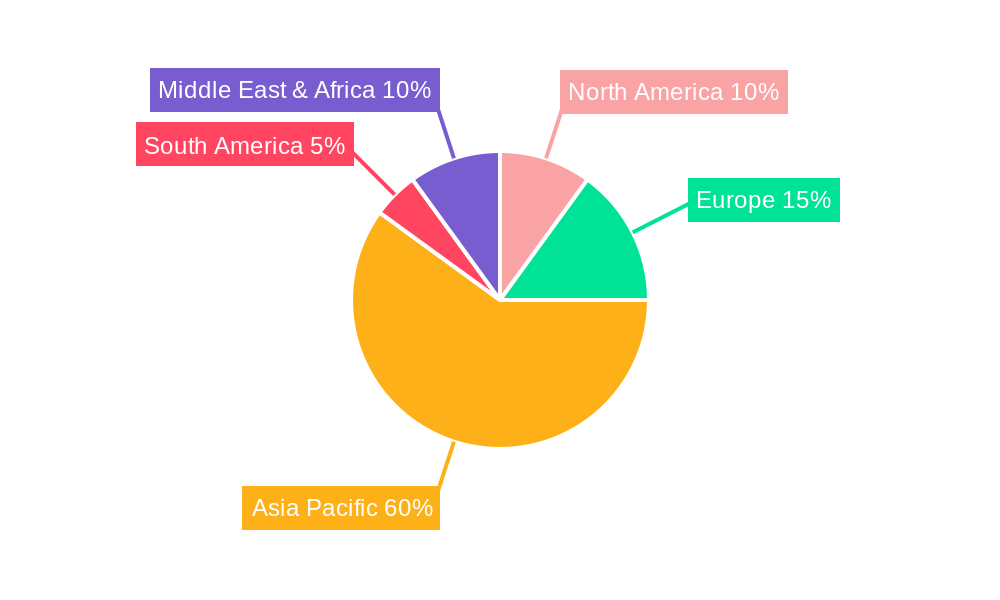
China holds the largest market share in the APAC plant protein ingredients market, driven by its substantial population, expanding middle class, and increasing health consciousness. India represents a rapidly growing market due to its large population and increasing urbanization. Soy protein currently dominates the protein type segment due to its established presence, affordability, and versatility. The food and beverage sector is the leading end-user segment, while the sports/performance nutrition segment showcases significant growth potential.
- Leading Region: Greater China (China, Hong Kong, Taiwan)
- Leading Country: China
- Dominant Protein Type: Soy Protein
- Leading End-User: Food and Beverages
Key Drivers in Dominant Markets:
- China: Expanding middle class, increasing disposable incomes, growing health awareness, supportive government policies promoting plant-based foods.
- India: Large and young population, rising urbanization, increasing awareness of health and nutrition, burgeoning food processing industry.
- Other Key Countries: Japan (sophisticated consumer base, focus on functional foods), South Korea (similar trends to Japan), Australia (strong agricultural sector).
APAC Plant Protein Ingredients Market Product Innovations
Recent years have witnessed significant innovations in plant protein ingredients, focusing on improving functionality, taste, texture, and nutritional value. Companies are developing new protein extraction and processing technologies to enhance the quality of existing plant proteins, as well as exploring novel protein sources such as pea, hemp, and potato. These innovations aim to address consumer demand for healthier, more sustainable, and more appealing plant-based foods and beverages. The market is witnessing the introduction of various formulations designed to improve taste and texture, and to better mimic the functionalities of animal proteins in meat alternatives and other products. Technological advancements are crucial to achieving greater market acceptance of plant-based protein sources.
Report Segmentation & Scope
This report segments the APAC plant protein ingredients market based on protein type (Hemp Protein, Pea Protein, Potato Protein, Rice Protein, Soy Protein, Wheat Protein, Other Plant Protein), end-user (Animal Feed, Food and Beverages, Sport/Performance Nutrition), and country (Australia, China, India, Indonesia, Japan, Malaysia, New Zealand, South Korea, Thailand, Vietnam, Rest of Asia-Pacific). Each segment's growth trajectory, market size, and competitive dynamics are analyzed. The forecast period is 2025-2033, offering projections on market expansion and evolution within each segment.
Key Drivers of APAC Plant Protein Ingredients Market Growth
Several key factors drive the growth of the APAC plant protein ingredients market. The rising consumer preference for healthier and more sustainable food choices is a primary driver. Growing awareness of the environmental impact of animal agriculture fuels demand for plant-based alternatives. Technological advancements in protein extraction and processing are improving the functionality and palatability of plant proteins, enhancing their attractiveness to consumers and food manufacturers. Government initiatives promoting plant-based foods in several APAC countries also play a significant role. Moreover, the expanding food and beverage industry, particularly the plant-based meat and dairy alternatives sector, is a key growth engine.
Challenges in the APAP Plant Protein Ingredients Market Sector
The APAC plant protein ingredients market faces some challenges. Fluctuations in raw material prices, particularly for soybeans, can impact production costs and profitability. Ensuring a consistent supply chain is crucial, particularly given the increasing demand. Competition from established players and new entrants can intensify price pressures. Regulatory hurdles and varying food safety standards across different APAC countries can pose barriers to market entry and expansion. Consumer perception and acceptance of certain plant proteins might also pose challenges.
Leading Players in the APAC Plant Protein Ingredients Market Market
- CHS Inc
- Nippn Corporation
- Shandong Jianyuan Bioengineering Co Ltd
- International Flavors & Fragrances Inc
- Tereos SCA
- Wilmar International Lt
- Archer Daniels Midland Company
- Bunge Limited
- Fuji Oil Group
- Nagata Group
- Kerry Group PLC
- Südzucker AG
Key Developments in APAC Plant Protein Ingredients Market Sector
- April 2021: ADM opened a new plant-based innovation lab in Singapore, enhancing its capabilities to meet the growing demand in the APAC region.
- April 2021: Bunge Limited invested USD 45.7 Million in Australian Plant Proteins (APP) to double plant protein isolate production.
- May 2022: BENEO (subsidiary of Südzucker) acquired Meatless BV, expanding its offerings of texturizing solutions for meat alternatives.
Strategic APAC Plant Protein Ingredients Market Market Outlook
The APAC plant protein ingredients market presents substantial growth potential. Continued innovation in plant protein technologies, coupled with rising consumer demand for healthy and sustainable food choices, will drive market expansion. Strategic partnerships, M&A activities, and investments in research and development will be key factors shaping the market’s future trajectory. Companies focusing on product diversification, sustainability initiatives, and catering to evolving consumer preferences are likely to gain a competitive edge. The market's growth will be fueled by increasing awareness of the environmental and health benefits associated with plant-based diets, leading to sustained growth in the forecast period.
APAC Plant Protein Ingredients Market Segmentation
-
1. Protein Type
- 1.1. Hemp Protein
- 1.2. Pea Protein
- 1.3. Potato Protein
- 1.4. Rice Protein
- 1.5. Soy Protein
- 1.6. Wheat Protein
- 1.7. Other Plant Protein
-
2. End User
- 2.1. Animal Feed
-
2.2. Food and Beverages
-
2.2.1. By Sub End User
- 2.2.1.1. Bakery
- 2.2.1.2. Breakfast Cereals
- 2.2.1.3. Condiments/Sauces
- 2.2.1.4. Confectionery
- 2.2.1.5. Dairy and Dairy Alternative Products
- 2.2.1.6. Meat/Poultry/Seafood and Meat Alternative Products
- 2.2.1.7. RTE/RTC Food Products
- 2.2.1.8. Snacks
-
2.2.1. By Sub End User
- 2.3. Personal Care and Cosmetics
-
2.4. Supplements
- 2.4.1. Baby Food and Infant Formula
- 2.4.2. Elderly Nutrition and Medical Nutrition
- 2.4.3. Sport/Performance Nutrition
APAC Plant Protein Ingredients Market Segmentation By Geography
-
1. North America
- 1.1. United States
- 1.2. Canada
- 1.3. Mexico
-
2. South America
- 2.1. Brazil
- 2.2. Argentina
- 2.3. Rest of South America
-
3. Europe
- 3.1. United Kingdom
- 3.2. Germany
- 3.3. France
- 3.4. Italy
- 3.5. Spain
- 3.6. Russia
- 3.7. Benelux
- 3.8. Nordics
- 3.9. Rest of Europe
-
4. Middle East & Africa
- 4.1. Turkey
- 4.2. Israel
- 4.3. GCC
- 4.4. North Africa
- 4.5. South Africa
- 4.6. Rest of Middle East & Africa
-
5. Asia Pacific
- 5.1. China
- 5.2. India
- 5.3. Japan
- 5.4. South Korea
- 5.5. ASEAN
- 5.6. Oceania
- 5.7. Rest of Asia Pacific
APAC Plant Protein Ingredients Market REPORT HIGHLIGHTS
| Aspects | Details |
|---|---|
| Study Period | 2019-2033 |
| Base Year | 2024 |
| Estimated Year | 2025 |
| Forecast Period | 2025-2033 |
| Historical Period | 2019-2024 |
| Growth Rate | CAGR of 2.67% from 2019-2033 |
| Segmentation |
|
Table of Contents
- 1. Introduction
- 1.1. Research Scope
- 1.2. Market Segmentation
- 1.3. Research Methodology
- 1.4. Definitions and Assumptions
- 2. Executive Summary
- 2.1. Introduction
- 3. Market Dynamics
- 3.1. Introduction
- 3.2. Market Drivers
- 3.2.1. Increasing Demand for Organic Plant Proteins; Increasing Application of Pea Protein in Food and Beverages
- 3.3. Market Restrains
- 3.3.1. Presence of Alternative protein sources
- 3.4. Market Trends
- 3.4.1. OTHER KEY INDUSTRY TRENDS COVERED IN THE REPORT
- 4. Market Factor Analysis
- 4.1. Porters Five Forces
- 4.2. Supply/Value Chain
- 4.3. PESTEL analysis
- 4.4. Market Entropy
- 4.5. Patent/Trademark Analysis
- 5. Global APAC Plant Protein Ingredients Market Analysis, Insights and Forecast, 2019-2031
- 5.1. Market Analysis, Insights and Forecast - by Protein Type
- 5.1.1. Hemp Protein
- 5.1.2. Pea Protein
- 5.1.3. Potato Protein
- 5.1.4. Rice Protein
- 5.1.5. Soy Protein
- 5.1.6. Wheat Protein
- 5.1.7. Other Plant Protein
- 5.2. Market Analysis, Insights and Forecast - by End User
- 5.2.1. Animal Feed
- 5.2.2. Food and Beverages
- 5.2.2.1. By Sub End User
- 5.2.2.1.1. Bakery
- 5.2.2.1.2. Breakfast Cereals
- 5.2.2.1.3. Condiments/Sauces
- 5.2.2.1.4. Confectionery
- 5.2.2.1.5. Dairy and Dairy Alternative Products
- 5.2.2.1.6. Meat/Poultry/Seafood and Meat Alternative Products
- 5.2.2.1.7. RTE/RTC Food Products
- 5.2.2.1.8. Snacks
- 5.2.2.1. By Sub End User
- 5.2.3. Personal Care and Cosmetics
- 5.2.4. Supplements
- 5.2.4.1. Baby Food and Infant Formula
- 5.2.4.2. Elderly Nutrition and Medical Nutrition
- 5.2.4.3. Sport/Performance Nutrition
- 5.3. Market Analysis, Insights and Forecast - by Region
- 5.3.1. North America
- 5.3.2. South America
- 5.3.3. Europe
- 5.3.4. Middle East & Africa
- 5.3.5. Asia Pacific
- 5.1. Market Analysis, Insights and Forecast - by Protein Type
- 6. North America APAC Plant Protein Ingredients Market Analysis, Insights and Forecast, 2019-2031
- 6.1. Market Analysis, Insights and Forecast - by Protein Type
- 6.1.1. Hemp Protein
- 6.1.2. Pea Protein
- 6.1.3. Potato Protein
- 6.1.4. Rice Protein
- 6.1.5. Soy Protein
- 6.1.6. Wheat Protein
- 6.1.7. Other Plant Protein
- 6.2. Market Analysis, Insights and Forecast - by End User
- 6.2.1. Animal Feed
- 6.2.2. Food and Beverages
- 6.2.2.1. By Sub End User
- 6.2.2.1.1. Bakery
- 6.2.2.1.2. Breakfast Cereals
- 6.2.2.1.3. Condiments/Sauces
- 6.2.2.1.4. Confectionery
- 6.2.2.1.5. Dairy and Dairy Alternative Products
- 6.2.2.1.6. Meat/Poultry/Seafood and Meat Alternative Products
- 6.2.2.1.7. RTE/RTC Food Products
- 6.2.2.1.8. Snacks
- 6.2.2.1. By Sub End User
- 6.2.3. Personal Care and Cosmetics
- 6.2.4. Supplements
- 6.2.4.1. Baby Food and Infant Formula
- 6.2.4.2. Elderly Nutrition and Medical Nutrition
- 6.2.4.3. Sport/Performance Nutrition
- 6.1. Market Analysis, Insights and Forecast - by Protein Type
- 7. South America APAC Plant Protein Ingredients Market Analysis, Insights and Forecast, 2019-2031
- 7.1. Market Analysis, Insights and Forecast - by Protein Type
- 7.1.1. Hemp Protein
- 7.1.2. Pea Protein
- 7.1.3. Potato Protein
- 7.1.4. Rice Protein
- 7.1.5. Soy Protein
- 7.1.6. Wheat Protein
- 7.1.7. Other Plant Protein
- 7.2. Market Analysis, Insights and Forecast - by End User
- 7.2.1. Animal Feed
- 7.2.2. Food and Beverages
- 7.2.2.1. By Sub End User
- 7.2.2.1.1. Bakery
- 7.2.2.1.2. Breakfast Cereals
- 7.2.2.1.3. Condiments/Sauces
- 7.2.2.1.4. Confectionery
- 7.2.2.1.5. Dairy and Dairy Alternative Products
- 7.2.2.1.6. Meat/Poultry/Seafood and Meat Alternative Products
- 7.2.2.1.7. RTE/RTC Food Products
- 7.2.2.1.8. Snacks
- 7.2.2.1. By Sub End User
- 7.2.3. Personal Care and Cosmetics
- 7.2.4. Supplements
- 7.2.4.1. Baby Food and Infant Formula
- 7.2.4.2. Elderly Nutrition and Medical Nutrition
- 7.2.4.3. Sport/Performance Nutrition
- 7.1. Market Analysis, Insights and Forecast - by Protein Type
- 8. Europe APAC Plant Protein Ingredients Market Analysis, Insights and Forecast, 2019-2031
- 8.1. Market Analysis, Insights and Forecast - by Protein Type
- 8.1.1. Hemp Protein
- 8.1.2. Pea Protein
- 8.1.3. Potato Protein
- 8.1.4. Rice Protein
- 8.1.5. Soy Protein
- 8.1.6. Wheat Protein
- 8.1.7. Other Plant Protein
- 8.2. Market Analysis, Insights and Forecast - by End User
- 8.2.1. Animal Feed
- 8.2.2. Food and Beverages
- 8.2.2.1. By Sub End User
- 8.2.2.1.1. Bakery
- 8.2.2.1.2. Breakfast Cereals
- 8.2.2.1.3. Condiments/Sauces
- 8.2.2.1.4. Confectionery
- 8.2.2.1.5. Dairy and Dairy Alternative Products
- 8.2.2.1.6. Meat/Poultry/Seafood and Meat Alternative Products
- 8.2.2.1.7. RTE/RTC Food Products
- 8.2.2.1.8. Snacks
- 8.2.2.1. By Sub End User
- 8.2.3. Personal Care and Cosmetics
- 8.2.4. Supplements
- 8.2.4.1. Baby Food and Infant Formula
- 8.2.4.2. Elderly Nutrition and Medical Nutrition
- 8.2.4.3. Sport/Performance Nutrition
- 8.1. Market Analysis, Insights and Forecast - by Protein Type
- 9. Middle East & Africa APAC Plant Protein Ingredients Market Analysis, Insights and Forecast, 2019-2031
- 9.1. Market Analysis, Insights and Forecast - by Protein Type
- 9.1.1. Hemp Protein
- 9.1.2. Pea Protein
- 9.1.3. Potato Protein
- 9.1.4. Rice Protein
- 9.1.5. Soy Protein
- 9.1.6. Wheat Protein
- 9.1.7. Other Plant Protein
- 9.2. Market Analysis, Insights and Forecast - by End User
- 9.2.1. Animal Feed
- 9.2.2. Food and Beverages
- 9.2.2.1. By Sub End User
- 9.2.2.1.1. Bakery
- 9.2.2.1.2. Breakfast Cereals
- 9.2.2.1.3. Condiments/Sauces
- 9.2.2.1.4. Confectionery
- 9.2.2.1.5. Dairy and Dairy Alternative Products
- 9.2.2.1.6. Meat/Poultry/Seafood and Meat Alternative Products
- 9.2.2.1.7. RTE/RTC Food Products
- 9.2.2.1.8. Snacks
- 9.2.2.1. By Sub End User
- 9.2.3. Personal Care and Cosmetics
- 9.2.4. Supplements
- 9.2.4.1. Baby Food and Infant Formula
- 9.2.4.2. Elderly Nutrition and Medical Nutrition
- 9.2.4.3. Sport/Performance Nutrition
- 9.1. Market Analysis, Insights and Forecast - by Protein Type
- 10. Asia Pacific APAC Plant Protein Ingredients Market Analysis, Insights and Forecast, 2019-2031
- 10.1. Market Analysis, Insights and Forecast - by Protein Type
- 10.1.1. Hemp Protein
- 10.1.2. Pea Protein
- 10.1.3. Potato Protein
- 10.1.4. Rice Protein
- 10.1.5. Soy Protein
- 10.1.6. Wheat Protein
- 10.1.7. Other Plant Protein
- 10.2. Market Analysis, Insights and Forecast - by End User
- 10.2.1. Animal Feed
- 10.2.2. Food and Beverages
- 10.2.2.1. By Sub End User
- 10.2.2.1.1. Bakery
- 10.2.2.1.2. Breakfast Cereals
- 10.2.2.1.3. Condiments/Sauces
- 10.2.2.1.4. Confectionery
- 10.2.2.1.5. Dairy and Dairy Alternative Products
- 10.2.2.1.6. Meat/Poultry/Seafood and Meat Alternative Products
- 10.2.2.1.7. RTE/RTC Food Products
- 10.2.2.1.8. Snacks
- 10.2.2.1. By Sub End User
- 10.2.3. Personal Care and Cosmetics
- 10.2.4. Supplements
- 10.2.4.1. Baby Food and Infant Formula
- 10.2.4.2. Elderly Nutrition and Medical Nutrition
- 10.2.4.3. Sport/Performance Nutrition
- 10.1. Market Analysis, Insights and Forecast - by Protein Type
- 11. North America APAC Plant Protein Ingredients Market Analysis, Insights and Forecast, 2019-2031
- 11.1. Market Analysis, Insights and Forecast - By Country/Sub-region
- 11.1.1 United States
- 11.1.2 Canada
- 11.1.3 Mexico
- 11.1.4 Rest of North America
- 12. Europe APAC Plant Protein Ingredients Market Analysis, Insights and Forecast, 2019-2031
- 12.1. Market Analysis, Insights and Forecast - By Country/Sub-region
- 12.1.1 Germany
- 12.1.2 United Kingdom
- 12.1.3 France
- 12.1.4 Russia
- 12.1.5 Spain
- 12.1.6 Rest of Europe
- 13. Asia Pacific APAC Plant Protein Ingredients Market Analysis, Insights and Forecast, 2019-2031
- 13.1. Market Analysis, Insights and Forecast - By Country/Sub-region
- 13.1.1 India
- 13.1.2 China
- 13.1.3 Japan
- 13.1.4 Rest of Asia Pacific
- 14. South America APAC Plant Protein Ingredients Market Analysis, Insights and Forecast, 2019-2031
- 14.1. Market Analysis, Insights and Forecast - By Country/Sub-region
- 14.1.1 Brazil
- 14.1.2 Argentina
- 14.1.3 Rest of South America
- 15. Middle East APAC Plant Protein Ingredients Market Analysis, Insights and Forecast, 2019-2031
- 15.1. Market Analysis, Insights and Forecast - By Country/Sub-region
- 15.1.1 Middle East
- 15.1.2 Africa
- 16. United Arab Emirates APAC Plant Protein Ingredients Market Analysis, Insights and Forecast, 2019-2031
- 16.1. Market Analysis, Insights and Forecast - By Country/Sub-region
- 16.1.1 South Africa
- 16.1.2 Rest of Middle East
- 17. Competitive Analysis
- 17.1. Global Market Share Analysis 2024
- 17.2. Company Profiles
- 17.2.1 CHS Inc
- 17.2.1.1. Overview
- 17.2.1.2. Products
- 17.2.1.3. SWOT Analysis
- 17.2.1.4. Recent Developments
- 17.2.1.5. Financials (Based on Availability)
- 17.2.2 Nippn Corporation
- 17.2.2.1. Overview
- 17.2.2.2. Products
- 17.2.2.3. SWOT Analysis
- 17.2.2.4. Recent Developments
- 17.2.2.5. Financials (Based on Availability)
- 17.2.3 Shandong Jianyuan Bioengineering Co Ltd
- 17.2.3.1. Overview
- 17.2.3.2. Products
- 17.2.3.3. SWOT Analysis
- 17.2.3.4. Recent Developments
- 17.2.3.5. Financials (Based on Availability)
- 17.2.4 International Flavors & Fragrances Inc
- 17.2.4.1. Overview
- 17.2.4.2. Products
- 17.2.4.3. SWOT Analysis
- 17.2.4.4. Recent Developments
- 17.2.4.5. Financials (Based on Availability)
- 17.2.5 Tereos SCA
- 17.2.5.1. Overview
- 17.2.5.2. Products
- 17.2.5.3. SWOT Analysis
- 17.2.5.4. Recent Developments
- 17.2.5.5. Financials (Based on Availability)
- 17.2.6 Wilmar International Lt
- 17.2.6.1. Overview
- 17.2.6.2. Products
- 17.2.6.3. SWOT Analysis
- 17.2.6.4. Recent Developments
- 17.2.6.5. Financials (Based on Availability)
- 17.2.7 Archer Daniels Midland Company
- 17.2.7.1. Overview
- 17.2.7.2. Products
- 17.2.7.3. SWOT Analysis
- 17.2.7.4. Recent Developments
- 17.2.7.5. Financials (Based on Availability)
- 17.2.8 Bunge Limited
- 17.2.8.1. Overview
- 17.2.8.2. Products
- 17.2.8.3. SWOT Analysis
- 17.2.8.4. Recent Developments
- 17.2.8.5. Financials (Based on Availability)
- 17.2.9 Fuji Oil Group
- 17.2.9.1. Overview
- 17.2.9.2. Products
- 17.2.9.3. SWOT Analysis
- 17.2.9.4. Recent Developments
- 17.2.9.5. Financials (Based on Availability)
- 17.2.10 Nagata Group
- 17.2.10.1. Overview
- 17.2.10.2. Products
- 17.2.10.3. SWOT Analysis
- 17.2.10.4. Recent Developments
- 17.2.10.5. Financials (Based on Availability)
- 17.2.11 Kerry Group PLC
- 17.2.11.1. Overview
- 17.2.11.2. Products
- 17.2.11.3. SWOT Analysis
- 17.2.11.4. Recent Developments
- 17.2.11.5. Financials (Based on Availability)
- 17.2.12 Südzucker AG
- 17.2.12.1. Overview
- 17.2.12.2. Products
- 17.2.12.3. SWOT Analysis
- 17.2.12.4. Recent Developments
- 17.2.12.5. Financials (Based on Availability)
- 17.2.1 CHS Inc
List of Figures
- Figure 1: Global APAC Plant Protein Ingredients Market Revenue Breakdown (Million, %) by Region 2024 & 2032
- Figure 2: Global APAC Plant Protein Ingredients Market Volume Breakdown (K Tons, %) by Region 2024 & 2032
- Figure 3: North America APAC Plant Protein Ingredients Market Revenue (Million), by Country 2024 & 2032
- Figure 4: North America APAC Plant Protein Ingredients Market Volume (K Tons), by Country 2024 & 2032
- Figure 5: North America APAC Plant Protein Ingredients Market Revenue Share (%), by Country 2024 & 2032
- Figure 6: North America APAC Plant Protein Ingredients Market Volume Share (%), by Country 2024 & 2032
- Figure 7: Europe APAC Plant Protein Ingredients Market Revenue (Million), by Country 2024 & 2032
- Figure 8: Europe APAC Plant Protein Ingredients Market Volume (K Tons), by Country 2024 & 2032
- Figure 9: Europe APAC Plant Protein Ingredients Market Revenue Share (%), by Country 2024 & 2032
- Figure 10: Europe APAC Plant Protein Ingredients Market Volume Share (%), by Country 2024 & 2032
- Figure 11: Asia Pacific APAC Plant Protein Ingredients Market Revenue (Million), by Country 2024 & 2032
- Figure 12: Asia Pacific APAC Plant Protein Ingredients Market Volume (K Tons), by Country 2024 & 2032
- Figure 13: Asia Pacific APAC Plant Protein Ingredients Market Revenue Share (%), by Country 2024 & 2032
- Figure 14: Asia Pacific APAC Plant Protein Ingredients Market Volume Share (%), by Country 2024 & 2032
- Figure 15: South America APAC Plant Protein Ingredients Market Revenue (Million), by Country 2024 & 2032
- Figure 16: South America APAC Plant Protein Ingredients Market Volume (K Tons), by Country 2024 & 2032
- Figure 17: South America APAC Plant Protein Ingredients Market Revenue Share (%), by Country 2024 & 2032
- Figure 18: South America APAC Plant Protein Ingredients Market Volume Share (%), by Country 2024 & 2032
- Figure 19: Middle East APAC Plant Protein Ingredients Market Revenue (Million), by Country 2024 & 2032
- Figure 20: Middle East APAC Plant Protein Ingredients Market Volume (K Tons), by Country 2024 & 2032
- Figure 21: Middle East APAC Plant Protein Ingredients Market Revenue Share (%), by Country 2024 & 2032
- Figure 22: Middle East APAC Plant Protein Ingredients Market Volume Share (%), by Country 2024 & 2032
- Figure 23: United Arab Emirates APAC Plant Protein Ingredients Market Revenue (Million), by Country 2024 & 2032
- Figure 24: United Arab Emirates APAC Plant Protein Ingredients Market Volume (K Tons), by Country 2024 & 2032
- Figure 25: United Arab Emirates APAC Plant Protein Ingredients Market Revenue Share (%), by Country 2024 & 2032
- Figure 26: United Arab Emirates APAC Plant Protein Ingredients Market Volume Share (%), by Country 2024 & 2032
- Figure 27: North America APAC Plant Protein Ingredients Market Revenue (Million), by Protein Type 2024 & 2032
- Figure 28: North America APAC Plant Protein Ingredients Market Volume (K Tons), by Protein Type 2024 & 2032
- Figure 29: North America APAC Plant Protein Ingredients Market Revenue Share (%), by Protein Type 2024 & 2032
- Figure 30: North America APAC Plant Protein Ingredients Market Volume Share (%), by Protein Type 2024 & 2032
- Figure 31: North America APAC Plant Protein Ingredients Market Revenue (Million), by End User 2024 & 2032
- Figure 32: North America APAC Plant Protein Ingredients Market Volume (K Tons), by End User 2024 & 2032
- Figure 33: North America APAC Plant Protein Ingredients Market Revenue Share (%), by End User 2024 & 2032
- Figure 34: North America APAC Plant Protein Ingredients Market Volume Share (%), by End User 2024 & 2032
- Figure 35: North America APAC Plant Protein Ingredients Market Revenue (Million), by Country 2024 & 2032
- Figure 36: North America APAC Plant Protein Ingredients Market Volume (K Tons), by Country 2024 & 2032
- Figure 37: North America APAC Plant Protein Ingredients Market Revenue Share (%), by Country 2024 & 2032
- Figure 38: North America APAC Plant Protein Ingredients Market Volume Share (%), by Country 2024 & 2032
- Figure 39: South America APAC Plant Protein Ingredients Market Revenue (Million), by Protein Type 2024 & 2032
- Figure 40: South America APAC Plant Protein Ingredients Market Volume (K Tons), by Protein Type 2024 & 2032
- Figure 41: South America APAC Plant Protein Ingredients Market Revenue Share (%), by Protein Type 2024 & 2032
- Figure 42: South America APAC Plant Protein Ingredients Market Volume Share (%), by Protein Type 2024 & 2032
- Figure 43: South America APAC Plant Protein Ingredients Market Revenue (Million), by End User 2024 & 2032
- Figure 44: South America APAC Plant Protein Ingredients Market Volume (K Tons), by End User 2024 & 2032
- Figure 45: South America APAC Plant Protein Ingredients Market Revenue Share (%), by End User 2024 & 2032
- Figure 46: South America APAC Plant Protein Ingredients Market Volume Share (%), by End User 2024 & 2032
- Figure 47: South America APAC Plant Protein Ingredients Market Revenue (Million), by Country 2024 & 2032
- Figure 48: South America APAC Plant Protein Ingredients Market Volume (K Tons), by Country 2024 & 2032
- Figure 49: South America APAC Plant Protein Ingredients Market Revenue Share (%), by Country 2024 & 2032
- Figure 50: South America APAC Plant Protein Ingredients Market Volume Share (%), by Country 2024 & 2032
- Figure 51: Europe APAC Plant Protein Ingredients Market Revenue (Million), by Protein Type 2024 & 2032
- Figure 52: Europe APAC Plant Protein Ingredients Market Volume (K Tons), by Protein Type 2024 & 2032
- Figure 53: Europe APAC Plant Protein Ingredients Market Revenue Share (%), by Protein Type 2024 & 2032
- Figure 54: Europe APAC Plant Protein Ingredients Market Volume Share (%), by Protein Type 2024 & 2032
- Figure 55: Europe APAC Plant Protein Ingredients Market Revenue (Million), by End User 2024 & 2032
- Figure 56: Europe APAC Plant Protein Ingredients Market Volume (K Tons), by End User 2024 & 2032
- Figure 57: Europe APAC Plant Protein Ingredients Market Revenue Share (%), by End User 2024 & 2032
- Figure 58: Europe APAC Plant Protein Ingredients Market Volume Share (%), by End User 2024 & 2032
- Figure 59: Europe APAC Plant Protein Ingredients Market Revenue (Million), by Country 2024 & 2032
- Figure 60: Europe APAC Plant Protein Ingredients Market Volume (K Tons), by Country 2024 & 2032
- Figure 61: Europe APAC Plant Protein Ingredients Market Revenue Share (%), by Country 2024 & 2032
- Figure 62: Europe APAC Plant Protein Ingredients Market Volume Share (%), by Country 2024 & 2032
- Figure 63: Middle East & Africa APAC Plant Protein Ingredients Market Revenue (Million), by Protein Type 2024 & 2032
- Figure 64: Middle East & Africa APAC Plant Protein Ingredients Market Volume (K Tons), by Protein Type 2024 & 2032
- Figure 65: Middle East & Africa APAC Plant Protein Ingredients Market Revenue Share (%), by Protein Type 2024 & 2032
- Figure 66: Middle East & Africa APAC Plant Protein Ingredients Market Volume Share (%), by Protein Type 2024 & 2032
- Figure 67: Middle East & Africa APAC Plant Protein Ingredients Market Revenue (Million), by End User 2024 & 2032
- Figure 68: Middle East & Africa APAC Plant Protein Ingredients Market Volume (K Tons), by End User 2024 & 2032
- Figure 69: Middle East & Africa APAC Plant Protein Ingredients Market Revenue Share (%), by End User 2024 & 2032
- Figure 70: Middle East & Africa APAC Plant Protein Ingredients Market Volume Share (%), by End User 2024 & 2032
- Figure 71: Middle East & Africa APAC Plant Protein Ingredients Market Revenue (Million), by Country 2024 & 2032
- Figure 72: Middle East & Africa APAC Plant Protein Ingredients Market Volume (K Tons), by Country 2024 & 2032
- Figure 73: Middle East & Africa APAC Plant Protein Ingredients Market Revenue Share (%), by Country 2024 & 2032
- Figure 74: Middle East & Africa APAC Plant Protein Ingredients Market Volume Share (%), by Country 2024 & 2032
- Figure 75: Asia Pacific APAC Plant Protein Ingredients Market Revenue (Million), by Protein Type 2024 & 2032
- Figure 76: Asia Pacific APAC Plant Protein Ingredients Market Volume (K Tons), by Protein Type 2024 & 2032
- Figure 77: Asia Pacific APAC Plant Protein Ingredients Market Revenue Share (%), by Protein Type 2024 & 2032
- Figure 78: Asia Pacific APAC Plant Protein Ingredients Market Volume Share (%), by Protein Type 2024 & 2032
- Figure 79: Asia Pacific APAC Plant Protein Ingredients Market Revenue (Million), by End User 2024 & 2032
- Figure 80: Asia Pacific APAC Plant Protein Ingredients Market Volume (K Tons), by End User 2024 & 2032
- Figure 81: Asia Pacific APAC Plant Protein Ingredients Market Revenue Share (%), by End User 2024 & 2032
- Figure 82: Asia Pacific APAC Plant Protein Ingredients Market Volume Share (%), by End User 2024 & 2032
- Figure 83: Asia Pacific APAC Plant Protein Ingredients Market Revenue (Million), by Country 2024 & 2032
- Figure 84: Asia Pacific APAC Plant Protein Ingredients Market Volume (K Tons), by Country 2024 & 2032
- Figure 85: Asia Pacific APAC Plant Protein Ingredients Market Revenue Share (%), by Country 2024 & 2032
- Figure 86: Asia Pacific APAC Plant Protein Ingredients Market Volume Share (%), by Country 2024 & 2032
List of Tables
- Table 1: Global APAC Plant Protein Ingredients Market Revenue Million Forecast, by Region 2019 & 2032
- Table 2: Global APAC Plant Protein Ingredients Market Volume K Tons Forecast, by Region 2019 & 2032
- Table 3: Global APAC Plant Protein Ingredients Market Revenue Million Forecast, by Protein Type 2019 & 2032
- Table 4: Global APAC Plant Protein Ingredients Market Volume K Tons Forecast, by Protein Type 2019 & 2032
- Table 5: Global APAC Plant Protein Ingredients Market Revenue Million Forecast, by End User 2019 & 2032
- Table 6: Global APAC Plant Protein Ingredients Market Volume K Tons Forecast, by End User 2019 & 2032
- Table 7: Global APAC Plant Protein Ingredients Market Revenue Million Forecast, by Region 2019 & 2032
- Table 8: Global APAC Plant Protein Ingredients Market Volume K Tons Forecast, by Region 2019 & 2032
- Table 9: Global APAC Plant Protein Ingredients Market Revenue Million Forecast, by Country 2019 & 2032
- Table 10: Global APAC Plant Protein Ingredients Market Volume K Tons Forecast, by Country 2019 & 2032
- Table 11: United States APAC Plant Protein Ingredients Market Revenue (Million) Forecast, by Application 2019 & 2032
- Table 12: United States APAC Plant Protein Ingredients Market Volume (K Tons) Forecast, by Application 2019 & 2032
- Table 13: Canada APAC Plant Protein Ingredients Market Revenue (Million) Forecast, by Application 2019 & 2032
- Table 14: Canada APAC Plant Protein Ingredients Market Volume (K Tons) Forecast, by Application 2019 & 2032
- Table 15: Mexico APAC Plant Protein Ingredients Market Revenue (Million) Forecast, by Application 2019 & 2032
- Table 16: Mexico APAC Plant Protein Ingredients Market Volume (K Tons) Forecast, by Application 2019 & 2032
- Table 17: Rest of North America APAC Plant Protein Ingredients Market Revenue (Million) Forecast, by Application 2019 & 2032
- Table 18: Rest of North America APAC Plant Protein Ingredients Market Volume (K Tons) Forecast, by Application 2019 & 2032
- Table 19: Global APAC Plant Protein Ingredients Market Revenue Million Forecast, by Country 2019 & 2032
- Table 20: Global APAC Plant Protein Ingredients Market Volume K Tons Forecast, by Country 2019 & 2032
- Table 21: Germany APAC Plant Protein Ingredients Market Revenue (Million) Forecast, by Application 2019 & 2032
- Table 22: Germany APAC Plant Protein Ingredients Market Volume (K Tons) Forecast, by Application 2019 & 2032
- Table 23: United Kingdom APAC Plant Protein Ingredients Market Revenue (Million) Forecast, by Application 2019 & 2032
- Table 24: United Kingdom APAC Plant Protein Ingredients Market Volume (K Tons) Forecast, by Application 2019 & 2032
- Table 25: France APAC Plant Protein Ingredients Market Revenue (Million) Forecast, by Application 2019 & 2032
- Table 26: France APAC Plant Protein Ingredients Market Volume (K Tons) Forecast, by Application 2019 & 2032
- Table 27: Russia APAC Plant Protein Ingredients Market Revenue (Million) Forecast, by Application 2019 & 2032
- Table 28: Russia APAC Plant Protein Ingredients Market Volume (K Tons) Forecast, by Application 2019 & 2032
- Table 29: Spain APAC Plant Protein Ingredients Market Revenue (Million) Forecast, by Application 2019 & 2032
- Table 30: Spain APAC Plant Protein Ingredients Market Volume (K Tons) Forecast, by Application 2019 & 2032
- Table 31: Rest of Europe APAC Plant Protein Ingredients Market Revenue (Million) Forecast, by Application 2019 & 2032
- Table 32: Rest of Europe APAC Plant Protein Ingredients Market Volume (K Tons) Forecast, by Application 2019 & 2032
- Table 33: Global APAC Plant Protein Ingredients Market Revenue Million Forecast, by Country 2019 & 2032
- Table 34: Global APAC Plant Protein Ingredients Market Volume K Tons Forecast, by Country 2019 & 2032
- Table 35: India APAC Plant Protein Ingredients Market Revenue (Million) Forecast, by Application 2019 & 2032
- Table 36: India APAC Plant Protein Ingredients Market Volume (K Tons) Forecast, by Application 2019 & 2032
- Table 37: China APAC Plant Protein Ingredients Market Revenue (Million) Forecast, by Application 2019 & 2032
- Table 38: China APAC Plant Protein Ingredients Market Volume (K Tons) Forecast, by Application 2019 & 2032
- Table 39: Japan APAC Plant Protein Ingredients Market Revenue (Million) Forecast, by Application 2019 & 2032
- Table 40: Japan APAC Plant Protein Ingredients Market Volume (K Tons) Forecast, by Application 2019 & 2032
- Table 41: Rest of Asia Pacific APAC Plant Protein Ingredients Market Revenue (Million) Forecast, by Application 2019 & 2032
- Table 42: Rest of Asia Pacific APAC Plant Protein Ingredients Market Volume (K Tons) Forecast, by Application 2019 & 2032
- Table 43: Global APAC Plant Protein Ingredients Market Revenue Million Forecast, by Country 2019 & 2032
- Table 44: Global APAC Plant Protein Ingredients Market Volume K Tons Forecast, by Country 2019 & 2032
- Table 45: Brazil APAC Plant Protein Ingredients Market Revenue (Million) Forecast, by Application 2019 & 2032
- Table 46: Brazil APAC Plant Protein Ingredients Market Volume (K Tons) Forecast, by Application 2019 & 2032
- Table 47: Argentina APAC Plant Protein Ingredients Market Revenue (Million) Forecast, by Application 2019 & 2032
- Table 48: Argentina APAC Plant Protein Ingredients Market Volume (K Tons) Forecast, by Application 2019 & 2032
- Table 49: Rest of South America APAC Plant Protein Ingredients Market Revenue (Million) Forecast, by Application 2019 & 2032
- Table 50: Rest of South America APAC Plant Protein Ingredients Market Volume (K Tons) Forecast, by Application 2019 & 2032
- Table 51: Global APAC Plant Protein Ingredients Market Revenue Million Forecast, by Country 2019 & 2032
- Table 52: Global APAC Plant Protein Ingredients Market Volume K Tons Forecast, by Country 2019 & 2032
- Table 53: Middle East APAC Plant Protein Ingredients Market Revenue (Million) Forecast, by Application 2019 & 2032
- Table 54: Middle East APAC Plant Protein Ingredients Market Volume (K Tons) Forecast, by Application 2019 & 2032
- Table 55: Africa APAC Plant Protein Ingredients Market Revenue (Million) Forecast, by Application 2019 & 2032
- Table 56: Africa APAC Plant Protein Ingredients Market Volume (K Tons) Forecast, by Application 2019 & 2032
- Table 57: Global APAC Plant Protein Ingredients Market Revenue Million Forecast, by Country 2019 & 2032
- Table 58: Global APAC Plant Protein Ingredients Market Volume K Tons Forecast, by Country 2019 & 2032
- Table 59: South Africa APAC Plant Protein Ingredients Market Revenue (Million) Forecast, by Application 2019 & 2032
- Table 60: South Africa APAC Plant Protein Ingredients Market Volume (K Tons) Forecast, by Application 2019 & 2032
- Table 61: Rest of Middle East APAC Plant Protein Ingredients Market Revenue (Million) Forecast, by Application 2019 & 2032
- Table 62: Rest of Middle East APAC Plant Protein Ingredients Market Volume (K Tons) Forecast, by Application 2019 & 2032
- Table 63: Global APAC Plant Protein Ingredients Market Revenue Million Forecast, by Protein Type 2019 & 2032
- Table 64: Global APAC Plant Protein Ingredients Market Volume K Tons Forecast, by Protein Type 2019 & 2032
- Table 65: Global APAC Plant Protein Ingredients Market Revenue Million Forecast, by End User 2019 & 2032
- Table 66: Global APAC Plant Protein Ingredients Market Volume K Tons Forecast, by End User 2019 & 2032
- Table 67: Global APAC Plant Protein Ingredients Market Revenue Million Forecast, by Country 2019 & 2032
- Table 68: Global APAC Plant Protein Ingredients Market Volume K Tons Forecast, by Country 2019 & 2032
- Table 69: United States APAC Plant Protein Ingredients Market Revenue (Million) Forecast, by Application 2019 & 2032
- Table 70: United States APAC Plant Protein Ingredients Market Volume (K Tons) Forecast, by Application 2019 & 2032
- Table 71: Canada APAC Plant Protein Ingredients Market Revenue (Million) Forecast, by Application 2019 & 2032
- Table 72: Canada APAC Plant Protein Ingredients Market Volume (K Tons) Forecast, by Application 2019 & 2032
- Table 73: Mexico APAC Plant Protein Ingredients Market Revenue (Million) Forecast, by Application 2019 & 2032
- Table 74: Mexico APAC Plant Protein Ingredients Market Volume (K Tons) Forecast, by Application 2019 & 2032
- Table 75: Global APAC Plant Protein Ingredients Market Revenue Million Forecast, by Protein Type 2019 & 2032
- Table 76: Global APAC Plant Protein Ingredients Market Volume K Tons Forecast, by Protein Type 2019 & 2032
- Table 77: Global APAC Plant Protein Ingredients Market Revenue Million Forecast, by End User 2019 & 2032
- Table 78: Global APAC Plant Protein Ingredients Market Volume K Tons Forecast, by End User 2019 & 2032
- Table 79: Global APAC Plant Protein Ingredients Market Revenue Million Forecast, by Country 2019 & 2032
- Table 80: Global APAC Plant Protein Ingredients Market Volume K Tons Forecast, by Country 2019 & 2032
- Table 81: Brazil APAC Plant Protein Ingredients Market Revenue (Million) Forecast, by Application 2019 & 2032
- Table 82: Brazil APAC Plant Protein Ingredients Market Volume (K Tons) Forecast, by Application 2019 & 2032
- Table 83: Argentina APAC Plant Protein Ingredients Market Revenue (Million) Forecast, by Application 2019 & 2032
- Table 84: Argentina APAC Plant Protein Ingredients Market Volume (K Tons) Forecast, by Application 2019 & 2032
- Table 85: Rest of South America APAC Plant Protein Ingredients Market Revenue (Million) Forecast, by Application 2019 & 2032
- Table 86: Rest of South America APAC Plant Protein Ingredients Market Volume (K Tons) Forecast, by Application 2019 & 2032
- Table 87: Global APAC Plant Protein Ingredients Market Revenue Million Forecast, by Protein Type 2019 & 2032
- Table 88: Global APAC Plant Protein Ingredients Market Volume K Tons Forecast, by Protein Type 2019 & 2032
- Table 89: Global APAC Plant Protein Ingredients Market Revenue Million Forecast, by End User 2019 & 2032
- Table 90: Global APAC Plant Protein Ingredients Market Volume K Tons Forecast, by End User 2019 & 2032
- Table 91: Global APAC Plant Protein Ingredients Market Revenue Million Forecast, by Country 2019 & 2032
- Table 92: Global APAC Plant Protein Ingredients Market Volume K Tons Forecast, by Country 2019 & 2032
- Table 93: United Kingdom APAC Plant Protein Ingredients Market Revenue (Million) Forecast, by Application 2019 & 2032
- Table 94: United Kingdom APAC Plant Protein Ingredients Market Volume (K Tons) Forecast, by Application 2019 & 2032
- Table 95: Germany APAC Plant Protein Ingredients Market Revenue (Million) Forecast, by Application 2019 & 2032
- Table 96: Germany APAC Plant Protein Ingredients Market Volume (K Tons) Forecast, by Application 2019 & 2032
- Table 97: France APAC Plant Protein Ingredients Market Revenue (Million) Forecast, by Application 2019 & 2032
- Table 98: France APAC Plant Protein Ingredients Market Volume (K Tons) Forecast, by Application 2019 & 2032
- Table 99: Italy APAC Plant Protein Ingredients Market Revenue (Million) Forecast, by Application 2019 & 2032
- Table 100: Italy APAC Plant Protein Ingredients Market Volume (K Tons) Forecast, by Application 2019 & 2032
- Table 101: Spain APAC Plant Protein Ingredients Market Revenue (Million) Forecast, by Application 2019 & 2032
- Table 102: Spain APAC Plant Protein Ingredients Market Volume (K Tons) Forecast, by Application 2019 & 2032
- Table 103: Russia APAC Plant Protein Ingredients Market Revenue (Million) Forecast, by Application 2019 & 2032
- Table 104: Russia APAC Plant Protein Ingredients Market Volume (K Tons) Forecast, by Application 2019 & 2032
- Table 105: Benelux APAC Plant Protein Ingredients Market Revenue (Million) Forecast, by Application 2019 & 2032
- Table 106: Benelux APAC Plant Protein Ingredients Market Volume (K Tons) Forecast, by Application 2019 & 2032
- Table 107: Nordics APAC Plant Protein Ingredients Market Revenue (Million) Forecast, by Application 2019 & 2032
- Table 108: Nordics APAC Plant Protein Ingredients Market Volume (K Tons) Forecast, by Application 2019 & 2032
- Table 109: Rest of Europe APAC Plant Protein Ingredients Market Revenue (Million) Forecast, by Application 2019 & 2032
- Table 110: Rest of Europe APAC Plant Protein Ingredients Market Volume (K Tons) Forecast, by Application 2019 & 2032
- Table 111: Global APAC Plant Protein Ingredients Market Revenue Million Forecast, by Protein Type 2019 & 2032
- Table 112: Global APAC Plant Protein Ingredients Market Volume K Tons Forecast, by Protein Type 2019 & 2032
- Table 113: Global APAC Plant Protein Ingredients Market Revenue Million Forecast, by End User 2019 & 2032
- Table 114: Global APAC Plant Protein Ingredients Market Volume K Tons Forecast, by End User 2019 & 2032
- Table 115: Global APAC Plant Protein Ingredients Market Revenue Million Forecast, by Country 2019 & 2032
- Table 116: Global APAC Plant Protein Ingredients Market Volume K Tons Forecast, by Country 2019 & 2032
- Table 117: Turkey APAC Plant Protein Ingredients Market Revenue (Million) Forecast, by Application 2019 & 2032
- Table 118: Turkey APAC Plant Protein Ingredients Market Volume (K Tons) Forecast, by Application 2019 & 2032
- Table 119: Israel APAC Plant Protein Ingredients Market Revenue (Million) Forecast, by Application 2019 & 2032
- Table 120: Israel APAC Plant Protein Ingredients Market Volume (K Tons) Forecast, by Application 2019 & 2032
- Table 121: GCC APAC Plant Protein Ingredients Market Revenue (Million) Forecast, by Application 2019 & 2032
- Table 122: GCC APAC Plant Protein Ingredients Market Volume (K Tons) Forecast, by Application 2019 & 2032
- Table 123: North Africa APAC Plant Protein Ingredients Market Revenue (Million) Forecast, by Application 2019 & 2032
- Table 124: North Africa APAC Plant Protein Ingredients Market Volume (K Tons) Forecast, by Application 2019 & 2032
- Table 125: South Africa APAC Plant Protein Ingredients Market Revenue (Million) Forecast, by Application 2019 & 2032
- Table 126: South Africa APAC Plant Protein Ingredients Market Volume (K Tons) Forecast, by Application 2019 & 2032
- Table 127: Rest of Middle East & Africa APAC Plant Protein Ingredients Market Revenue (Million) Forecast, by Application 2019 & 2032
- Table 128: Rest of Middle East & Africa APAC Plant Protein Ingredients Market Volume (K Tons) Forecast, by Application 2019 & 2032
- Table 129: Global APAC Plant Protein Ingredients Market Revenue Million Forecast, by Protein Type 2019 & 2032
- Table 130: Global APAC Plant Protein Ingredients Market Volume K Tons Forecast, by Protein Type 2019 & 2032
- Table 131: Global APAC Plant Protein Ingredients Market Revenue Million Forecast, by End User 2019 & 2032
- Table 132: Global APAC Plant Protein Ingredients Market Volume K Tons Forecast, by End User 2019 & 2032
- Table 133: Global APAC Plant Protein Ingredients Market Revenue Million Forecast, by Country 2019 & 2032
- Table 134: Global APAC Plant Protein Ingredients Market Volume K Tons Forecast, by Country 2019 & 2032
- Table 135: China APAC Plant Protein Ingredients Market Revenue (Million) Forecast, by Application 2019 & 2032
- Table 136: China APAC Plant Protein Ingredients Market Volume (K Tons) Forecast, by Application 2019 & 2032
- Table 137: India APAC Plant Protein Ingredients Market Revenue (Million) Forecast, by Application 2019 & 2032
- Table 138: India APAC Plant Protein Ingredients Market Volume (K Tons) Forecast, by Application 2019 & 2032
- Table 139: Japan APAC Plant Protein Ingredients Market Revenue (Million) Forecast, by Application 2019 & 2032
- Table 140: Japan APAC Plant Protein Ingredients Market Volume (K Tons) Forecast, by Application 2019 & 2032
- Table 141: South Korea APAC Plant Protein Ingredients Market Revenue (Million) Forecast, by Application 2019 & 2032
- Table 142: South Korea APAC Plant Protein Ingredients Market Volume (K Tons) Forecast, by Application 2019 & 2032
- Table 143: ASEAN APAC Plant Protein Ingredients Market Revenue (Million) Forecast, by Application 2019 & 2032
- Table 144: ASEAN APAC Plant Protein Ingredients Market Volume (K Tons) Forecast, by Application 2019 & 2032
- Table 145: Oceania APAC Plant Protein Ingredients Market Revenue (Million) Forecast, by Application 2019 & 2032
- Table 146: Oceania APAC Plant Protein Ingredients Market Volume (K Tons) Forecast, by Application 2019 & 2032
- Table 147: Rest of Asia Pacific APAC Plant Protein Ingredients Market Revenue (Million) Forecast, by Application 2019 & 2032
- Table 148: Rest of Asia Pacific APAC Plant Protein Ingredients Market Volume (K Tons) Forecast, by Application 2019 & 2032
Frequently Asked Questions
1. What is the projected Compound Annual Growth Rate (CAGR) of the APAC Plant Protein Ingredients Market?
The projected CAGR is approximately 2.67%.
2. Which companies are prominent players in the APAC Plant Protein Ingredients Market?
Key companies in the market include CHS Inc, Nippn Corporation, Shandong Jianyuan Bioengineering Co Ltd, International Flavors & Fragrances Inc, Tereos SCA, Wilmar International Lt, Archer Daniels Midland Company, Bunge Limited, Fuji Oil Group, Nagata Group, Kerry Group PLC, Südzucker AG.
3. What are the main segments of the APAC Plant Protein Ingredients Market?
The market segments include Protein Type, End User.
4. Can you provide details about the market size?
The market size is estimated to be USD XX Million as of 2022.
5. What are some drivers contributing to market growth?
Increasing Demand for Organic Plant Proteins; Increasing Application of Pea Protein in Food and Beverages.
6. What are the notable trends driving market growth?
OTHER KEY INDUSTRY TRENDS COVERED IN THE REPORT.
7. Are there any restraints impacting market growth?
Presence of Alternative protein sources.
8. Can you provide examples of recent developments in the market?
May 2022: BENEO, a subsidiary of Südzucker, entered a purchase agreement to acquire Meatless BV, a producer of functional ingredients. BENEO is expanding its existing product offering with the acquisition to offer an even broader range of texturizing solutions for meat and fish alternatives.April 2021: ADM opened a new, cutting-edge plant-based innovation lab located in ADM’s Biopolis research hub in Singapore. The lab develops advanced products and customized solutions to meet the growing food and beverage demand in the Asia-Pacific region. The ADM Biopolis research hub in Singapore features a wide range of capabilities, including a food and flavor analytic lab, beverage and dairy applications lab and pilot plant, bakery and confectionery lab, meat and savory lab, sweet and savory creation lab, sensory evaluation facilities, customer innovation center, and a new plant-based innovation lab.April 2021: Bunge Limited has invested USD 45.7 million in Australian Plant Proteins (APP) to double the production of plant protein isolates in the country by March 2022. The ingredients manufactured by APP include fava bean isolate powder, yellow lentil isolate powder, and red lentil isolate powder.
9. What pricing options are available for accessing the report?
Pricing options include single-user, multi-user, and enterprise licenses priced at USD 3800, USD 4500, and USD 5800 respectively.
10. Is the market size provided in terms of value or volume?
The market size is provided in terms of value, measured in Million and volume, measured in K Tons.
11. Are there any specific market keywords associated with the report?
Yes, the market keyword associated with the report is "APAC Plant Protein Ingredients Market," which aids in identifying and referencing the specific market segment covered.
12. How do I determine which pricing option suits my needs best?
The pricing options vary based on user requirements and access needs. Individual users may opt for single-user licenses, while businesses requiring broader access may choose multi-user or enterprise licenses for cost-effective access to the report.
13. Are there any additional resources or data provided in the APAC Plant Protein Ingredients Market report?
While the report offers comprehensive insights, it's advisable to review the specific contents or supplementary materials provided to ascertain if additional resources or data are available.
14. How can I stay updated on further developments or reports in the APAC Plant Protein Ingredients Market?
To stay informed about further developments, trends, and reports in the APAC Plant Protein Ingredients Market, consider subscribing to industry newsletters, following relevant companies and organizations, or regularly checking reputable industry news sources and publications.
Methodology
Step 1 - Identification of Relevant Samples Size from Population Database


Step 2 - Approaches for Defining Global Market Size (Value, Volume* & Price*)

Note*: In applicable scenarios
Step 3 - Data Sources
Primary Research
- Web Analytics
- Survey Reports
- Research Institute
- Latest Research Reports
- Opinion Leaders
Secondary Research
- Annual Reports
- White Paper
- Latest Press Release
- Industry Association
- Paid Database
- Investor Presentations

Step 4 - Data Triangulation
Involves using different sources of information in order to increase the validity of a study
These sources are likely to be stakeholders in a program - participants, other researchers, program staff, other community members, and so on.
Then we put all data in single framework & apply various statistical tools to find out the dynamic on the market.
During the analysis stage, feedback from the stakeholder groups would be compared to determine areas of agreement as well as areas of divergence


