
Key Insights
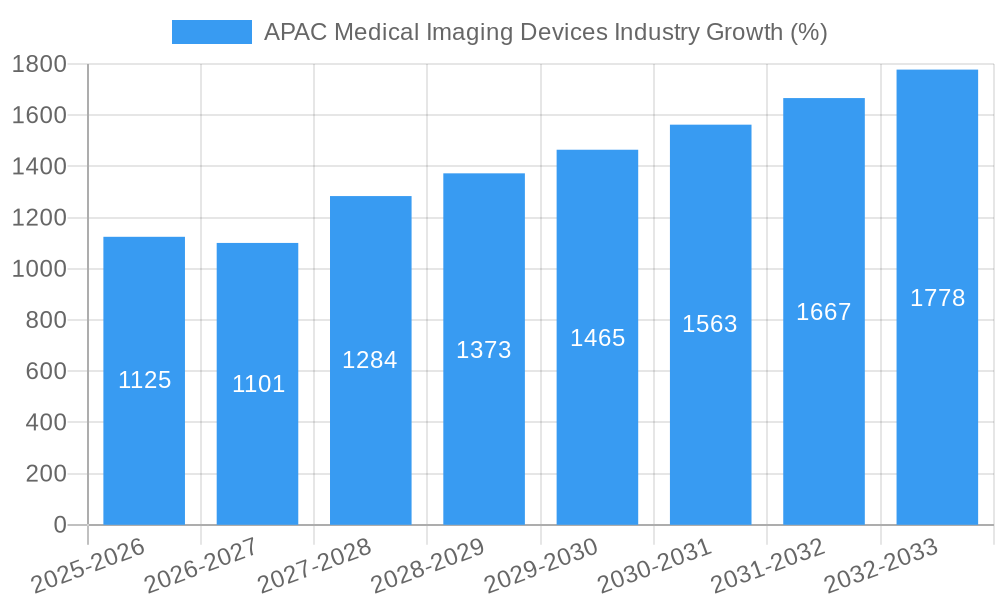
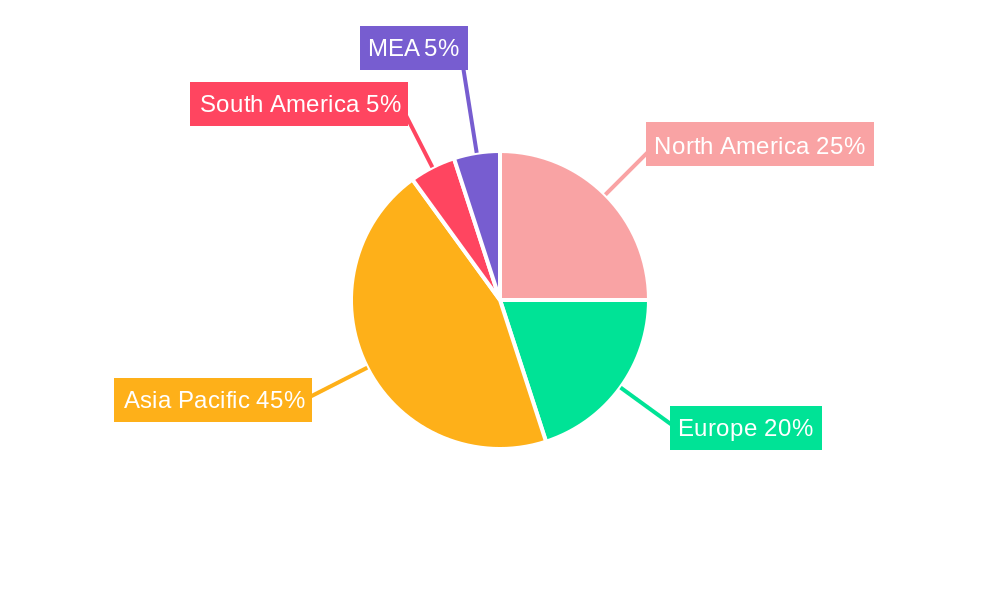
The Asia-Pacific (APAC) medical imaging devices market is experiencing robust growth, driven by rising prevalence of chronic diseases, increasing geriatric population, improving healthcare infrastructure, and expanding medical tourism. The region's diverse demographics and varying healthcare systems present both opportunities and challenges. While countries like China, Japan, India, and South Korea are leading the market with advanced medical facilities and increasing adoption of technologically advanced imaging modalities such as MRI, CT, and PET/CT scans, other Southeast Asian nations are witnessing significant growth fueled by rising disposable incomes and government initiatives to improve healthcare access. The market segmentation reveals strong demand across cardiology, oncology, and neurology applications, reflecting the high incidence of cardiovascular diseases, cancer, and neurological disorders in the region. However, uneven distribution of resources and healthcare disparities across different APAC nations pose a significant challenge, hindering uniform market penetration. Furthermore, high costs associated with advanced imaging technologies and the need for skilled professionals to operate and interpret the results can restrict market growth in certain segments. Despite these challenges, the overall market trajectory indicates sustained growth, propelled by increasing investments in healthcare infrastructure, technological advancements, and the increasing adoption of minimally invasive procedures which rely heavily on advanced imaging for diagnosis and treatment guidance. The 7.50% CAGR suggests a substantial market expansion over the forecast period (2025-2033). This growth will likely be concentrated in the higher-growth segments, such as advanced imaging modalities and applications in rapidly developing economies within the region.
The competitive landscape is characterized by a mix of global giants and regional players. Established international companies like GE Healthcare, Philips, and Siemens hold significant market share due to their technological expertise and established distribution networks. However, the presence of several regional players, notably in China and India, signifies increasing local competition. These companies are often focusing on cost-effective solutions tailored to the specific needs of the local markets, thus further stimulating market growth. The ongoing technological advancements, such as the integration of AI and machine learning in medical imaging, promise to further enhance the efficiency and accuracy of diagnostic procedures and will continue to shape the landscape of the APAC medical imaging devices market in the coming years. The market will likely see consolidation as larger players seek to expand their market share through acquisitions and strategic partnerships, leading to greater innovation and broader accessibility of advanced imaging technologies across the APAC region.
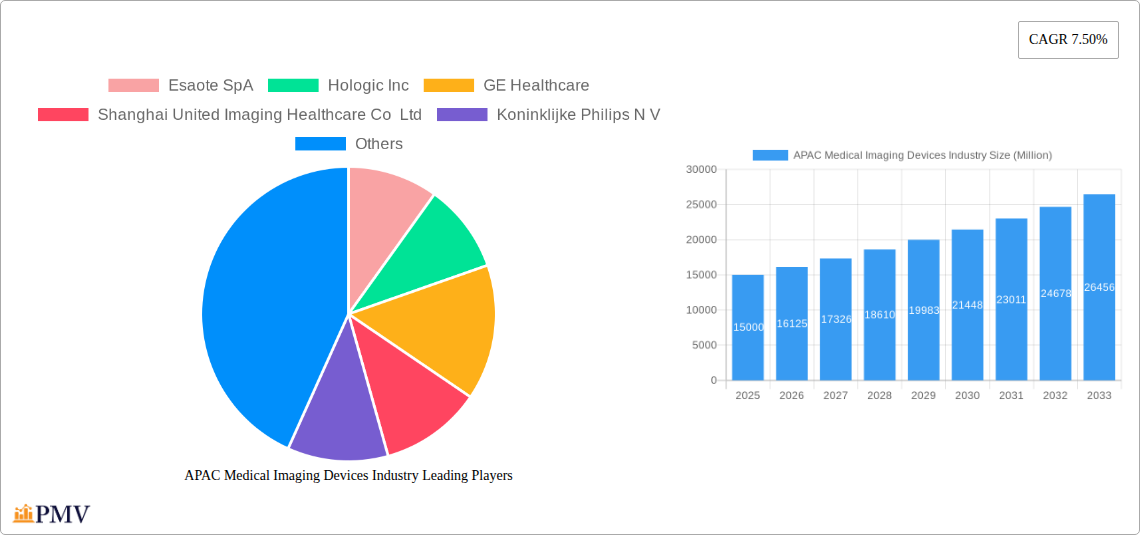
This comprehensive report provides an in-depth analysis of the Asia-Pacific (APAC) medical imaging devices industry, offering valuable insights for stakeholders, investors, and industry professionals. The study period covers 2019-2033, with 2025 as the base and estimated year. The forecast period extends from 2025 to 2033, encompassing historical data from 2019-2024. The report segments the market by modality (MRI, CT, X-ray, Ultrasound, Nuclear Imaging), application (Cardiology, Oncology, Neurology, Orthopedics, Gastroenterology, Gynecology, Other Applications), end-user (Hospital, Diagnostic Centers, Other End-Users), and specific technologies like Single Photon Emission Computed Tomography (SPECT) and Mammography, analyzing key players including Esaote SpA, Hologic Inc, GE Healthcare, Shanghai United Imaging Healthcare Co Ltd, Koninklijke Philips N V, Siemens AG, FUJIFILM Holdings Corporation, Carestream Health, J Morita Corporation, Canon Medical Systems Corporation, Teknova Medical Systems Limited, and Shimadzu Corporation.
APAC Medical Imaging Devices Industry Market Structure & Competitive Dynamics
The APAC medical imaging devices market exhibits a moderately consolidated structure, with a few multinational corporations holding significant market share. The industry is characterized by a dynamic innovation ecosystem, driven by technological advancements and increasing demand for advanced imaging solutions. Regulatory frameworks vary across the region, impacting market access and product approvals. The market also witnesses significant M&A activities, reflecting the strategic importance of acquiring technological capabilities and expanding market reach. Key players actively engage in collaborations and strategic partnerships to enhance their market position and expand their product portfolio. For example, the merger between xx and yy in 2023 resulted in a combined market share of xx%, while the acquisition of zz by aa in 2022 valued at xx Million demonstrated the industry's high consolidation pace.
- Market Concentration: Moderately consolidated, with top 5 players holding approximately xx% market share in 2024.
- Innovation Ecosystem: Highly dynamic, with continuous advancements in AI-powered imaging, 3D/4D imaging, and minimally invasive procedures driving market growth.
- Regulatory Frameworks: Variable across APAC countries; impacting product approvals and market access.
- Product Substitutes: Limited substitutes for specific imaging modalities; however, the rise of alternative diagnostic techniques poses a moderate threat.
- End-User Trends: Increasing preference for advanced imaging modalities, coupled with the rising prevalence of chronic diseases, drives industry demand.
- M&A Activities: Significant M&A activity observed in the past 5 years, with an estimated total deal value of xx Million.
APAC Medical Imaging Devices Industry Industry Trends & Insights
The APAC medical imaging devices market is experiencing robust growth, driven by several factors. The rising prevalence of chronic diseases like cancer and cardiovascular ailments necessitates advanced diagnostic tools, fueling market expansion. Technological advancements, including AI-powered image analysis and improved image resolution, are enhancing diagnostic accuracy and efficiency. Government initiatives to improve healthcare infrastructure and increase access to quality healthcare are further boosting the market. Furthermore, increasing disposable incomes and rising healthcare expenditure in several APAC countries contribute to market growth. The market is projected to register a CAGR of xx% during the forecast period (2025-2033), exceeding xx Million by 2033. Market penetration of advanced imaging modalities, such as MRI and CT, is steadily increasing, especially in rapidly developing economies. Competitive dynamics are shaped by continuous innovation, strategic partnerships, and a focus on providing comprehensive solutions.
Dominant Markets & Segments in APAC Medical Imaging Devices Industry
China and India are the dominant markets within the APAC medical imaging devices industry, driven by their large populations, growing healthcare expenditure, and increasing prevalence of chronic diseases. Within the segment breakdown:
Leading Region: Greater China (China, Hong Kong, Taiwan)
Leading Country: China
Leading Modality: CT and X-ray, followed by Ultrasound and MRI.
Leading Application: Oncology and Cardiology, driven by high disease prevalence and advanced diagnostic needs.
Key Drivers for China's Dominance:
- Large and rapidly aging population.
- Rising healthcare expenditure.
- Government initiatives to improve healthcare infrastructure.
- Significant investments in advanced medical technologies.
- A large and growing number of hospitals and diagnostic centers.
Key Drivers for India's Growth:
- Large and growing population with rising incidence of chronic diseases.
- Increasing disposable incomes.
- Government initiatives to expand healthcare access.
- Focus on improving healthcare infrastructure.
APAP Medical Imaging Devices Industry Product Innovations
Recent innovations in the APAC medical imaging devices market focus on improved image quality, reduced radiation exposure, AI-powered image analysis, and portability. Miniaturized systems, cloud-based image management, and AI-driven diagnostic support are gaining traction. Manufacturers are focusing on developing cost-effective solutions to address the diverse needs of the APAC market, catering to both high-end and budget-conscious healthcare facilities. These advancements are driving improved diagnostic accuracy, faster turnaround times, and enhanced patient care.
Report Segmentation & Scope
This report provides a detailed segmentation of the APAC medical imaging devices market:
By Modality: MRI, CT, X-ray, Ultrasound, Nuclear Imaging (including SPECT). Each modality segment is analyzed in terms of market size, growth projections, and competitive landscape. The MRI market is expected to witness significant growth due to technological advancements and increasing demand for high-resolution imaging.
By Application: Cardiology, Oncology, Neurology, Orthopedics, Gastroenterology, Gynecology, Other Applications. Each application segment is analyzed based on its market size, growth rate, and key driving factors. Oncology and Cardiology applications are expected to dominate the market due to the high prevalence of related diseases.
By End-User: Hospital, Diagnostic Centers, Other End-Users. The hospital segment holds the largest market share, while the diagnostic centers segment is witnessing rapid growth due to an increase in outpatient procedures.
By Technology: Single Photon Emission Computed Tomography (SPECT) and Mammography, are analyzed separately, examining market size, growth trends, and key technological advancements.
Key Drivers of APAC Medical Imaging Devices Industry Growth
Several factors are driving the growth of the APAC medical imaging devices industry:
- Technological advancements: AI-powered image analysis, improved image resolution, and miniaturized systems.
- Rising prevalence of chronic diseases: Increased demand for early and accurate diagnosis.
- Government initiatives: Investments in healthcare infrastructure and expansion of healthcare access programs.
- Increasing healthcare expenditure: Growing disposable incomes and rising awareness of health issues.
Challenges in the APAC Medical Imaging Devices Industry Sector
The APAC medical imaging devices market faces certain challenges:
- Regulatory hurdles: Varying regulatory frameworks across different countries can delay product approvals and market entry.
- Supply chain disruptions: Global supply chain issues can affect the availability and cost of components.
- Competitive pressure: Intense competition among established players and emerging companies.
- High initial investment costs: Advanced imaging systems require substantial investment, limiting accessibility in some regions.
Leading Players in the APAC Medical Imaging Devices Industry Market
- Esaote SpA
- Hologic Inc
- GE Healthcare
- Shanghai United Imaging Healthcare Co Ltd
- Koninklijke Philips N V
- Siemens AG
- FUJIFILM Holdings Corporation
- Carestream Health
- J Morita Corporation
- Canon Medical Systems Corporation
- Teknova Medical Systems Limited
- Shimadzu Corporation
Key Developments in APAC Medical Imaging Devices Industry Sector
- October 2022: Luxonus Inc. received approval to market its photoacoustic 3D imaging system in Japan, marking a significant advancement in non-invasive imaging technology.
- February 2022: Siemens Healthineers and Universal Medical Imaging signed a strategic collaboration agreement to improve image screening and disease diagnosis in Chinese primary healthcare facilities, highlighting the growing importance of partnerships in expanding access to advanced imaging technology.
Strategic APAC Medical Imaging Devices Industry Market Outlook
The APAC medical imaging devices market presents significant growth potential, driven by technological innovation, increasing healthcare expenditure, and rising prevalence of chronic diseases. Strategic opportunities exist in developing cost-effective solutions, expanding into underserved markets, and leveraging AI and data analytics to improve diagnostic accuracy and efficiency. Further growth will be fueled by strategic partnerships, collaborations, and continued investment in research and development. Focusing on customized solutions catering to the diverse needs of APAC countries and integrating advanced technologies will be crucial for success.
APAC Medical Imaging Devices Industry Segmentation
-
1. Modality
-
1.1. MRI
- 1.1.1. Low and mid field MRI systems (<1.5 T)
- 1.1.2. High field MRI systems (1.5-3 T)
- 1.1.3. Very Hig
-
1.2. Computed Tomography
- 1.2.1. Low End Scanners (~16-Slice)
- 1.2.2. Mid Range Scanners (~64-Slice)
- 1.2.3. High End Scanners (128-Slice and More)
-
1.3. Ultrasound
- 1.3.1. 2D Ultrasound
- 1.3.2. 3D Ultrasound
- 1.3.3. Other Types of Ultrasound
-
1.4. X-Ray
- 1.4.1. Analog Systems
- 1.4.2. Digital Systems
-
1.5. Nuclear Imaging
- 1.5.1. Positron Emission Tomography (PET)
- 1.5.2. Single Photon Emission Computed Tomography (SPECT)
- 1.6. Fluoroscopy
- 1.7. Mammography
-
1.1. MRI
-
2. Application
- 2.1. Cardiology
- 2.2. Oncology
- 2.3. Neurology
- 2.4. Orthopedics
- 2.5. Gastroenterology
- 2.6. Gynecology
- 2.7. Other Applications
-
3. End-User
- 3.1. Hospital
- 3.2. Diagnostic Centers
- 3.3. Other End-Users
-
4. Geography
- 4.1. China
- 4.2. Japan
- 4.3. India
- 4.4. Australia
- 4.5. South Korea
- 4.6. Rest of Asia-Pacific
APAC Medical Imaging Devices Industry Segmentation By Geography
- 1. China
- 2. Japan
- 3. India
- 4. Australia
- 5. South Korea
- 6. Rest of Asia Pacific
APAC Medical Imaging Devices Industry REPORT HIGHLIGHTS
| Aspects | Details |
|---|---|
| Study Period | 2019-2033 |
| Base Year | 2024 |
| Estimated Year | 2025 |
| Forecast Period | 2025-2033 |
| Historical Period | 2019-2024 |
| Growth Rate | CAGR of 7.50% from 2019-2033 |
| Segmentation |
|
Table of Contents
- 1. Introduction
- 1.1. Research Scope
- 1.2. Market Segmentation
- 1.3. Research Methodology
- 1.4. Definitions and Assumptions
- 2. Executive Summary
- 2.1. Introduction
- 3. Market Dynamics
- 3.1. Introduction
- 3.2. Market Drivers
- 3.2.1. Rising Prevalence of Chronic Diseases; Technological Advancement in Imaging Modalities; Growing Emphasis on Early Diagnosis
- 3.3. Market Restrains
- 3.3.1. Lack of Skilled Radiologist; High Cost of Advanced Diagnostic Imaging Devices
- 3.4. Market Trends
- 3.4.1. Oncology Segment is Expected to Witness a Healthy Growth in Coming Years
- 4. Market Factor Analysis
- 4.1. Porters Five Forces
- 4.2. Supply/Value Chain
- 4.3. PESTEL analysis
- 4.4. Market Entropy
- 4.5. Patent/Trademark Analysis
- 5. Global APAC Medical Imaging Devices Industry Analysis, Insights and Forecast, 2019-2031
- 5.1. Market Analysis, Insights and Forecast - by Modality
- 5.1.1. MRI
- 5.1.1.1. Low and mid field MRI systems (<1.5 T)
- 5.1.1.2. High field MRI systems (1.5-3 T)
- 5.1.1.3. Very Hig
- 5.1.2. Computed Tomography
- 5.1.2.1. Low End Scanners (~16-Slice)
- 5.1.2.2. Mid Range Scanners (~64-Slice)
- 5.1.2.3. High End Scanners (128-Slice and More)
- 5.1.3. Ultrasound
- 5.1.3.1. 2D Ultrasound
- 5.1.3.2. 3D Ultrasound
- 5.1.3.3. Other Types of Ultrasound
- 5.1.4. X-Ray
- 5.1.4.1. Analog Systems
- 5.1.4.2. Digital Systems
- 5.1.5. Nuclear Imaging
- 5.1.5.1. Positron Emission Tomography (PET)
- 5.1.5.2. Single Photon Emission Computed Tomography (SPECT)
- 5.1.6. Fluoroscopy
- 5.1.7. Mammography
- 5.1.1. MRI
- 5.2. Market Analysis, Insights and Forecast - by Application
- 5.2.1. Cardiology
- 5.2.2. Oncology
- 5.2.3. Neurology
- 5.2.4. Orthopedics
- 5.2.5. Gastroenterology
- 5.2.6. Gynecology
- 5.2.7. Other Applications
- 5.3. Market Analysis, Insights and Forecast - by End-User
- 5.3.1. Hospital
- 5.3.2. Diagnostic Centers
- 5.3.3. Other End-Users
- 5.4. Market Analysis, Insights and Forecast - by Geography
- 5.4.1. China
- 5.4.2. Japan
- 5.4.3. India
- 5.4.4. Australia
- 5.4.5. South Korea
- 5.4.6. Rest of Asia-Pacific
- 5.5. Market Analysis, Insights and Forecast - by Region
- 5.5.1. China
- 5.5.2. Japan
- 5.5.3. India
- 5.5.4. Australia
- 5.5.5. South Korea
- 5.5.6. Rest of Asia Pacific
- 5.1. Market Analysis, Insights and Forecast - by Modality
- 6. China APAC Medical Imaging Devices Industry Analysis, Insights and Forecast, 2019-2031
- 6.1. Market Analysis, Insights and Forecast - by Modality
- 6.1.1. MRI
- 6.1.1.1. Low and mid field MRI systems (<1.5 T)
- 6.1.1.2. High field MRI systems (1.5-3 T)
- 6.1.1.3. Very Hig
- 6.1.2. Computed Tomography
- 6.1.2.1. Low End Scanners (~16-Slice)
- 6.1.2.2. Mid Range Scanners (~64-Slice)
- 6.1.2.3. High End Scanners (128-Slice and More)
- 6.1.3. Ultrasound
- 6.1.3.1. 2D Ultrasound
- 6.1.3.2. 3D Ultrasound
- 6.1.3.3. Other Types of Ultrasound
- 6.1.4. X-Ray
- 6.1.4.1. Analog Systems
- 6.1.4.2. Digital Systems
- 6.1.5. Nuclear Imaging
- 6.1.5.1. Positron Emission Tomography (PET)
- 6.1.5.2. Single Photon Emission Computed Tomography (SPECT)
- 6.1.6. Fluoroscopy
- 6.1.7. Mammography
- 6.1.1. MRI
- 6.2. Market Analysis, Insights and Forecast - by Application
- 6.2.1. Cardiology
- 6.2.2. Oncology
- 6.2.3. Neurology
- 6.2.4. Orthopedics
- 6.2.5. Gastroenterology
- 6.2.6. Gynecology
- 6.2.7. Other Applications
- 6.3. Market Analysis, Insights and Forecast - by End-User
- 6.3.1. Hospital
- 6.3.2. Diagnostic Centers
- 6.3.3. Other End-Users
- 6.4. Market Analysis, Insights and Forecast - by Geography
- 6.4.1. China
- 6.4.2. Japan
- 6.4.3. India
- 6.4.4. Australia
- 6.4.5. South Korea
- 6.4.6. Rest of Asia-Pacific
- 6.1. Market Analysis, Insights and Forecast - by Modality
- 7. Japan APAC Medical Imaging Devices Industry Analysis, Insights and Forecast, 2019-2031
- 7.1. Market Analysis, Insights and Forecast - by Modality
- 7.1.1. MRI
- 7.1.1.1. Low and mid field MRI systems (<1.5 T)
- 7.1.1.2. High field MRI systems (1.5-3 T)
- 7.1.1.3. Very Hig
- 7.1.2. Computed Tomography
- 7.1.2.1. Low End Scanners (~16-Slice)
- 7.1.2.2. Mid Range Scanners (~64-Slice)
- 7.1.2.3. High End Scanners (128-Slice and More)
- 7.1.3. Ultrasound
- 7.1.3.1. 2D Ultrasound
- 7.1.3.2. 3D Ultrasound
- 7.1.3.3. Other Types of Ultrasound
- 7.1.4. X-Ray
- 7.1.4.1. Analog Systems
- 7.1.4.2. Digital Systems
- 7.1.5. Nuclear Imaging
- 7.1.5.1. Positron Emission Tomography (PET)
- 7.1.5.2. Single Photon Emission Computed Tomography (SPECT)
- 7.1.6. Fluoroscopy
- 7.1.7. Mammography
- 7.1.1. MRI
- 7.2. Market Analysis, Insights and Forecast - by Application
- 7.2.1. Cardiology
- 7.2.2. Oncology
- 7.2.3. Neurology
- 7.2.4. Orthopedics
- 7.2.5. Gastroenterology
- 7.2.6. Gynecology
- 7.2.7. Other Applications
- 7.3. Market Analysis, Insights and Forecast - by End-User
- 7.3.1. Hospital
- 7.3.2. Diagnostic Centers
- 7.3.3. Other End-Users
- 7.4. Market Analysis, Insights and Forecast - by Geography
- 7.4.1. China
- 7.4.2. Japan
- 7.4.3. India
- 7.4.4. Australia
- 7.4.5. South Korea
- 7.4.6. Rest of Asia-Pacific
- 7.1. Market Analysis, Insights and Forecast - by Modality
- 8. India APAC Medical Imaging Devices Industry Analysis, Insights and Forecast, 2019-2031
- 8.1. Market Analysis, Insights and Forecast - by Modality
- 8.1.1. MRI
- 8.1.1.1. Low and mid field MRI systems (<1.5 T)
- 8.1.1.2. High field MRI systems (1.5-3 T)
- 8.1.1.3. Very Hig
- 8.1.2. Computed Tomography
- 8.1.2.1. Low End Scanners (~16-Slice)
- 8.1.2.2. Mid Range Scanners (~64-Slice)
- 8.1.2.3. High End Scanners (128-Slice and More)
- 8.1.3. Ultrasound
- 8.1.3.1. 2D Ultrasound
- 8.1.3.2. 3D Ultrasound
- 8.1.3.3. Other Types of Ultrasound
- 8.1.4. X-Ray
- 8.1.4.1. Analog Systems
- 8.1.4.2. Digital Systems
- 8.1.5. Nuclear Imaging
- 8.1.5.1. Positron Emission Tomography (PET)
- 8.1.5.2. Single Photon Emission Computed Tomography (SPECT)
- 8.1.6. Fluoroscopy
- 8.1.7. Mammography
- 8.1.1. MRI
- 8.2. Market Analysis, Insights and Forecast - by Application
- 8.2.1. Cardiology
- 8.2.2. Oncology
- 8.2.3. Neurology
- 8.2.4. Orthopedics
- 8.2.5. Gastroenterology
- 8.2.6. Gynecology
- 8.2.7. Other Applications
- 8.3. Market Analysis, Insights and Forecast - by End-User
- 8.3.1. Hospital
- 8.3.2. Diagnostic Centers
- 8.3.3. Other End-Users
- 8.4. Market Analysis, Insights and Forecast - by Geography
- 8.4.1. China
- 8.4.2. Japan
- 8.4.3. India
- 8.4.4. Australia
- 8.4.5. South Korea
- 8.4.6. Rest of Asia-Pacific
- 8.1. Market Analysis, Insights and Forecast - by Modality
- 9. Australia APAC Medical Imaging Devices Industry Analysis, Insights and Forecast, 2019-2031
- 9.1. Market Analysis, Insights and Forecast - by Modality
- 9.1.1. MRI
- 9.1.1.1. Low and mid field MRI systems (<1.5 T)
- 9.1.1.2. High field MRI systems (1.5-3 T)
- 9.1.1.3. Very Hig
- 9.1.2. Computed Tomography
- 9.1.2.1. Low End Scanners (~16-Slice)
- 9.1.2.2. Mid Range Scanners (~64-Slice)
- 9.1.2.3. High End Scanners (128-Slice and More)
- 9.1.3. Ultrasound
- 9.1.3.1. 2D Ultrasound
- 9.1.3.2. 3D Ultrasound
- 9.1.3.3. Other Types of Ultrasound
- 9.1.4. X-Ray
- 9.1.4.1. Analog Systems
- 9.1.4.2. Digital Systems
- 9.1.5. Nuclear Imaging
- 9.1.5.1. Positron Emission Tomography (PET)
- 9.1.5.2. Single Photon Emission Computed Tomography (SPECT)
- 9.1.6. Fluoroscopy
- 9.1.7. Mammography
- 9.1.1. MRI
- 9.2. Market Analysis, Insights and Forecast - by Application
- 9.2.1. Cardiology
- 9.2.2. Oncology
- 9.2.3. Neurology
- 9.2.4. Orthopedics
- 9.2.5. Gastroenterology
- 9.2.6. Gynecology
- 9.2.7. Other Applications
- 9.3. Market Analysis, Insights and Forecast - by End-User
- 9.3.1. Hospital
- 9.3.2. Diagnostic Centers
- 9.3.3. Other End-Users
- 9.4. Market Analysis, Insights and Forecast - by Geography
- 9.4.1. China
- 9.4.2. Japan
- 9.4.3. India
- 9.4.4. Australia
- 9.4.5. South Korea
- 9.4.6. Rest of Asia-Pacific
- 9.1. Market Analysis, Insights and Forecast - by Modality
- 10. South Korea APAC Medical Imaging Devices Industry Analysis, Insights and Forecast, 2019-2031
- 10.1. Market Analysis, Insights and Forecast - by Modality
- 10.1.1. MRI
- 10.1.1.1. Low and mid field MRI systems (<1.5 T)
- 10.1.1.2. High field MRI systems (1.5-3 T)
- 10.1.1.3. Very Hig
- 10.1.2. Computed Tomography
- 10.1.2.1. Low End Scanners (~16-Slice)
- 10.1.2.2. Mid Range Scanners (~64-Slice)
- 10.1.2.3. High End Scanners (128-Slice and More)
- 10.1.3. Ultrasound
- 10.1.3.1. 2D Ultrasound
- 10.1.3.2. 3D Ultrasound
- 10.1.3.3. Other Types of Ultrasound
- 10.1.4. X-Ray
- 10.1.4.1. Analog Systems
- 10.1.4.2. Digital Systems
- 10.1.5. Nuclear Imaging
- 10.1.5.1. Positron Emission Tomography (PET)
- 10.1.5.2. Single Photon Emission Computed Tomography (SPECT)
- 10.1.6. Fluoroscopy
- 10.1.7. Mammography
- 10.1.1. MRI
- 10.2. Market Analysis, Insights and Forecast - by Application
- 10.2.1. Cardiology
- 10.2.2. Oncology
- 10.2.3. Neurology
- 10.2.4. Orthopedics
- 10.2.5. Gastroenterology
- 10.2.6. Gynecology
- 10.2.7. Other Applications
- 10.3. Market Analysis, Insights and Forecast - by End-User
- 10.3.1. Hospital
- 10.3.2. Diagnostic Centers
- 10.3.3. Other End-Users
- 10.4. Market Analysis, Insights and Forecast - by Geography
- 10.4.1. China
- 10.4.2. Japan
- 10.4.3. India
- 10.4.4. Australia
- 10.4.5. South Korea
- 10.4.6. Rest of Asia-Pacific
- 10.1. Market Analysis, Insights and Forecast - by Modality
- 11. Rest of Asia Pacific APAC Medical Imaging Devices Industry Analysis, Insights and Forecast, 2019-2031
- 11.1. Market Analysis, Insights and Forecast - by Modality
- 11.1.1. MRI
- 11.1.1.1. Low and mid field MRI systems (<1.5 T)
- 11.1.1.2. High field MRI systems (1.5-3 T)
- 11.1.1.3. Very Hig
- 11.1.2. Computed Tomography
- 11.1.2.1. Low End Scanners (~16-Slice)
- 11.1.2.2. Mid Range Scanners (~64-Slice)
- 11.1.2.3. High End Scanners (128-Slice and More)
- 11.1.3. Ultrasound
- 11.1.3.1. 2D Ultrasound
- 11.1.3.2. 3D Ultrasound
- 11.1.3.3. Other Types of Ultrasound
- 11.1.4. X-Ray
- 11.1.4.1. Analog Systems
- 11.1.4.2. Digital Systems
- 11.1.5. Nuclear Imaging
- 11.1.5.1. Positron Emission Tomography (PET)
- 11.1.5.2. Single Photon Emission Computed Tomography (SPECT)
- 11.1.6. Fluoroscopy
- 11.1.7. Mammography
- 11.1.1. MRI
- 11.2. Market Analysis, Insights and Forecast - by Application
- 11.2.1. Cardiology
- 11.2.2. Oncology
- 11.2.3. Neurology
- 11.2.4. Orthopedics
- 11.2.5. Gastroenterology
- 11.2.6. Gynecology
- 11.2.7. Other Applications
- 11.3. Market Analysis, Insights and Forecast - by End-User
- 11.3.1. Hospital
- 11.3.2. Diagnostic Centers
- 11.3.3. Other End-Users
- 11.4. Market Analysis, Insights and Forecast - by Geography
- 11.4.1. China
- 11.4.2. Japan
- 11.4.3. India
- 11.4.4. Australia
- 11.4.5. South Korea
- 11.4.6. Rest of Asia-Pacific
- 11.1. Market Analysis, Insights and Forecast - by Modality
- 12. North America APAC Medical Imaging Devices Industry Analysis, Insights and Forecast, 2019-2031
- 12.1. Market Analysis, Insights and Forecast - By Country/Sub-region
- 12.1.1 United States
- 12.1.2 Canada
- 12.1.3 Mexico
- 13. Europe APAC Medical Imaging Devices Industry Analysis, Insights and Forecast, 2019-2031
- 13.1. Market Analysis, Insights and Forecast - By Country/Sub-region
- 13.1.1 Germany
- 13.1.2 United Kingdom
- 13.1.3 France
- 13.1.4 Spain
- 13.1.5 Italy
- 13.1.6 Spain
- 13.1.7 Belgium
- 13.1.8 Netherland
- 13.1.9 Nordics
- 13.1.10 Rest of Europe
- 14. Asia Pacific APAC Medical Imaging Devices Industry Analysis, Insights and Forecast, 2019-2031
- 14.1. Market Analysis, Insights and Forecast - By Country/Sub-region
- 14.1.1 China
- 14.1.2 Japan
- 14.1.3 India
- 14.1.4 South Korea
- 14.1.5 Southeast Asia
- 14.1.6 Australia
- 14.1.7 Indonesia
- 14.1.8 Phillipes
- 14.1.9 Singapore
- 14.1.10 Thailandc
- 14.1.11 Rest of Asia Pacific
- 15. South America APAC Medical Imaging Devices Industry Analysis, Insights and Forecast, 2019-2031
- 15.1. Market Analysis, Insights and Forecast - By Country/Sub-region
- 15.1.1 Brazil
- 15.1.2 Argentina
- 15.1.3 Peru
- 15.1.4 Chile
- 15.1.5 Colombia
- 15.1.6 Ecuador
- 15.1.7 Venezuela
- 15.1.8 Rest of South America
- 16. North America APAC Medical Imaging Devices Industry Analysis, Insights and Forecast, 2019-2031
- 16.1. Market Analysis, Insights and Forecast - By Country/Sub-region
- 16.1.1 United States
- 16.1.2 Canada
- 16.1.3 Mexico
- 17. MEA APAC Medical Imaging Devices Industry Analysis, Insights and Forecast, 2019-2031
- 17.1. Market Analysis, Insights and Forecast - By Country/Sub-region
- 17.1.1 United Arab Emirates
- 17.1.2 Saudi Arabia
- 17.1.3 South Africa
- 17.1.4 Rest of Middle East and Africa
- 18. Competitive Analysis
- 18.1. Global Market Share Analysis 2024
- 18.2. Company Profiles
- 18.2.1 Esaote SpA
- 18.2.1.1. Overview
- 18.2.1.2. Products
- 18.2.1.3. SWOT Analysis
- 18.2.1.4. Recent Developments
- 18.2.1.5. Financials (Based on Availability)
- 18.2.2 Hologic Inc
- 18.2.2.1. Overview
- 18.2.2.2. Products
- 18.2.2.3. SWOT Analysis
- 18.2.2.4. Recent Developments
- 18.2.2.5. Financials (Based on Availability)
- 18.2.3 GE Healthcare
- 18.2.3.1. Overview
- 18.2.3.2. Products
- 18.2.3.3. SWOT Analysis
- 18.2.3.4. Recent Developments
- 18.2.3.5. Financials (Based on Availability)
- 18.2.4 Shanghai United Imaging Healthcare Co Ltd
- 18.2.4.1. Overview
- 18.2.4.2. Products
- 18.2.4.3. SWOT Analysis
- 18.2.4.4. Recent Developments
- 18.2.4.5. Financials (Based on Availability)
- 18.2.5 Koninklijke Philips N V
- 18.2.5.1. Overview
- 18.2.5.2. Products
- 18.2.5.3. SWOT Analysis
- 18.2.5.4. Recent Developments
- 18.2.5.5. Financials (Based on Availability)
- 18.2.6 Siemens AG
- 18.2.6.1. Overview
- 18.2.6.2. Products
- 18.2.6.3. SWOT Analysis
- 18.2.6.4. Recent Developments
- 18.2.6.5. Financials (Based on Availability)
- 18.2.7 FUJIFILM Holdings Corporation
- 18.2.7.1. Overview
- 18.2.7.2. Products
- 18.2.7.3. SWOT Analysis
- 18.2.7.4. Recent Developments
- 18.2.7.5. Financials (Based on Availability)
- 18.2.8 Carestream Health
- 18.2.8.1. Overview
- 18.2.8.2. Products
- 18.2.8.3. SWOT Analysis
- 18.2.8.4. Recent Developments
- 18.2.8.5. Financials (Based on Availability)
- 18.2.9 J Morita Corporation
- 18.2.9.1. Overview
- 18.2.9.2. Products
- 18.2.9.3. SWOT Analysis
- 18.2.9.4. Recent Developments
- 18.2.9.5. Financials (Based on Availability)
- 18.2.10 Canon Medical Systems Corporation
- 18.2.10.1. Overview
- 18.2.10.2. Products
- 18.2.10.3. SWOT Analysis
- 18.2.10.4. Recent Developments
- 18.2.10.5. Financials (Based on Availability)
- 18.2.11 Teknova Medical Systems Limited
- 18.2.11.1. Overview
- 18.2.11.2. Products
- 18.2.11.3. SWOT Analysis
- 18.2.11.4. Recent Developments
- 18.2.11.5. Financials (Based on Availability)
- 18.2.12 Shimadzu Corporation
- 18.2.12.1. Overview
- 18.2.12.2. Products
- 18.2.12.3. SWOT Analysis
- 18.2.12.4. Recent Developments
- 18.2.12.5. Financials (Based on Availability)
- 18.2.1 Esaote SpA
List of Figures
- Figure 1: Global APAC Medical Imaging Devices Industry Revenue Breakdown (Million, %) by Region 2024 & 2032
- Figure 2: Global APAC Medical Imaging Devices Industry Volume Breakdown (K Unit, %) by Region 2024 & 2032
- Figure 3: North America APAC Medical Imaging Devices Industry Revenue (Million), by Country 2024 & 2032
- Figure 4: North America APAC Medical Imaging Devices Industry Volume (K Unit), by Country 2024 & 2032
- Figure 5: North America APAC Medical Imaging Devices Industry Revenue Share (%), by Country 2024 & 2032
- Figure 6: North America APAC Medical Imaging Devices Industry Volume Share (%), by Country 2024 & 2032
- Figure 7: Europe APAC Medical Imaging Devices Industry Revenue (Million), by Country 2024 & 2032
- Figure 8: Europe APAC Medical Imaging Devices Industry Volume (K Unit), by Country 2024 & 2032
- Figure 9: Europe APAC Medical Imaging Devices Industry Revenue Share (%), by Country 2024 & 2032
- Figure 10: Europe APAC Medical Imaging Devices Industry Volume Share (%), by Country 2024 & 2032
- Figure 11: Asia Pacific APAC Medical Imaging Devices Industry Revenue (Million), by Country 2024 & 2032
- Figure 12: Asia Pacific APAC Medical Imaging Devices Industry Volume (K Unit), by Country 2024 & 2032
- Figure 13: Asia Pacific APAC Medical Imaging Devices Industry Revenue Share (%), by Country 2024 & 2032
- Figure 14: Asia Pacific APAC Medical Imaging Devices Industry Volume Share (%), by Country 2024 & 2032
- Figure 15: South America APAC Medical Imaging Devices Industry Revenue (Million), by Country 2024 & 2032
- Figure 16: South America APAC Medical Imaging Devices Industry Volume (K Unit), by Country 2024 & 2032
- Figure 17: South America APAC Medical Imaging Devices Industry Revenue Share (%), by Country 2024 & 2032
- Figure 18: South America APAC Medical Imaging Devices Industry Volume Share (%), by Country 2024 & 2032
- Figure 19: North America APAC Medical Imaging Devices Industry Revenue (Million), by Country 2024 & 2032
- Figure 20: North America APAC Medical Imaging Devices Industry Volume (K Unit), by Country 2024 & 2032
- Figure 21: North America APAC Medical Imaging Devices Industry Revenue Share (%), by Country 2024 & 2032
- Figure 22: North America APAC Medical Imaging Devices Industry Volume Share (%), by Country 2024 & 2032
- Figure 23: MEA APAC Medical Imaging Devices Industry Revenue (Million), by Country 2024 & 2032
- Figure 24: MEA APAC Medical Imaging Devices Industry Volume (K Unit), by Country 2024 & 2032
- Figure 25: MEA APAC Medical Imaging Devices Industry Revenue Share (%), by Country 2024 & 2032
- Figure 26: MEA APAC Medical Imaging Devices Industry Volume Share (%), by Country 2024 & 2032
- Figure 27: China APAC Medical Imaging Devices Industry Revenue (Million), by Modality 2024 & 2032
- Figure 28: China APAC Medical Imaging Devices Industry Volume (K Unit), by Modality 2024 & 2032
- Figure 29: China APAC Medical Imaging Devices Industry Revenue Share (%), by Modality 2024 & 2032
- Figure 30: China APAC Medical Imaging Devices Industry Volume Share (%), by Modality 2024 & 2032
- Figure 31: China APAC Medical Imaging Devices Industry Revenue (Million), by Application 2024 & 2032
- Figure 32: China APAC Medical Imaging Devices Industry Volume (K Unit), by Application 2024 & 2032
- Figure 33: China APAC Medical Imaging Devices Industry Revenue Share (%), by Application 2024 & 2032
- Figure 34: China APAC Medical Imaging Devices Industry Volume Share (%), by Application 2024 & 2032
- Figure 35: China APAC Medical Imaging Devices Industry Revenue (Million), by End-User 2024 & 2032
- Figure 36: China APAC Medical Imaging Devices Industry Volume (K Unit), by End-User 2024 & 2032
- Figure 37: China APAC Medical Imaging Devices Industry Revenue Share (%), by End-User 2024 & 2032
- Figure 38: China APAC Medical Imaging Devices Industry Volume Share (%), by End-User 2024 & 2032
- Figure 39: China APAC Medical Imaging Devices Industry Revenue (Million), by Geography 2024 & 2032
- Figure 40: China APAC Medical Imaging Devices Industry Volume (K Unit), by Geography 2024 & 2032
- Figure 41: China APAC Medical Imaging Devices Industry Revenue Share (%), by Geography 2024 & 2032
- Figure 42: China APAC Medical Imaging Devices Industry Volume Share (%), by Geography 2024 & 2032
- Figure 43: China APAC Medical Imaging Devices Industry Revenue (Million), by Country 2024 & 2032
- Figure 44: China APAC Medical Imaging Devices Industry Volume (K Unit), by Country 2024 & 2032
- Figure 45: China APAC Medical Imaging Devices Industry Revenue Share (%), by Country 2024 & 2032
- Figure 46: China APAC Medical Imaging Devices Industry Volume Share (%), by Country 2024 & 2032
- Figure 47: Japan APAC Medical Imaging Devices Industry Revenue (Million), by Modality 2024 & 2032
- Figure 48: Japan APAC Medical Imaging Devices Industry Volume (K Unit), by Modality 2024 & 2032
- Figure 49: Japan APAC Medical Imaging Devices Industry Revenue Share (%), by Modality 2024 & 2032
- Figure 50: Japan APAC Medical Imaging Devices Industry Volume Share (%), by Modality 2024 & 2032
- Figure 51: Japan APAC Medical Imaging Devices Industry Revenue (Million), by Application 2024 & 2032
- Figure 52: Japan APAC Medical Imaging Devices Industry Volume (K Unit), by Application 2024 & 2032
- Figure 53: Japan APAC Medical Imaging Devices Industry Revenue Share (%), by Application 2024 & 2032
- Figure 54: Japan APAC Medical Imaging Devices Industry Volume Share (%), by Application 2024 & 2032
- Figure 55: Japan APAC Medical Imaging Devices Industry Revenue (Million), by End-User 2024 & 2032
- Figure 56: Japan APAC Medical Imaging Devices Industry Volume (K Unit), by End-User 2024 & 2032
- Figure 57: Japan APAC Medical Imaging Devices Industry Revenue Share (%), by End-User 2024 & 2032
- Figure 58: Japan APAC Medical Imaging Devices Industry Volume Share (%), by End-User 2024 & 2032
- Figure 59: Japan APAC Medical Imaging Devices Industry Revenue (Million), by Geography 2024 & 2032
- Figure 60: Japan APAC Medical Imaging Devices Industry Volume (K Unit), by Geography 2024 & 2032
- Figure 61: Japan APAC Medical Imaging Devices Industry Revenue Share (%), by Geography 2024 & 2032
- Figure 62: Japan APAC Medical Imaging Devices Industry Volume Share (%), by Geography 2024 & 2032
- Figure 63: Japan APAC Medical Imaging Devices Industry Revenue (Million), by Country 2024 & 2032
- Figure 64: Japan APAC Medical Imaging Devices Industry Volume (K Unit), by Country 2024 & 2032
- Figure 65: Japan APAC Medical Imaging Devices Industry Revenue Share (%), by Country 2024 & 2032
- Figure 66: Japan APAC Medical Imaging Devices Industry Volume Share (%), by Country 2024 & 2032
- Figure 67: India APAC Medical Imaging Devices Industry Revenue (Million), by Modality 2024 & 2032
- Figure 68: India APAC Medical Imaging Devices Industry Volume (K Unit), by Modality 2024 & 2032
- Figure 69: India APAC Medical Imaging Devices Industry Revenue Share (%), by Modality 2024 & 2032
- Figure 70: India APAC Medical Imaging Devices Industry Volume Share (%), by Modality 2024 & 2032
- Figure 71: India APAC Medical Imaging Devices Industry Revenue (Million), by Application 2024 & 2032
- Figure 72: India APAC Medical Imaging Devices Industry Volume (K Unit), by Application 2024 & 2032
- Figure 73: India APAC Medical Imaging Devices Industry Revenue Share (%), by Application 2024 & 2032
- Figure 74: India APAC Medical Imaging Devices Industry Volume Share (%), by Application 2024 & 2032
- Figure 75: India APAC Medical Imaging Devices Industry Revenue (Million), by End-User 2024 & 2032
- Figure 76: India APAC Medical Imaging Devices Industry Volume (K Unit), by End-User 2024 & 2032
- Figure 77: India APAC Medical Imaging Devices Industry Revenue Share (%), by End-User 2024 & 2032
- Figure 78: India APAC Medical Imaging Devices Industry Volume Share (%), by End-User 2024 & 2032
- Figure 79: India APAC Medical Imaging Devices Industry Revenue (Million), by Geography 2024 & 2032
- Figure 80: India APAC Medical Imaging Devices Industry Volume (K Unit), by Geography 2024 & 2032
- Figure 81: India APAC Medical Imaging Devices Industry Revenue Share (%), by Geography 2024 & 2032
- Figure 82: India APAC Medical Imaging Devices Industry Volume Share (%), by Geography 2024 & 2032
- Figure 83: India APAC Medical Imaging Devices Industry Revenue (Million), by Country 2024 & 2032
- Figure 84: India APAC Medical Imaging Devices Industry Volume (K Unit), by Country 2024 & 2032
- Figure 85: India APAC Medical Imaging Devices Industry Revenue Share (%), by Country 2024 & 2032
- Figure 86: India APAC Medical Imaging Devices Industry Volume Share (%), by Country 2024 & 2032
- Figure 87: Australia APAC Medical Imaging Devices Industry Revenue (Million), by Modality 2024 & 2032
- Figure 88: Australia APAC Medical Imaging Devices Industry Volume (K Unit), by Modality 2024 & 2032
- Figure 89: Australia APAC Medical Imaging Devices Industry Revenue Share (%), by Modality 2024 & 2032
- Figure 90: Australia APAC Medical Imaging Devices Industry Volume Share (%), by Modality 2024 & 2032
- Figure 91: Australia APAC Medical Imaging Devices Industry Revenue (Million), by Application 2024 & 2032
- Figure 92: Australia APAC Medical Imaging Devices Industry Volume (K Unit), by Application 2024 & 2032
- Figure 93: Australia APAC Medical Imaging Devices Industry Revenue Share (%), by Application 2024 & 2032
- Figure 94: Australia APAC Medical Imaging Devices Industry Volume Share (%), by Application 2024 & 2032
- Figure 95: Australia APAC Medical Imaging Devices Industry Revenue (Million), by End-User 2024 & 2032
- Figure 96: Australia APAC Medical Imaging Devices Industry Volume (K Unit), by End-User 2024 & 2032
- Figure 97: Australia APAC Medical Imaging Devices Industry Revenue Share (%), by End-User 2024 & 2032
- Figure 98: Australia APAC Medical Imaging Devices Industry Volume Share (%), by End-User 2024 & 2032
- Figure 99: Australia APAC Medical Imaging Devices Industry Revenue (Million), by Geography 2024 & 2032
- Figure 100: Australia APAC Medical Imaging Devices Industry Volume (K Unit), by Geography 2024 & 2032
- Figure 101: Australia APAC Medical Imaging Devices Industry Revenue Share (%), by Geography 2024 & 2032
- Figure 102: Australia APAC Medical Imaging Devices Industry Volume Share (%), by Geography 2024 & 2032
- Figure 103: Australia APAC Medical Imaging Devices Industry Revenue (Million), by Country 2024 & 2032
- Figure 104: Australia APAC Medical Imaging Devices Industry Volume (K Unit), by Country 2024 & 2032
- Figure 105: Australia APAC Medical Imaging Devices Industry Revenue Share (%), by Country 2024 & 2032
- Figure 106: Australia APAC Medical Imaging Devices Industry Volume Share (%), by Country 2024 & 2032
- Figure 107: South Korea APAC Medical Imaging Devices Industry Revenue (Million), by Modality 2024 & 2032
- Figure 108: South Korea APAC Medical Imaging Devices Industry Volume (K Unit), by Modality 2024 & 2032
- Figure 109: South Korea APAC Medical Imaging Devices Industry Revenue Share (%), by Modality 2024 & 2032
- Figure 110: South Korea APAC Medical Imaging Devices Industry Volume Share (%), by Modality 2024 & 2032
- Figure 111: South Korea APAC Medical Imaging Devices Industry Revenue (Million), by Application 2024 & 2032
- Figure 112: South Korea APAC Medical Imaging Devices Industry Volume (K Unit), by Application 2024 & 2032
- Figure 113: South Korea APAC Medical Imaging Devices Industry Revenue Share (%), by Application 2024 & 2032
- Figure 114: South Korea APAC Medical Imaging Devices Industry Volume Share (%), by Application 2024 & 2032
- Figure 115: South Korea APAC Medical Imaging Devices Industry Revenue (Million), by End-User 2024 & 2032
- Figure 116: South Korea APAC Medical Imaging Devices Industry Volume (K Unit), by End-User 2024 & 2032
- Figure 117: South Korea APAC Medical Imaging Devices Industry Revenue Share (%), by End-User 2024 & 2032
- Figure 118: South Korea APAC Medical Imaging Devices Industry Volume Share (%), by End-User 2024 & 2032
- Figure 119: South Korea APAC Medical Imaging Devices Industry Revenue (Million), by Geography 2024 & 2032
- Figure 120: South Korea APAC Medical Imaging Devices Industry Volume (K Unit), by Geography 2024 & 2032
- Figure 121: South Korea APAC Medical Imaging Devices Industry Revenue Share (%), by Geography 2024 & 2032
- Figure 122: South Korea APAC Medical Imaging Devices Industry Volume Share (%), by Geography 2024 & 2032
- Figure 123: South Korea APAC Medical Imaging Devices Industry Revenue (Million), by Country 2024 & 2032
- Figure 124: South Korea APAC Medical Imaging Devices Industry Volume (K Unit), by Country 2024 & 2032
- Figure 125: South Korea APAC Medical Imaging Devices Industry Revenue Share (%), by Country 2024 & 2032
- Figure 126: South Korea APAC Medical Imaging Devices Industry Volume Share (%), by Country 2024 & 2032
- Figure 127: Rest of Asia Pacific APAC Medical Imaging Devices Industry Revenue (Million), by Modality 2024 & 2032
- Figure 128: Rest of Asia Pacific APAC Medical Imaging Devices Industry Volume (K Unit), by Modality 2024 & 2032
- Figure 129: Rest of Asia Pacific APAC Medical Imaging Devices Industry Revenue Share (%), by Modality 2024 & 2032
- Figure 130: Rest of Asia Pacific APAC Medical Imaging Devices Industry Volume Share (%), by Modality 2024 & 2032
- Figure 131: Rest of Asia Pacific APAC Medical Imaging Devices Industry Revenue (Million), by Application 2024 & 2032
- Figure 132: Rest of Asia Pacific APAC Medical Imaging Devices Industry Volume (K Unit), by Application 2024 & 2032
- Figure 133: Rest of Asia Pacific APAC Medical Imaging Devices Industry Revenue Share (%), by Application 2024 & 2032
- Figure 134: Rest of Asia Pacific APAC Medical Imaging Devices Industry Volume Share (%), by Application 2024 & 2032
- Figure 135: Rest of Asia Pacific APAC Medical Imaging Devices Industry Revenue (Million), by End-User 2024 & 2032
- Figure 136: Rest of Asia Pacific APAC Medical Imaging Devices Industry Volume (K Unit), by End-User 2024 & 2032
- Figure 137: Rest of Asia Pacific APAC Medical Imaging Devices Industry Revenue Share (%), by End-User 2024 & 2032
- Figure 138: Rest of Asia Pacific APAC Medical Imaging Devices Industry Volume Share (%), by End-User 2024 & 2032
- Figure 139: Rest of Asia Pacific APAC Medical Imaging Devices Industry Revenue (Million), by Geography 2024 & 2032
- Figure 140: Rest of Asia Pacific APAC Medical Imaging Devices Industry Volume (K Unit), by Geography 2024 & 2032
- Figure 141: Rest of Asia Pacific APAC Medical Imaging Devices Industry Revenue Share (%), by Geography 2024 & 2032
- Figure 142: Rest of Asia Pacific APAC Medical Imaging Devices Industry Volume Share (%), by Geography 2024 & 2032
- Figure 143: Rest of Asia Pacific APAC Medical Imaging Devices Industry Revenue (Million), by Country 2024 & 2032
- Figure 144: Rest of Asia Pacific APAC Medical Imaging Devices Industry Volume (K Unit), by Country 2024 & 2032
- Figure 145: Rest of Asia Pacific APAC Medical Imaging Devices Industry Revenue Share (%), by Country 2024 & 2032
- Figure 146: Rest of Asia Pacific APAC Medical Imaging Devices Industry Volume Share (%), by Country 2024 & 2032
List of Tables
- Table 1: Global APAC Medical Imaging Devices Industry Revenue Million Forecast, by Region 2019 & 2032
- Table 2: Global APAC Medical Imaging Devices Industry Volume K Unit Forecast, by Region 2019 & 2032
- Table 3: Global APAC Medical Imaging Devices Industry Revenue Million Forecast, by Modality 2019 & 2032
- Table 4: Global APAC Medical Imaging Devices Industry Volume K Unit Forecast, by Modality 2019 & 2032
- Table 5: Global APAC Medical Imaging Devices Industry Revenue Million Forecast, by Application 2019 & 2032
- Table 6: Global APAC Medical Imaging Devices Industry Volume K Unit Forecast, by Application 2019 & 2032
- Table 7: Global APAC Medical Imaging Devices Industry Revenue Million Forecast, by End-User 2019 & 2032
- Table 8: Global APAC Medical Imaging Devices Industry Volume K Unit Forecast, by End-User 2019 & 2032
- Table 9: Global APAC Medical Imaging Devices Industry Revenue Million Forecast, by Geography 2019 & 2032
- Table 10: Global APAC Medical Imaging Devices Industry Volume K Unit Forecast, by Geography 2019 & 2032
- Table 11: Global APAC Medical Imaging Devices Industry Revenue Million Forecast, by Region 2019 & 2032
- Table 12: Global APAC Medical Imaging Devices Industry Volume K Unit Forecast, by Region 2019 & 2032
- Table 13: Global APAC Medical Imaging Devices Industry Revenue Million Forecast, by Country 2019 & 2032
- Table 14: Global APAC Medical Imaging Devices Industry Volume K Unit Forecast, by Country 2019 & 2032
- Table 15: United States APAC Medical Imaging Devices Industry Revenue (Million) Forecast, by Application 2019 & 2032
- Table 16: United States APAC Medical Imaging Devices Industry Volume (K Unit) Forecast, by Application 2019 & 2032
- Table 17: Canada APAC Medical Imaging Devices Industry Revenue (Million) Forecast, by Application 2019 & 2032
- Table 18: Canada APAC Medical Imaging Devices Industry Volume (K Unit) Forecast, by Application 2019 & 2032
- Table 19: Mexico APAC Medical Imaging Devices Industry Revenue (Million) Forecast, by Application 2019 & 2032
- Table 20: Mexico APAC Medical Imaging Devices Industry Volume (K Unit) Forecast, by Application 2019 & 2032
- Table 21: Global APAC Medical Imaging Devices Industry Revenue Million Forecast, by Country 2019 & 2032
- Table 22: Global APAC Medical Imaging Devices Industry Volume K Unit Forecast, by Country 2019 & 2032
- Table 23: Germany APAC Medical Imaging Devices Industry Revenue (Million) Forecast, by Application 2019 & 2032
- Table 24: Germany APAC Medical Imaging Devices Industry Volume (K Unit) Forecast, by Application 2019 & 2032
- Table 25: United Kingdom APAC Medical Imaging Devices Industry Revenue (Million) Forecast, by Application 2019 & 2032
- Table 26: United Kingdom APAC Medical Imaging Devices Industry Volume (K Unit) Forecast, by Application 2019 & 2032
- Table 27: France APAC Medical Imaging Devices Industry Revenue (Million) Forecast, by Application 2019 & 2032
- Table 28: France APAC Medical Imaging Devices Industry Volume (K Unit) Forecast, by Application 2019 & 2032
- Table 29: Spain APAC Medical Imaging Devices Industry Revenue (Million) Forecast, by Application 2019 & 2032
- Table 30: Spain APAC Medical Imaging Devices Industry Volume (K Unit) Forecast, by Application 2019 & 2032
- Table 31: Italy APAC Medical Imaging Devices Industry Revenue (Million) Forecast, by Application 2019 & 2032
- Table 32: Italy APAC Medical Imaging Devices Industry Volume (K Unit) Forecast, by Application 2019 & 2032
- Table 33: Spain APAC Medical Imaging Devices Industry Revenue (Million) Forecast, by Application 2019 & 2032
- Table 34: Spain APAC Medical Imaging Devices Industry Volume (K Unit) Forecast, by Application 2019 & 2032
- Table 35: Belgium APAC Medical Imaging Devices Industry Revenue (Million) Forecast, by Application 2019 & 2032
- Table 36: Belgium APAC Medical Imaging Devices Industry Volume (K Unit) Forecast, by Application 2019 & 2032
- Table 37: Netherland APAC Medical Imaging Devices Industry Revenue (Million) Forecast, by Application 2019 & 2032
- Table 38: Netherland APAC Medical Imaging Devices Industry Volume (K Unit) Forecast, by Application 2019 & 2032
- Table 39: Nordics APAC Medical Imaging Devices Industry Revenue (Million) Forecast, by Application 2019 & 2032
- Table 40: Nordics APAC Medical Imaging Devices Industry Volume (K Unit) Forecast, by Application 2019 & 2032
- Table 41: Rest of Europe APAC Medical Imaging Devices Industry Revenue (Million) Forecast, by Application 2019 & 2032
- Table 42: Rest of Europe APAC Medical Imaging Devices Industry Volume (K Unit) Forecast, by Application 2019 & 2032
- Table 43: Global APAC Medical Imaging Devices Industry Revenue Million Forecast, by Country 2019 & 2032
- Table 44: Global APAC Medical Imaging Devices Industry Volume K Unit Forecast, by Country 2019 & 2032
- Table 45: China APAC Medical Imaging Devices Industry Revenue (Million) Forecast, by Application 2019 & 2032
- Table 46: China APAC Medical Imaging Devices Industry Volume (K Unit) Forecast, by Application 2019 & 2032
- Table 47: Japan APAC Medical Imaging Devices Industry Revenue (Million) Forecast, by Application 2019 & 2032
- Table 48: Japan APAC Medical Imaging Devices Industry Volume (K Unit) Forecast, by Application 2019 & 2032
- Table 49: India APAC Medical Imaging Devices Industry Revenue (Million) Forecast, by Application 2019 & 2032
- Table 50: India APAC Medical Imaging Devices Industry Volume (K Unit) Forecast, by Application 2019 & 2032
- Table 51: South Korea APAC Medical Imaging Devices Industry Revenue (Million) Forecast, by Application 2019 & 2032
- Table 52: South Korea APAC Medical Imaging Devices Industry Volume (K Unit) Forecast, by Application 2019 & 2032
- Table 53: Southeast Asia APAC Medical Imaging Devices Industry Revenue (Million) Forecast, by Application 2019 & 2032
- Table 54: Southeast Asia APAC Medical Imaging Devices Industry Volume (K Unit) Forecast, by Application 2019 & 2032
- Table 55: Australia APAC Medical Imaging Devices Industry Revenue (Million) Forecast, by Application 2019 & 2032
- Table 56: Australia APAC Medical Imaging Devices Industry Volume (K Unit) Forecast, by Application 2019 & 2032
- Table 57: Indonesia APAC Medical Imaging Devices Industry Revenue (Million) Forecast, by Application 2019 & 2032
- Table 58: Indonesia APAC Medical Imaging Devices Industry Volume (K Unit) Forecast, by Application 2019 & 2032
- Table 59: Phillipes APAC Medical Imaging Devices Industry Revenue (Million) Forecast, by Application 2019 & 2032
- Table 60: Phillipes APAC Medical Imaging Devices Industry Volume (K Unit) Forecast, by Application 2019 & 2032
- Table 61: Singapore APAC Medical Imaging Devices Industry Revenue (Million) Forecast, by Application 2019 & 2032
- Table 62: Singapore APAC Medical Imaging Devices Industry Volume (K Unit) Forecast, by Application 2019 & 2032
- Table 63: Thailandc APAC Medical Imaging Devices Industry Revenue (Million) Forecast, by Application 2019 & 2032
- Table 64: Thailandc APAC Medical Imaging Devices Industry Volume (K Unit) Forecast, by Application 2019 & 2032
- Table 65: Rest of Asia Pacific APAC Medical Imaging Devices Industry Revenue (Million) Forecast, by Application 2019 & 2032
- Table 66: Rest of Asia Pacific APAC Medical Imaging Devices Industry Volume (K Unit) Forecast, by Application 2019 & 2032
- Table 67: Global APAC Medical Imaging Devices Industry Revenue Million Forecast, by Country 2019 & 2032
- Table 68: Global APAC Medical Imaging Devices Industry Volume K Unit Forecast, by Country 2019 & 2032
- Table 69: Brazil APAC Medical Imaging Devices Industry Revenue (Million) Forecast, by Application 2019 & 2032
- Table 70: Brazil APAC Medical Imaging Devices Industry Volume (K Unit) Forecast, by Application 2019 & 2032
- Table 71: Argentina APAC Medical Imaging Devices Industry Revenue (Million) Forecast, by Application 2019 & 2032
- Table 72: Argentina APAC Medical Imaging Devices Industry Volume (K Unit) Forecast, by Application 2019 & 2032
- Table 73: Peru APAC Medical Imaging Devices Industry Revenue (Million) Forecast, by Application 2019 & 2032
- Table 74: Peru APAC Medical Imaging Devices Industry Volume (K Unit) Forecast, by Application 2019 & 2032
- Table 75: Chile APAC Medical Imaging Devices Industry Revenue (Million) Forecast, by Application 2019 & 2032
- Table 76: Chile APAC Medical Imaging Devices Industry Volume (K Unit) Forecast, by Application 2019 & 2032
- Table 77: Colombia APAC Medical Imaging Devices Industry Revenue (Million) Forecast, by Application 2019 & 2032
- Table 78: Colombia APAC Medical Imaging Devices Industry Volume (K Unit) Forecast, by Application 2019 & 2032
- Table 79: Ecuador APAC Medical Imaging Devices Industry Revenue (Million) Forecast, by Application 2019 & 2032
- Table 80: Ecuador APAC Medical Imaging Devices Industry Volume (K Unit) Forecast, by Application 2019 & 2032
- Table 81: Venezuela APAC Medical Imaging Devices Industry Revenue (Million) Forecast, by Application 2019 & 2032
- Table 82: Venezuela APAC Medical Imaging Devices Industry Volume (K Unit) Forecast, by Application 2019 & 2032
- Table 83: Rest of South America APAC Medical Imaging Devices Industry Revenue (Million) Forecast, by Application 2019 & 2032
- Table 84: Rest of South America APAC Medical Imaging Devices Industry Volume (K Unit) Forecast, by Application 2019 & 2032
- Table 85: Global APAC Medical Imaging Devices Industry Revenue Million Forecast, by Country 2019 & 2032
- Table 86: Global APAC Medical Imaging Devices Industry Volume K Unit Forecast, by Country 2019 & 2032
- Table 87: United States APAC Medical Imaging Devices Industry Revenue (Million) Forecast, by Application 2019 & 2032
- Table 88: United States APAC Medical Imaging Devices Industry Volume (K Unit) Forecast, by Application 2019 & 2032
- Table 89: Canada APAC Medical Imaging Devices Industry Revenue (Million) Forecast, by Application 2019 & 2032
- Table 90: Canada APAC Medical Imaging Devices Industry Volume (K Unit) Forecast, by Application 2019 & 2032
- Table 91: Mexico APAC Medical Imaging Devices Industry Revenue (Million) Forecast, by Application 2019 & 2032
- Table 92: Mexico APAC Medical Imaging Devices Industry Volume (K Unit) Forecast, by Application 2019 & 2032
- Table 93: Global APAC Medical Imaging Devices Industry Revenue Million Forecast, by Country 2019 & 2032
- Table 94: Global APAC Medical Imaging Devices Industry Volume K Unit Forecast, by Country 2019 & 2032
- Table 95: United Arab Emirates APAC Medical Imaging Devices Industry Revenue (Million) Forecast, by Application 2019 & 2032
- Table 96: United Arab Emirates APAC Medical Imaging Devices Industry Volume (K Unit) Forecast, by Application 2019 & 2032
- Table 97: Saudi Arabia APAC Medical Imaging Devices Industry Revenue (Million) Forecast, by Application 2019 & 2032
- Table 98: Saudi Arabia APAC Medical Imaging Devices Industry Volume (K Unit) Forecast, by Application 2019 & 2032
- Table 99: South Africa APAC Medical Imaging Devices Industry Revenue (Million) Forecast, by Application 2019 & 2032
- Table 100: South Africa APAC Medical Imaging Devices Industry Volume (K Unit) Forecast, by Application 2019 & 2032
- Table 101: Rest of Middle East and Africa APAC Medical Imaging Devices Industry Revenue (Million) Forecast, by Application 2019 & 2032
- Table 102: Rest of Middle East and Africa APAC Medical Imaging Devices Industry Volume (K Unit) Forecast, by Application 2019 & 2032
- Table 103: Global APAC Medical Imaging Devices Industry Revenue Million Forecast, by Modality 2019 & 2032
- Table 104: Global APAC Medical Imaging Devices Industry Volume K Unit Forecast, by Modality 2019 & 2032
- Table 105: Global APAC Medical Imaging Devices Industry Revenue Million Forecast, by Application 2019 & 2032
- Table 106: Global APAC Medical Imaging Devices Industry Volume K Unit Forecast, by Application 2019 & 2032
- Table 107: Global APAC Medical Imaging Devices Industry Revenue Million Forecast, by End-User 2019 & 2032
- Table 108: Global APAC Medical Imaging Devices Industry Volume K Unit Forecast, by End-User 2019 & 2032
- Table 109: Global APAC Medical Imaging Devices Industry Revenue Million Forecast, by Geography 2019 & 2032
- Table 110: Global APAC Medical Imaging Devices Industry Volume K Unit Forecast, by Geography 2019 & 2032
- Table 111: Global APAC Medical Imaging Devices Industry Revenue Million Forecast, by Country 2019 & 2032
- Table 112: Global APAC Medical Imaging Devices Industry Volume K Unit Forecast, by Country 2019 & 2032
- Table 113: Global APAC Medical Imaging Devices Industry Revenue Million Forecast, by Modality 2019 & 2032
- Table 114: Global APAC Medical Imaging Devices Industry Volume K Unit Forecast, by Modality 2019 & 2032
- Table 115: Global APAC Medical Imaging Devices Industry Revenue Million Forecast, by Application 2019 & 2032
- Table 116: Global APAC Medical Imaging Devices Industry Volume K Unit Forecast, by Application 2019 & 2032
- Table 117: Global APAC Medical Imaging Devices Industry Revenue Million Forecast, by End-User 2019 & 2032
- Table 118: Global APAC Medical Imaging Devices Industry Volume K Unit Forecast, by End-User 2019 & 2032
- Table 119: Global APAC Medical Imaging Devices Industry Revenue Million Forecast, by Geography 2019 & 2032
- Table 120: Global APAC Medical Imaging Devices Industry Volume K Unit Forecast, by Geography 2019 & 2032
- Table 121: Global APAC Medical Imaging Devices Industry Revenue Million Forecast, by Country 2019 & 2032
- Table 122: Global APAC Medical Imaging Devices Industry Volume K Unit Forecast, by Country 2019 & 2032
- Table 123: Global APAC Medical Imaging Devices Industry Revenue Million Forecast, by Modality 2019 & 2032
- Table 124: Global APAC Medical Imaging Devices Industry Volume K Unit Forecast, by Modality 2019 & 2032
- Table 125: Global APAC Medical Imaging Devices Industry Revenue Million Forecast, by Application 2019 & 2032
- Table 126: Global APAC Medical Imaging Devices Industry Volume K Unit Forecast, by Application 2019 & 2032
- Table 127: Global APAC Medical Imaging Devices Industry Revenue Million Forecast, by End-User 2019 & 2032
- Table 128: Global APAC Medical Imaging Devices Industry Volume K Unit Forecast, by End-User 2019 & 2032
- Table 129: Global APAC Medical Imaging Devices Industry Revenue Million Forecast, by Geography 2019 & 2032
- Table 130: Global APAC Medical Imaging Devices Industry Volume K Unit Forecast, by Geography 2019 & 2032
- Table 131: Global APAC Medical Imaging Devices Industry Revenue Million Forecast, by Country 2019 & 2032
- Table 132: Global APAC Medical Imaging Devices Industry Volume K Unit Forecast, by Country 2019 & 2032
- Table 133: Global APAC Medical Imaging Devices Industry Revenue Million Forecast, by Modality 2019 & 2032
- Table 134: Global APAC Medical Imaging Devices Industry Volume K Unit Forecast, by Modality 2019 & 2032
- Table 135: Global APAC Medical Imaging Devices Industry Revenue Million Forecast, by Application 2019 & 2032
- Table 136: Global APAC Medical Imaging Devices Industry Volume K Unit Forecast, by Application 2019 & 2032
- Table 137: Global APAC Medical Imaging Devices Industry Revenue Million Forecast, by End-User 2019 & 2032
- Table 138: Global APAC Medical Imaging Devices Industry Volume K Unit Forecast, by End-User 2019 & 2032
- Table 139: Global APAC Medical Imaging Devices Industry Revenue Million Forecast, by Geography 2019 & 2032
- Table 140: Global APAC Medical Imaging Devices Industry Volume K Unit Forecast, by Geography 2019 & 2032
- Table 141: Global APAC Medical Imaging Devices Industry Revenue Million Forecast, by Country 2019 & 2032
- Table 142: Global APAC Medical Imaging Devices Industry Volume K Unit Forecast, by Country 2019 & 2032
- Table 143: Global APAC Medical Imaging Devices Industry Revenue Million Forecast, by Modality 2019 & 2032
- Table 144: Global APAC Medical Imaging Devices Industry Volume K Unit Forecast, by Modality 2019 & 2032
- Table 145: Global APAC Medical Imaging Devices Industry Revenue Million Forecast, by Application 2019 & 2032
- Table 146: Global APAC Medical Imaging Devices Industry Volume K Unit Forecast, by Application 2019 & 2032
- Table 147: Global APAC Medical Imaging Devices Industry Revenue Million Forecast, by End-User 2019 & 2032
- Table 148: Global APAC Medical Imaging Devices Industry Volume K Unit Forecast, by End-User 2019 & 2032
- Table 149: Global APAC Medical Imaging Devices Industry Revenue Million Forecast, by Geography 2019 & 2032
- Table 150: Global APAC Medical Imaging Devices Industry Volume K Unit Forecast, by Geography 2019 & 2032
- Table 151: Global APAC Medical Imaging Devices Industry Revenue Million Forecast, by Country 2019 & 2032
- Table 152: Global APAC Medical Imaging Devices Industry Volume K Unit Forecast, by Country 2019 & 2032
- Table 153: Global APAC Medical Imaging Devices Industry Revenue Million Forecast, by Modality 2019 & 2032
- Table 154: Global APAC Medical Imaging Devices Industry Volume K Unit Forecast, by Modality 2019 & 2032
- Table 155: Global APAC Medical Imaging Devices Industry Revenue Million Forecast, by Application 2019 & 2032
- Table 156: Global APAC Medical Imaging Devices Industry Volume K Unit Forecast, by Application 2019 & 2032
- Table 157: Global APAC Medical Imaging Devices Industry Revenue Million Forecast, by End-User 2019 & 2032
- Table 158: Global APAC Medical Imaging Devices Industry Volume K Unit Forecast, by End-User 2019 & 2032
- Table 159: Global APAC Medical Imaging Devices Industry Revenue Million Forecast, by Geography 2019 & 2032
- Table 160: Global APAC Medical Imaging Devices Industry Volume K Unit Forecast, by Geography 2019 & 2032
- Table 161: Global APAC Medical Imaging Devices Industry Revenue Million Forecast, by Country 2019 & 2032
- Table 162: Global APAC Medical Imaging Devices Industry Volume K Unit Forecast, by Country 2019 & 2032
Frequently Asked Questions
1. What is the projected Compound Annual Growth Rate (CAGR) of the APAC Medical Imaging Devices Industry?
The projected CAGR is approximately 7.50%.
2. Which companies are prominent players in the APAC Medical Imaging Devices Industry?
Key companies in the market include Esaote SpA, Hologic Inc, GE Healthcare, Shanghai United Imaging Healthcare Co Ltd, Koninklijke Philips N V, Siemens AG, FUJIFILM Holdings Corporation, Carestream Health, J Morita Corporation, Canon Medical Systems Corporation, Teknova Medical Systems Limited, Shimadzu Corporation.
3. What are the main segments of the APAC Medical Imaging Devices Industry?
The market segments include Modality, Application, End-User, Geography.
4. Can you provide details about the market size?
The market size is estimated to be USD XX Million as of 2022.
5. What are some drivers contributing to market growth?
Rising Prevalence of Chronic Diseases; Technological Advancement in Imaging Modalities; Growing Emphasis on Early Diagnosis.
6. What are the notable trends driving market growth?
Oncology Segment is Expected to Witness a Healthy Growth in Coming Years.
7. Are there any restraints impacting market growth?
Lack of Skilled Radiologist; High Cost of Advanced Diagnostic Imaging Devices.
8. Can you provide examples of recent developments in the market?
October 2022: Luxonus Inc. received approval to market its photoacoustic 3D imaging system in Japan.
9. What pricing options are available for accessing the report?
Pricing options include single-user, multi-user, and enterprise licenses priced at USD 4750, USD 5250, and USD 8750 respectively.
10. Is the market size provided in terms of value or volume?
The market size is provided in terms of value, measured in Million and volume, measured in K Unit.
11. Are there any specific market keywords associated with the report?
Yes, the market keyword associated with the report is "APAC Medical Imaging Devices Industry," which aids in identifying and referencing the specific market segment covered.
12. How do I determine which pricing option suits my needs best?
The pricing options vary based on user requirements and access needs. Individual users may opt for single-user licenses, while businesses requiring broader access may choose multi-user or enterprise licenses for cost-effective access to the report.
13. Are there any additional resources or data provided in the APAC Medical Imaging Devices Industry report?
While the report offers comprehensive insights, it's advisable to review the specific contents or supplementary materials provided to ascertain if additional resources or data are available.
14. How can I stay updated on further developments or reports in the APAC Medical Imaging Devices Industry?
To stay informed about further developments, trends, and reports in the APAC Medical Imaging Devices Industry, consider subscribing to industry newsletters, following relevant companies and organizations, or regularly checking reputable industry news sources and publications.
Methodology
Step 1 - Identification of Relevant Samples Size from Population Database


Step 2 - Approaches for Defining Global Market Size (Value, Volume* & Price*)

Note*: In applicable scenarios
Step 3 - Data Sources
Primary Research
- Web Analytics
- Survey Reports
- Research Institute
- Latest Research Reports
- Opinion Leaders
Secondary Research
- Annual Reports
- White Paper
- Latest Press Release
- Industry Association
- Paid Database
- Investor Presentations

Step 4 - Data Triangulation
Involves using different sources of information in order to increase the validity of a study
These sources are likely to be stakeholders in a program - participants, other researchers, program staff, other community members, and so on.
Then we put all data in single framework & apply various statistical tools to find out the dynamic on the market.
During the analysis stage, feedback from the stakeholder groups would be compared to determine areas of agreement as well as areas of divergence


