
Key Insights
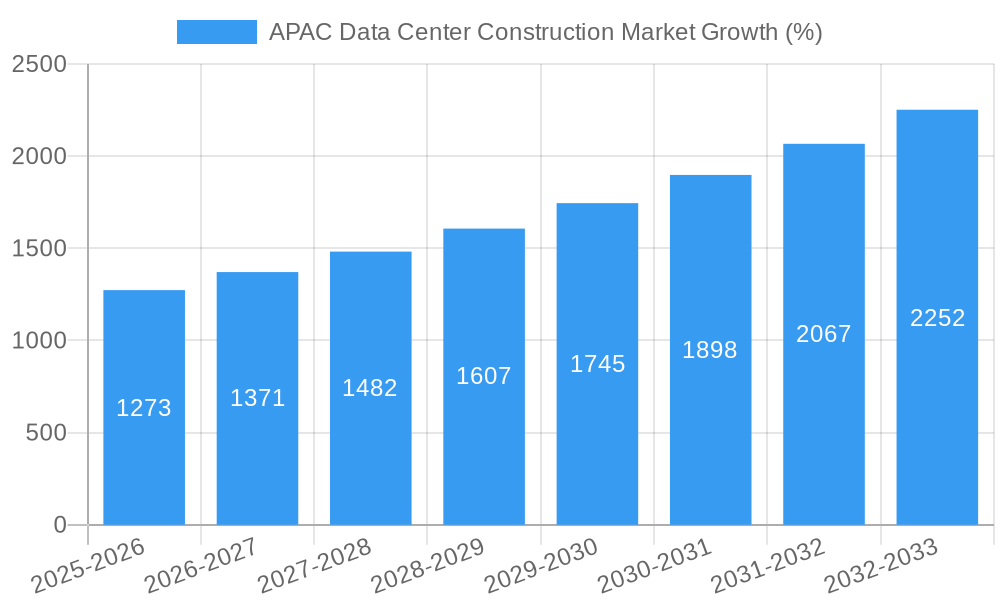
The APAC data center construction market is experiencing robust growth, driven by the increasing demand for digital services, cloud computing adoption, and the expansion of 5G networks across the region. The market's Compound Annual Growth Rate (CAGR) of 8.62% from 2019-2024 indicates a strong trajectory, projected to continue into the forecast period (2025-2033). Key drivers include significant investments in digital infrastructure by governments and private sector companies, particularly in countries like India, China, and Japan, to support their burgeoning economies and expanding technological capabilities. Furthermore, the rise of hyperscale data centers and the need for edge computing solutions are fueling the demand for new data center construction projects. Market segmentation reveals a diverse landscape, with significant contributions from various infrastructure types (electrical and mechanical), varying data center sizes (from small to mega), and end-user sectors including IT & Telecommunications, BFSI (Banking, Financial Services, and Insurance), and the Government sector. While challenges such as land scarcity in major urban areas and regulatory hurdles might exist, the overall market outlook remains positive, with significant opportunities for construction companies specializing in data center projects.
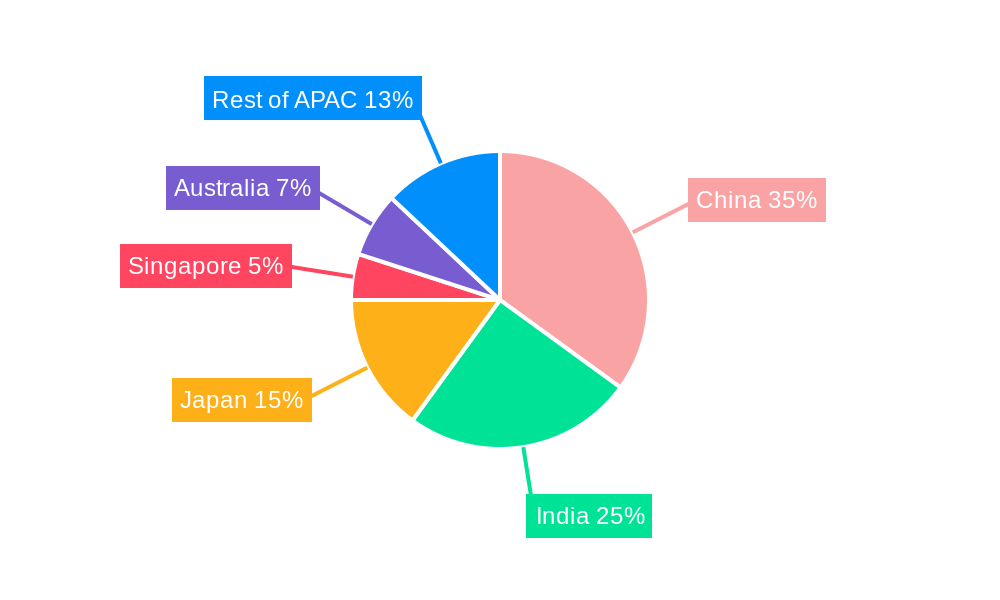
The market's regional distribution reflects the uneven pace of digitalization within APAC. While countries like China, India, Singapore, and Japan dominate in terms of market size and investments, other nations like Australia, South Korea, and Vietnam are also witnessing substantial growth. The construction of data centers is increasingly sophisticated, requiring specialized expertise and technological advancements. Consequently, companies with proven track records in handling complex projects, including environmental considerations and sustainability initiatives, are expected to gain a competitive advantage. The forecast period promises further diversification with emerging trends like modular data center construction gaining traction, offering faster deployment times and cost efficiencies. However, sustained growth will depend on factors such as the availability of skilled labor, ongoing government support, and consistent investment from both domestic and international players in the technology sector.
APAC Data Center Construction Market: A Comprehensive Report (2019-2033)
This comprehensive report provides an in-depth analysis of the APAC data center construction market, offering valuable insights for investors, industry professionals, and strategic decision-makers. The study covers the period 2019-2033, with 2025 as the base year and a forecast period spanning 2025-2033. The report segments the market by infrastructure (electrical, mechanical, other), data center size (small, medium, large, massive, mega), tier type (Tier 1, Tier 2, Tier 3, Tier 4), end-user (IT & Telecommunication, BFSI, Government, Healthcare, Other), and country (Australia, India, China, Japan, Hong Kong, Vietnam, Taiwan, Singapore, South Korea, New Zealand, Malaysia, Thailand, Indonesia, Philippines). Key players analyzed include SAS Institute Inc, Fortis Construction, Aueron Group, JE Dunn Construction Group Inc, Hutchinson Builders, Kienta Engineering Construction, DSCO Group, IBM Corporation, Sato Kogyo, Nakano Corporation, Gammon Construction, Studio one Design, Powerware Systems, Turner Construction Co, DPR Construction Inc, Hensel Phelps Construction Co Inc, Obayashi Corporation, CSF Group, M+W Group, NTT Facilities, and AECOM. The report's total market value in 2025 is estimated at xx Million.
APAC Data Center Construction Market Structure & Competitive Dynamics
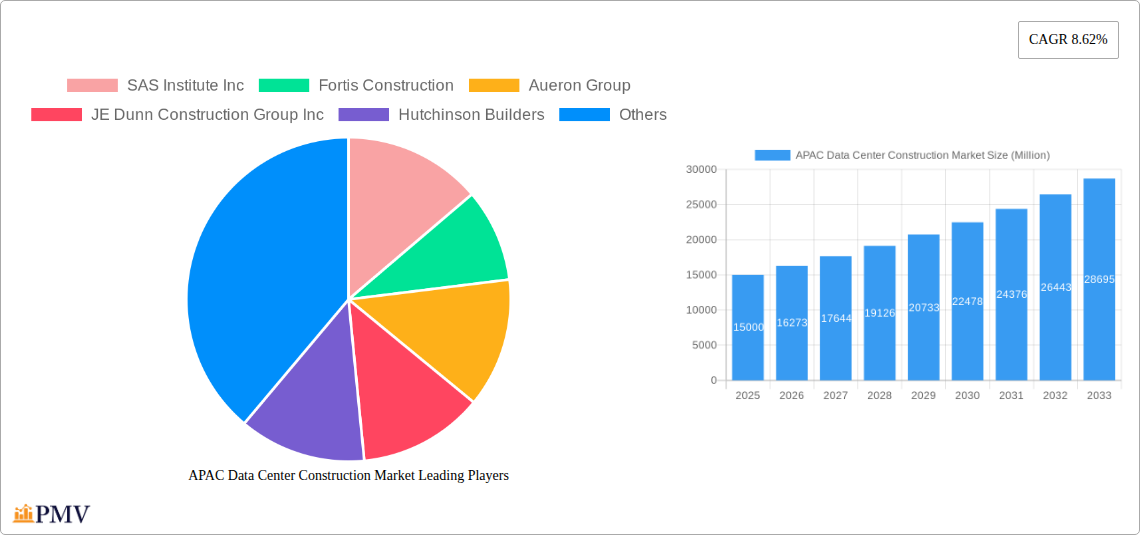
The APAC data center construction market exhibits a moderately concentrated structure, with a few large multinational players and numerous regional contractors vying for market share. The market is characterized by a dynamic interplay of factors influencing its competitive landscape. These include rapid technological advancements driving innovation, diverse regulatory frameworks across the region, and the increasing prevalence of mergers and acquisitions (M&A) activity. While precise market share figures for individual companies are proprietary, we estimate the top five players hold approximately xx% of the market share collectively in 2025. M&A activity is significant; in recent years, deal values have ranged from xx Million to xx Million, driven primarily by the consolidation of smaller firms by larger players seeking to expand their geographic reach and service portfolios.
- Market Concentration: Moderately concentrated, with a few dominant players and many smaller firms.
- Innovation Ecosystems: Driven by advancements in sustainable technologies, prefabrication, and modular construction.
- Regulatory Frameworks: Vary significantly across countries, impacting project timelines and costs.
- Product Substitutes: Limited, with the primary focus on improving efficiency and sustainability in existing solutions.
- End-User Trends: Strong growth in demand from hyperscalers, cloud providers, and BFSI sectors.
- M&A Activities: Frequent, primarily driven by expansion and consolidation strategies.
APAC Data Center Construction Market Industry Trends & Insights
The APAC data center construction market is experiencing robust growth, driven by the increasing adoption of cloud computing, big data analytics, and the Internet of Things (IoT). The Compound Annual Growth Rate (CAGR) for the period 2025-2033 is projected to be xx%, fueled by substantial investments in digital infrastructure across the region. Market penetration is high in developed economies like Japan, Singapore, and Australia, but significant growth potential exists in emerging markets like India and Indonesia. This expansion is also supported by government initiatives promoting digital transformation and favorable regulatory environments in specific countries. Technological disruptions, such as the increasing adoption of modular data center designs and sustainable construction practices, are reshaping the market landscape. Competitive dynamics are characterized by both price competition and differentiation through specialized services and technological expertise. Consumer preferences are shifting towards energy-efficient and sustainable data center solutions. The market is poised for continued expansion, with opportunities for both established players and new entrants.
Dominant Markets & Segments in APAC Data Center Construction Market
Within the APAC data center construction market, several key regions and segments are demonstrating significant dominance.
- By Country: China and India are leading the market due to their large and rapidly expanding digital economies and massive investments in data center infrastructure. Japan and Singapore also hold significant positions due to their established technological infrastructure and strong governmental support.
- By Infrastructure: Electrical infrastructure accounts for the largest share due to the high power requirements of modern data centers.
- By DC Size: The demand for large and mega data centers is rising due to the growing needs of hyperscale operators.
- By Tier Type: Tier 3 and Tier 4 data centers are gaining traction, reflecting the growing emphasis on reliability and redundancy.
- By End-User: IT & Telecommunication and BFSI sectors are the leading end-users due to their heavy reliance on data storage and processing capabilities.
Key Drivers for Dominant Segments:
- China & India: Strong government support, increasing digitalization, and large populations driving demand.
- Electrical Infrastructure: Essential for powering and cooling IT equipment.
- Large/Mega Data Centers: Driven by hyperscale cloud providers’ needs.
- Tier 3/4 Data Centers: High reliability and uptime requirements.
- IT & BFSI: High dependence on data processing and storage.
APAP Data Center Construction Market Product Innovations
The APAC data center construction market is witnessing significant product innovations focused on enhancing efficiency, sustainability, and scalability. Modular data center designs, prefabricated components, and the integration of renewable energy sources are gaining traction. These innovations offer faster deployment, reduced construction costs, and lower environmental impact. The market is also witnessing an increase in the adoption of advanced cooling technologies, such as liquid cooling and free air cooling, to improve energy efficiency. This focus on innovation provides competitive advantages through faster deployment, reduced operational costs, and improved sustainability profiles.
Report Segmentation & Scope
This report segments the APAC data center construction market comprehensively by infrastructure, data center size, tier type, end-user, and country. Each segment's growth projections, market size (in Million), and competitive dynamics are analyzed. For example, the electrical infrastructure segment shows significant growth due to power demands, while large data centers drive high demand for specialized construction services. The IT and BFSI end-users are key drivers, and China and India lead in overall market size. Country-specific market sizes and growth rates are provided, reflecting unique economic and regulatory environments.
Key Drivers of APAC Data Center Construction Market Growth
Several factors are driving the growth of the APAC data center construction market. These include the burgeoning digital economy across the region, fuelled by the proliferation of cloud computing, big data analytics, and the Internet of Things (IoT). Government initiatives promoting digital transformation in various countries are further stimulating investment in data center infrastructure. Additionally, rising demand from hyperscale cloud providers and the increasing adoption of advanced technologies, such as AI and machine learning, are major contributors to market expansion.
Challenges in the APAC Data Center Construction Market Sector
Despite its robust growth, the APAC data center construction market faces challenges. These include securing sufficient land and securing necessary permits, navigating complex regulatory environments across diverse countries, managing supply chain disruptions impacting construction materials, and competing for skilled labor in a tight job market. These factors can significantly impact project timelines and costs, particularly in fast-growing markets. Furthermore, ensuring sustainability in construction practices and meeting stringent energy efficiency requirements pose challenges.
Leading Players in the APAC Data Center Construction Market
- SAS Institute Inc
- Fortis Construction
- Aueron Group
- JE Dunn Construction Group Inc
- Hutchinson Builders
- Kienta Engineering Construction
- DSCO Group
- IBM Corporation
- Sato Kogyo
- Nakano Corporation
- Gammon Construction
- Studio one Design
- Powerware Systems
- Turner Construction Co
- DPR Construction Inc
- Hensel Phelps Construction Co Inc
- Obayashi Corporation
- CSF Group
- M+W Group
- NTT Facilities
- AECOM
Key Developments in APAC Data Center Construction Market Sector
- June 2023: Bridge Data Centers announced the expansion of its hyperscale data centers with a 64MW IT power capacity in Kuala Lumpur, Malaysia, signaling significant growth opportunities for data center construction vendors.
- July 2022: L&T Construction secured a contract to build 10.8 MW of data center capacity in Mumbai and Navi Mumbai, India, highlighting the substantial investment in Indian data center infrastructure.
Strategic APAC Data Center Construction Market Outlook
The APAC data center construction market holds significant future potential, driven by sustained growth in digital adoption and government support for digital infrastructure development across the region. Strategic opportunities exist for companies focusing on sustainable construction practices, modular designs, and specialized services catering to hyperscale operators. The market is poised for continued expansion, with significant growth potential in emerging markets, presenting numerous opportunities for both established and new entrants to capture market share.
APAC Data Center Construction Market Segmentation
-
1. Infrastructure
-
1.1. Market Segmentation - By Electrical Infrastructure
-
1.1.1. Power Distribution Solution
- 1.1.1.1. PDU: Basic & Smart - Metered & Switched solutions
-
1.1.1.2. Transfer Switches
- 1.1.1.2.1. Static
- 1.1.1.2.2. Automatic (ATS)
-
1.1.1.3. Switchgear
- 1.1.1.3.1. Low-Voltage
- 1.1.1.3.2. Medium-Voltage
- 1.1.1.4. Power Panels and Components
- 1.1.1.5. Others
-
1.1.2. Power Back up Solutions
- 1.1.2.1. UPS
- 1.1.2.2. Generators
- 1.1.3. Service
-
1.1.1. Power Distribution Solution
-
1.2. Market Segmentation - By Mechanical Infrastructure
-
1.2.1. Cooling Systems
- 1.2.1.1. Immersion Cooling
- 1.2.1.2. Direct-To-Chip Cooling
- 1.2.1.3. Rear Door Heat Exchanger
- 1.2.1.4. In-Row and In-Rack Cooling
- 1.2.1.5. Racks
- 1.2.1.6. Other Mechanical Infrastructure
-
1.2.1. Cooling Systems
- 1.3. General Construction
-
1.1. Market Segmentation - By Electrical Infrastructure
-
2. Electrical Infrastructure
-
2.1. Power Distribution Solution
- 2.1.1. PDU: Basic & Smart - Metered & Switched solutions
-
2.1.2. Transfer Switches
- 2.1.2.1. Static
- 2.1.2.2. Automatic (ATS)
-
2.1.3. Switchgear
- 2.1.3.1. Low-Voltage
- 2.1.3.2. Medium-Voltage
- 2.1.4. Power Panels and Components
- 2.1.5. Others
-
2.2. Power Back up Solutions
- 2.2.1. UPS
- 2.2.2. Generators
- 2.3. Service
-
2.1. Power Distribution Solution
-
3. Power Distribution Solution
- 3.1. PDU: Basic & Smart - Metered & Switched solutions
-
3.2. Transfer Switches
- 3.2.1. Static
- 3.2.2. Automatic (ATS)
-
3.3. Switchgear
- 3.3.1. Low-Voltage
- 3.3.2. Medium-Voltage
- 3.4. Power Panels and Components
- 3.5. Others
-
4. Power Back up Solutions
- 4.1. UPS
- 4.2. Generators
- 5. Service
-
6. Mechanical Infrastructure
-
6.1. Cooling Systems
- 6.1.1. Immersion Cooling
- 6.1.2. Direct-To-Chip Cooling
- 6.1.3. Rear Door Heat Exchanger
- 6.1.4. In-Row and In-Rack Cooling
- 6.1.5. Racks
- 6.1.6. Other Mechanical Infrastructure
-
6.1. Cooling Systems
-
7. Cooling Systems
- 7.1. Immersion Cooling
- 7.2. Direct-To-Chip Cooling
- 7.3. Rear Door Heat Exchanger
- 7.4. In-Row and In-Rack Cooling
- 7.5. Racks
- 7.6. Other Mechanical Infrastructure
- 8. General Construction
-
9. Tier Type
- 9.1. Tier I and II
- 9.2. Tier-III
- 9.3. Tier-IV
- 10. Tier I and II
- 11. Tier-III
- 12. Tier-IV
-
13. End User
- 13.1. Banking, Financial Services, and Insurance
- 13.2. IT and Telecommunications
- 13.3. Government and Defense
- 13.4. Healthcare
- 13.5. Other End Users
- 14. Banking, Financial Services, and Insurance
- 15. IT and Telecommunications
- 16. Government and Defense
- 17. Healthcare
- 18. Other End Users
- 19. China
- 20. India
- 21. Japan
- 22. Australia
- 23. Indonesia
-
24. Data Center Size
- 24.1. Small
- 24.2. Medium
- 24.3. Large
- 24.4. Massive
- 24.5. Mega
- 25. Small
- 26. Medium
- 27. Large
- 28. Massive
- 29. Mega
APAC Data Center Construction Market Segmentation By Geography
-
1. North America
- 1.1. United States
- 1.2. Canada
- 1.3. Mexico
-
2. South America
- 2.1. Brazil
- 2.2. Argentina
- 2.3. Rest of South America
-
3. Europe
- 3.1. United Kingdom
- 3.2. Germany
- 3.3. France
- 3.4. Italy
- 3.5. Spain
- 3.6. Russia
- 3.7. Benelux
- 3.8. Nordics
- 3.9. Rest of Europe
-
4. Middle East & Africa
- 4.1. Turkey
- 4.2. Israel
- 4.3. GCC
- 4.4. North Africa
- 4.5. South Africa
- 4.6. Rest of Middle East & Africa
-
5. Asia Pacific
- 5.1. China
- 5.2. India
- 5.3. Japan
- 5.4. South Korea
- 5.5. ASEAN
- 5.6. Oceania
- 5.7. Rest of Asia Pacific
APAC Data Center Construction Market REPORT HIGHLIGHTS
| Aspects | Details |
|---|---|
| Study Period | 2019-2033 |
| Base Year | 2024 |
| Estimated Year | 2025 |
| Forecast Period | 2025-2033 |
| Historical Period | 2019-2024 |
| Growth Rate | CAGR of 8.62% from 2019-2033 |
| Segmentation |
|
Table of Contents
- 1. Introduction
- 1.1. Research Scope
- 1.2. Market Segmentation
- 1.3. Research Methodology
- 1.4. Definitions and Assumptions
- 2. Executive Summary
- 2.1. Introduction
- 3. Market Dynamics
- 3.1. Introduction
- 3.2. Market Drivers
- 3.2.1 9.1 Growing Demand for SMAC (Social
- 3.2.2 Mobile
- 3.2.3 Analytics
- 3.2.4 and Cloud) Applications9.2 Growing Adoption of Hyperscale Data Centers in Large Enterprises9.3 Major Initiatives Undertaken by Governments to Promote Digital Economy and Connectivity Infrastructure
- 3.3. Market Restrains
- 3.3.1 10.1 Environmental
- 3.3.2 Cost
- 3.3.3 and Workforce-related Challenges
- 3.4. Market Trends
- 3.4.1. China witnessing rapid data center construction activities
- 4. Market Factor Analysis
- 4.1. Porters Five Forces
- 4.2. Supply/Value Chain
- 4.3. PESTEL analysis
- 4.4. Market Entropy
- 4.5. Patent/Trademark Analysis
- 5. Global APAC Data Center Construction Market Analysis, Insights and Forecast, 2019-2031
- 5.1. Market Analysis, Insights and Forecast - by Infrastructure
- 5.1.1. Market Segmentation - By Electrical Infrastructure
- 5.1.1.1. Power Distribution Solution
- 5.1.1.1.1. PDU: Basic & Smart - Metered & Switched solutions
- 5.1.1.1.2. Transfer Switches
- 5.1.1.1.2.1. Static
- 5.1.1.1.2.2. Automatic (ATS)
- 5.1.1.1.3. Switchgear
- 5.1.1.1.3.1. Low-Voltage
- 5.1.1.1.3.2. Medium-Voltage
- 5.1.1.1.4. Power Panels and Components
- 5.1.1.1.5. Others
- 5.1.1.2. Power Back up Solutions
- 5.1.1.2.1. UPS
- 5.1.1.2.2. Generators
- 5.1.1.3. Service
- 5.1.1.1. Power Distribution Solution
- 5.1.2. Market Segmentation - By Mechanical Infrastructure
- 5.1.2.1. Cooling Systems
- 5.1.2.1.1. Immersion Cooling
- 5.1.2.1.2. Direct-To-Chip Cooling
- 5.1.2.1.3. Rear Door Heat Exchanger
- 5.1.2.1.4. In-Row and In-Rack Cooling
- 5.1.2.1.5. Racks
- 5.1.2.1.6. Other Mechanical Infrastructure
- 5.1.2.1. Cooling Systems
- 5.1.3. General Construction
- 5.1.1. Market Segmentation - By Electrical Infrastructure
- 5.2. Market Analysis, Insights and Forecast - by Electrical Infrastructure
- 5.2.1. Power Distribution Solution
- 5.2.1.1. PDU: Basic & Smart - Metered & Switched solutions
- 5.2.1.2. Transfer Switches
- 5.2.1.2.1. Static
- 5.2.1.2.2. Automatic (ATS)
- 5.2.1.3. Switchgear
- 5.2.1.3.1. Low-Voltage
- 5.2.1.3.2. Medium-Voltage
- 5.2.1.4. Power Panels and Components
- 5.2.1.5. Others
- 5.2.2. Power Back up Solutions
- 5.2.2.1. UPS
- 5.2.2.2. Generators
- 5.2.3. Service
- 5.2.1. Power Distribution Solution
- 5.3. Market Analysis, Insights and Forecast - by Power Distribution Solution
- 5.3.1. PDU: Basic & Smart - Metered & Switched solutions
- 5.3.2. Transfer Switches
- 5.3.2.1. Static
- 5.3.2.2. Automatic (ATS)
- 5.3.3. Switchgear
- 5.3.3.1. Low-Voltage
- 5.3.3.2. Medium-Voltage
- 5.3.4. Power Panels and Components
- 5.3.5. Others
- 5.4. Market Analysis, Insights and Forecast - by Power Back up Solutions
- 5.4.1. UPS
- 5.4.2. Generators
- 5.5. Market Analysis, Insights and Forecast - by Service
- 5.6. Market Analysis, Insights and Forecast - by Mechanical Infrastructure
- 5.6.1. Cooling Systems
- 5.6.1.1. Immersion Cooling
- 5.6.1.2. Direct-To-Chip Cooling
- 5.6.1.3. Rear Door Heat Exchanger
- 5.6.1.4. In-Row and In-Rack Cooling
- 5.6.1.5. Racks
- 5.6.1.6. Other Mechanical Infrastructure
- 5.6.1. Cooling Systems
- 5.7. Market Analysis, Insights and Forecast - by Cooling Systems
- 5.7.1. Immersion Cooling
- 5.7.2. Direct-To-Chip Cooling
- 5.7.3. Rear Door Heat Exchanger
- 5.7.4. In-Row and In-Rack Cooling
- 5.7.5. Racks
- 5.7.6. Other Mechanical Infrastructure
- 5.8. Market Analysis, Insights and Forecast - by General Construction
- 5.9. Market Analysis, Insights and Forecast - by Tier Type
- 5.9.1. Tier I and II
- 5.9.2. Tier-III
- 5.9.3. Tier-IV
- 5.10. Market Analysis, Insights and Forecast - by Tier I and II
- 5.11. Market Analysis, Insights and Forecast - by Tier-III
- 5.12. Market Analysis, Insights and Forecast - by Tier-IV
- 5.13. Market Analysis, Insights and Forecast - by End User
- 5.13.1. Banking, Financial Services, and Insurance
- 5.13.2. IT and Telecommunications
- 5.13.3. Government and Defense
- 5.13.4. Healthcare
- 5.13.5. Other End Users
- 5.14. Market Analysis, Insights and Forecast - by Banking, Financial Services, and Insurance
- 5.15. Market Analysis, Insights and Forecast - by IT and Telecommunications
- 5.16. Market Analysis, Insights and Forecast - by Government and Defense
- 5.17. Market Analysis, Insights and Forecast - by Healthcare
- 5.18. Market Analysis, Insights and Forecast - by Other End Users
- 5.19. Market Analysis, Insights and Forecast - by China
- 5.20. Market Analysis, Insights and Forecast - by India
- 5.21. Market Analysis, Insights and Forecast - by Japan
- 5.22. Market Analysis, Insights and Forecast - by Australia
- 5.23. Market Analysis, Insights and Forecast - by Indonesia
- 5.24. Market Analysis, Insights and Forecast - by Data Center Size
- 5.24.1. Small
- 5.24.2. Medium
- 5.24.3. Large
- 5.24.4. Massive
- 5.24.5. Mega
- 5.25. Market Analysis, Insights and Forecast - by Small
- 5.26. Market Analysis, Insights and Forecast - by Medium
- 5.27. Market Analysis, Insights and Forecast - by Large
- 5.28. Market Analysis, Insights and Forecast - by Massive
- 5.29. Market Analysis, Insights and Forecast - by Mega
- 5.30. Market Analysis, Insights and Forecast - by Region
- 5.30.1. North America
- 5.30.2. South America
- 5.30.3. Europe
- 5.30.4. Middle East & Africa
- 5.30.5. Asia Pacific
- 5.1. Market Analysis, Insights and Forecast - by Infrastructure
- 6. North America APAC Data Center Construction Market Analysis, Insights and Forecast, 2019-2031
- 6.1. Market Analysis, Insights and Forecast - by Infrastructure
- 6.1.1. Market Segmentation - By Electrical Infrastructure
- 6.1.1.1. Power Distribution Solution
- 6.1.1.1.1. PDU: Basic & Smart - Metered & Switched solutions
- 6.1.1.1.2. Transfer Switches
- 6.1.1.1.2.1. Static
- 6.1.1.1.2.2. Automatic (ATS)
- 6.1.1.1.3. Switchgear
- 6.1.1.1.3.1. Low-Voltage
- 6.1.1.1.3.2. Medium-Voltage
- 6.1.1.1.4. Power Panels and Components
- 6.1.1.1.5. Others
- 6.1.1.2. Power Back up Solutions
- 6.1.1.2.1. UPS
- 6.1.1.2.2. Generators
- 6.1.1.3. Service
- 6.1.1.1. Power Distribution Solution
- 6.1.2. Market Segmentation - By Mechanical Infrastructure
- 6.1.2.1. Cooling Systems
- 6.1.2.1.1. Immersion Cooling
- 6.1.2.1.2. Direct-To-Chip Cooling
- 6.1.2.1.3. Rear Door Heat Exchanger
- 6.1.2.1.4. In-Row and In-Rack Cooling
- 6.1.2.1.5. Racks
- 6.1.2.1.6. Other Mechanical Infrastructure
- 6.1.2.1. Cooling Systems
- 6.1.3. General Construction
- 6.1.1. Market Segmentation - By Electrical Infrastructure
- 6.2. Market Analysis, Insights and Forecast - by Electrical Infrastructure
- 6.2.1. Power Distribution Solution
- 6.2.1.1. PDU: Basic & Smart - Metered & Switched solutions
- 6.2.1.2. Transfer Switches
- 6.2.1.2.1. Static
- 6.2.1.2.2. Automatic (ATS)
- 6.2.1.3. Switchgear
- 6.2.1.3.1. Low-Voltage
- 6.2.1.3.2. Medium-Voltage
- 6.2.1.4. Power Panels and Components
- 6.2.1.5. Others
- 6.2.2. Power Back up Solutions
- 6.2.2.1. UPS
- 6.2.2.2. Generators
- 6.2.3. Service
- 6.2.1. Power Distribution Solution
- 6.3. Market Analysis, Insights and Forecast - by Power Distribution Solution
- 6.3.1. PDU: Basic & Smart - Metered & Switched solutions
- 6.3.2. Transfer Switches
- 6.3.2.1. Static
- 6.3.2.2. Automatic (ATS)
- 6.3.3. Switchgear
- 6.3.3.1. Low-Voltage
- 6.3.3.2. Medium-Voltage
- 6.3.4. Power Panels and Components
- 6.3.5. Others
- 6.4. Market Analysis, Insights and Forecast - by Power Back up Solutions
- 6.4.1. UPS
- 6.4.2. Generators
- 6.5. Market Analysis, Insights and Forecast - by Service
- 6.6. Market Analysis, Insights and Forecast - by Mechanical Infrastructure
- 6.6.1. Cooling Systems
- 6.6.1.1. Immersion Cooling
- 6.6.1.2. Direct-To-Chip Cooling
- 6.6.1.3. Rear Door Heat Exchanger
- 6.6.1.4. In-Row and In-Rack Cooling
- 6.6.1.5. Racks
- 6.6.1.6. Other Mechanical Infrastructure
- 6.6.1. Cooling Systems
- 6.7. Market Analysis, Insights and Forecast - by Cooling Systems
- 6.7.1. Immersion Cooling
- 6.7.2. Direct-To-Chip Cooling
- 6.7.3. Rear Door Heat Exchanger
- 6.7.4. In-Row and In-Rack Cooling
- 6.7.5. Racks
- 6.7.6. Other Mechanical Infrastructure
- 6.8. Market Analysis, Insights and Forecast - by General Construction
- 6.9. Market Analysis, Insights and Forecast - by Tier Type
- 6.9.1. Tier I and II
- 6.9.2. Tier-III
- 6.9.3. Tier-IV
- 6.10. Market Analysis, Insights and Forecast - by Tier I and II
- 6.11. Market Analysis, Insights and Forecast - by Tier-III
- 6.12. Market Analysis, Insights and Forecast - by Tier-IV
- 6.13. Market Analysis, Insights and Forecast - by End User
- 6.13.1. Banking, Financial Services, and Insurance
- 6.13.2. IT and Telecommunications
- 6.13.3. Government and Defense
- 6.13.4. Healthcare
- 6.13.5. Other End Users
- 6.14. Market Analysis, Insights and Forecast - by Banking, Financial Services, and Insurance
- 6.15. Market Analysis, Insights and Forecast - by IT and Telecommunications
- 6.16. Market Analysis, Insights and Forecast - by Government and Defense
- 6.17. Market Analysis, Insights and Forecast - by Healthcare
- 6.18. Market Analysis, Insights and Forecast - by Other End Users
- 6.19. Market Analysis, Insights and Forecast - by China
- 6.20. Market Analysis, Insights and Forecast - by India
- 6.21. Market Analysis, Insights and Forecast - by Japan
- 6.22. Market Analysis, Insights and Forecast - by Australia
- 6.23. Market Analysis, Insights and Forecast - by Indonesia
- 6.24. Market Analysis, Insights and Forecast - by Data Center Size
- 6.24.1. Small
- 6.24.2. Medium
- 6.24.3. Large
- 6.24.4. Massive
- 6.24.5. Mega
- 6.25. Market Analysis, Insights and Forecast - by Small
- 6.26. Market Analysis, Insights and Forecast - by Medium
- 6.27. Market Analysis, Insights and Forecast - by Large
- 6.28. Market Analysis, Insights and Forecast - by Massive
- 6.29. Market Analysis, Insights and Forecast - by Mega
- 6.1. Market Analysis, Insights and Forecast - by Infrastructure
- 7. South America APAC Data Center Construction Market Analysis, Insights and Forecast, 2019-2031
- 7.1. Market Analysis, Insights and Forecast - by Infrastructure
- 7.1.1. Market Segmentation - By Electrical Infrastructure
- 7.1.1.1. Power Distribution Solution
- 7.1.1.1.1. PDU: Basic & Smart - Metered & Switched solutions
- 7.1.1.1.2. Transfer Switches
- 7.1.1.1.2.1. Static
- 7.1.1.1.2.2. Automatic (ATS)
- 7.1.1.1.3. Switchgear
- 7.1.1.1.3.1. Low-Voltage
- 7.1.1.1.3.2. Medium-Voltage
- 7.1.1.1.4. Power Panels and Components
- 7.1.1.1.5. Others
- 7.1.1.2. Power Back up Solutions
- 7.1.1.2.1. UPS
- 7.1.1.2.2. Generators
- 7.1.1.3. Service
- 7.1.1.1. Power Distribution Solution
- 7.1.2. Market Segmentation - By Mechanical Infrastructure
- 7.1.2.1. Cooling Systems
- 7.1.2.1.1. Immersion Cooling
- 7.1.2.1.2. Direct-To-Chip Cooling
- 7.1.2.1.3. Rear Door Heat Exchanger
- 7.1.2.1.4. In-Row and In-Rack Cooling
- 7.1.2.1.5. Racks
- 7.1.2.1.6. Other Mechanical Infrastructure
- 7.1.2.1. Cooling Systems
- 7.1.3. General Construction
- 7.1.1. Market Segmentation - By Electrical Infrastructure
- 7.2. Market Analysis, Insights and Forecast - by Electrical Infrastructure
- 7.2.1. Power Distribution Solution
- 7.2.1.1. PDU: Basic & Smart - Metered & Switched solutions
- 7.2.1.2. Transfer Switches
- 7.2.1.2.1. Static
- 7.2.1.2.2. Automatic (ATS)
- 7.2.1.3. Switchgear
- 7.2.1.3.1. Low-Voltage
- 7.2.1.3.2. Medium-Voltage
- 7.2.1.4. Power Panels and Components
- 7.2.1.5. Others
- 7.2.2. Power Back up Solutions
- 7.2.2.1. UPS
- 7.2.2.2. Generators
- 7.2.3. Service
- 7.2.1. Power Distribution Solution
- 7.3. Market Analysis, Insights and Forecast - by Power Distribution Solution
- 7.3.1. PDU: Basic & Smart - Metered & Switched solutions
- 7.3.2. Transfer Switches
- 7.3.2.1. Static
- 7.3.2.2. Automatic (ATS)
- 7.3.3. Switchgear
- 7.3.3.1. Low-Voltage
- 7.3.3.2. Medium-Voltage
- 7.3.4. Power Panels and Components
- 7.3.5. Others
- 7.4. Market Analysis, Insights and Forecast - by Power Back up Solutions
- 7.4.1. UPS
- 7.4.2. Generators
- 7.5. Market Analysis, Insights and Forecast - by Service
- 7.6. Market Analysis, Insights and Forecast - by Mechanical Infrastructure
- 7.6.1. Cooling Systems
- 7.6.1.1. Immersion Cooling
- 7.6.1.2. Direct-To-Chip Cooling
- 7.6.1.3. Rear Door Heat Exchanger
- 7.6.1.4. In-Row and In-Rack Cooling
- 7.6.1.5. Racks
- 7.6.1.6. Other Mechanical Infrastructure
- 7.6.1. Cooling Systems
- 7.7. Market Analysis, Insights and Forecast - by Cooling Systems
- 7.7.1. Immersion Cooling
- 7.7.2. Direct-To-Chip Cooling
- 7.7.3. Rear Door Heat Exchanger
- 7.7.4. In-Row and In-Rack Cooling
- 7.7.5. Racks
- 7.7.6. Other Mechanical Infrastructure
- 7.8. Market Analysis, Insights and Forecast - by General Construction
- 7.9. Market Analysis, Insights and Forecast - by Tier Type
- 7.9.1. Tier I and II
- 7.9.2. Tier-III
- 7.9.3. Tier-IV
- 7.10. Market Analysis, Insights and Forecast - by Tier I and II
- 7.11. Market Analysis, Insights and Forecast - by Tier-III
- 7.12. Market Analysis, Insights and Forecast - by Tier-IV
- 7.13. Market Analysis, Insights and Forecast - by End User
- 7.13.1. Banking, Financial Services, and Insurance
- 7.13.2. IT and Telecommunications
- 7.13.3. Government and Defense
- 7.13.4. Healthcare
- 7.13.5. Other End Users
- 7.14. Market Analysis, Insights and Forecast - by Banking, Financial Services, and Insurance
- 7.15. Market Analysis, Insights and Forecast - by IT and Telecommunications
- 7.16. Market Analysis, Insights and Forecast - by Government and Defense
- 7.17. Market Analysis, Insights and Forecast - by Healthcare
- 7.18. Market Analysis, Insights and Forecast - by Other End Users
- 7.19. Market Analysis, Insights and Forecast - by China
- 7.20. Market Analysis, Insights and Forecast - by India
- 7.21. Market Analysis, Insights and Forecast - by Japan
- 7.22. Market Analysis, Insights and Forecast - by Australia
- 7.23. Market Analysis, Insights and Forecast - by Indonesia
- 7.24. Market Analysis, Insights and Forecast - by Data Center Size
- 7.24.1. Small
- 7.24.2. Medium
- 7.24.3. Large
- 7.24.4. Massive
- 7.24.5. Mega
- 7.25. Market Analysis, Insights and Forecast - by Small
- 7.26. Market Analysis, Insights and Forecast - by Medium
- 7.27. Market Analysis, Insights and Forecast - by Large
- 7.28. Market Analysis, Insights and Forecast - by Massive
- 7.29. Market Analysis, Insights and Forecast - by Mega
- 7.1. Market Analysis, Insights and Forecast - by Infrastructure
- 8. Europe APAC Data Center Construction Market Analysis, Insights and Forecast, 2019-2031
- 8.1. Market Analysis, Insights and Forecast - by Infrastructure
- 8.1.1. Market Segmentation - By Electrical Infrastructure
- 8.1.1.1. Power Distribution Solution
- 8.1.1.1.1. PDU: Basic & Smart - Metered & Switched solutions
- 8.1.1.1.2. Transfer Switches
- 8.1.1.1.2.1. Static
- 8.1.1.1.2.2. Automatic (ATS)
- 8.1.1.1.3. Switchgear
- 8.1.1.1.3.1. Low-Voltage
- 8.1.1.1.3.2. Medium-Voltage
- 8.1.1.1.4. Power Panels and Components
- 8.1.1.1.5. Others
- 8.1.1.2. Power Back up Solutions
- 8.1.1.2.1. UPS
- 8.1.1.2.2. Generators
- 8.1.1.3. Service
- 8.1.1.1. Power Distribution Solution
- 8.1.2. Market Segmentation - By Mechanical Infrastructure
- 8.1.2.1. Cooling Systems
- 8.1.2.1.1. Immersion Cooling
- 8.1.2.1.2. Direct-To-Chip Cooling
- 8.1.2.1.3. Rear Door Heat Exchanger
- 8.1.2.1.4. In-Row and In-Rack Cooling
- 8.1.2.1.5. Racks
- 8.1.2.1.6. Other Mechanical Infrastructure
- 8.1.2.1. Cooling Systems
- 8.1.3. General Construction
- 8.1.1. Market Segmentation - By Electrical Infrastructure
- 8.2. Market Analysis, Insights and Forecast - by Electrical Infrastructure
- 8.2.1. Power Distribution Solution
- 8.2.1.1. PDU: Basic & Smart - Metered & Switched solutions
- 8.2.1.2. Transfer Switches
- 8.2.1.2.1. Static
- 8.2.1.2.2. Automatic (ATS)
- 8.2.1.3. Switchgear
- 8.2.1.3.1. Low-Voltage
- 8.2.1.3.2. Medium-Voltage
- 8.2.1.4. Power Panels and Components
- 8.2.1.5. Others
- 8.2.2. Power Back up Solutions
- 8.2.2.1. UPS
- 8.2.2.2. Generators
- 8.2.3. Service
- 8.2.1. Power Distribution Solution
- 8.3. Market Analysis, Insights and Forecast - by Power Distribution Solution
- 8.3.1. PDU: Basic & Smart - Metered & Switched solutions
- 8.3.2. Transfer Switches
- 8.3.2.1. Static
- 8.3.2.2. Automatic (ATS)
- 8.3.3. Switchgear
- 8.3.3.1. Low-Voltage
- 8.3.3.2. Medium-Voltage
- 8.3.4. Power Panels and Components
- 8.3.5. Others
- 8.4. Market Analysis, Insights and Forecast - by Power Back up Solutions
- 8.4.1. UPS
- 8.4.2. Generators
- 8.5. Market Analysis, Insights and Forecast - by Service
- 8.6. Market Analysis, Insights and Forecast - by Mechanical Infrastructure
- 8.6.1. Cooling Systems
- 8.6.1.1. Immersion Cooling
- 8.6.1.2. Direct-To-Chip Cooling
- 8.6.1.3. Rear Door Heat Exchanger
- 8.6.1.4. In-Row and In-Rack Cooling
- 8.6.1.5. Racks
- 8.6.1.6. Other Mechanical Infrastructure
- 8.6.1. Cooling Systems
- 8.7. Market Analysis, Insights and Forecast - by Cooling Systems
- 8.7.1. Immersion Cooling
- 8.7.2. Direct-To-Chip Cooling
- 8.7.3. Rear Door Heat Exchanger
- 8.7.4. In-Row and In-Rack Cooling
- 8.7.5. Racks
- 8.7.6. Other Mechanical Infrastructure
- 8.8. Market Analysis, Insights and Forecast - by General Construction
- 8.9. Market Analysis, Insights and Forecast - by Tier Type
- 8.9.1. Tier I and II
- 8.9.2. Tier-III
- 8.9.3. Tier-IV
- 8.10. Market Analysis, Insights and Forecast - by Tier I and II
- 8.11. Market Analysis, Insights and Forecast - by Tier-III
- 8.12. Market Analysis, Insights and Forecast - by Tier-IV
- 8.13. Market Analysis, Insights and Forecast - by End User
- 8.13.1. Banking, Financial Services, and Insurance
- 8.13.2. IT and Telecommunications
- 8.13.3. Government and Defense
- 8.13.4. Healthcare
- 8.13.5. Other End Users
- 8.14. Market Analysis, Insights and Forecast - by Banking, Financial Services, and Insurance
- 8.15. Market Analysis, Insights and Forecast - by IT and Telecommunications
- 8.16. Market Analysis, Insights and Forecast - by Government and Defense
- 8.17. Market Analysis, Insights and Forecast - by Healthcare
- 8.18. Market Analysis, Insights and Forecast - by Other End Users
- 8.19. Market Analysis, Insights and Forecast - by China
- 8.20. Market Analysis, Insights and Forecast - by India
- 8.21. Market Analysis, Insights and Forecast - by Japan
- 8.22. Market Analysis, Insights and Forecast - by Australia
- 8.23. Market Analysis, Insights and Forecast - by Indonesia
- 8.24. Market Analysis, Insights and Forecast - by Data Center Size
- 8.24.1. Small
- 8.24.2. Medium
- 8.24.3. Large
- 8.24.4. Massive
- 8.24.5. Mega
- 8.25. Market Analysis, Insights and Forecast - by Small
- 8.26. Market Analysis, Insights and Forecast - by Medium
- 8.27. Market Analysis, Insights and Forecast - by Large
- 8.28. Market Analysis, Insights and Forecast - by Massive
- 8.29. Market Analysis, Insights and Forecast - by Mega
- 8.1. Market Analysis, Insights and Forecast - by Infrastructure
- 9. Middle East & Africa APAC Data Center Construction Market Analysis, Insights and Forecast, 2019-2031
- 9.1. Market Analysis, Insights and Forecast - by Infrastructure
- 9.1.1. Market Segmentation - By Electrical Infrastructure
- 9.1.1.1. Power Distribution Solution
- 9.1.1.1.1. PDU: Basic & Smart - Metered & Switched solutions
- 9.1.1.1.2. Transfer Switches
- 9.1.1.1.2.1. Static
- 9.1.1.1.2.2. Automatic (ATS)
- 9.1.1.1.3. Switchgear
- 9.1.1.1.3.1. Low-Voltage
- 9.1.1.1.3.2. Medium-Voltage
- 9.1.1.1.4. Power Panels and Components
- 9.1.1.1.5. Others
- 9.1.1.2. Power Back up Solutions
- 9.1.1.2.1. UPS
- 9.1.1.2.2. Generators
- 9.1.1.3. Service
- 9.1.1.1. Power Distribution Solution
- 9.1.2. Market Segmentation - By Mechanical Infrastructure
- 9.1.2.1. Cooling Systems
- 9.1.2.1.1. Immersion Cooling
- 9.1.2.1.2. Direct-To-Chip Cooling
- 9.1.2.1.3. Rear Door Heat Exchanger
- 9.1.2.1.4. In-Row and In-Rack Cooling
- 9.1.2.1.5. Racks
- 9.1.2.1.6. Other Mechanical Infrastructure
- 9.1.2.1. Cooling Systems
- 9.1.3. General Construction
- 9.1.1. Market Segmentation - By Electrical Infrastructure
- 9.2. Market Analysis, Insights and Forecast - by Electrical Infrastructure
- 9.2.1. Power Distribution Solution
- 9.2.1.1. PDU: Basic & Smart - Metered & Switched solutions
- 9.2.1.2. Transfer Switches
- 9.2.1.2.1. Static
- 9.2.1.2.2. Automatic (ATS)
- 9.2.1.3. Switchgear
- 9.2.1.3.1. Low-Voltage
- 9.2.1.3.2. Medium-Voltage
- 9.2.1.4. Power Panels and Components
- 9.2.1.5. Others
- 9.2.2. Power Back up Solutions
- 9.2.2.1. UPS
- 9.2.2.2. Generators
- 9.2.3. Service
- 9.2.1. Power Distribution Solution
- 9.3. Market Analysis, Insights and Forecast - by Power Distribution Solution
- 9.3.1. PDU: Basic & Smart - Metered & Switched solutions
- 9.3.2. Transfer Switches
- 9.3.2.1. Static
- 9.3.2.2. Automatic (ATS)
- 9.3.3. Switchgear
- 9.3.3.1. Low-Voltage
- 9.3.3.2. Medium-Voltage
- 9.3.4. Power Panels and Components
- 9.3.5. Others
- 9.4. Market Analysis, Insights and Forecast - by Power Back up Solutions
- 9.4.1. UPS
- 9.4.2. Generators
- 9.5. Market Analysis, Insights and Forecast - by Service
- 9.6. Market Analysis, Insights and Forecast - by Mechanical Infrastructure
- 9.6.1. Cooling Systems
- 9.6.1.1. Immersion Cooling
- 9.6.1.2. Direct-To-Chip Cooling
- 9.6.1.3. Rear Door Heat Exchanger
- 9.6.1.4. In-Row and In-Rack Cooling
- 9.6.1.5. Racks
- 9.6.1.6. Other Mechanical Infrastructure
- 9.6.1. Cooling Systems
- 9.7. Market Analysis, Insights and Forecast - by Cooling Systems
- 9.7.1. Immersion Cooling
- 9.7.2. Direct-To-Chip Cooling
- 9.7.3. Rear Door Heat Exchanger
- 9.7.4. In-Row and In-Rack Cooling
- 9.7.5. Racks
- 9.7.6. Other Mechanical Infrastructure
- 9.8. Market Analysis, Insights and Forecast - by General Construction
- 9.9. Market Analysis, Insights and Forecast - by Tier Type
- 9.9.1. Tier I and II
- 9.9.2. Tier-III
- 9.9.3. Tier-IV
- 9.10. Market Analysis, Insights and Forecast - by Tier I and II
- 9.11. Market Analysis, Insights and Forecast - by Tier-III
- 9.12. Market Analysis, Insights and Forecast - by Tier-IV
- 9.13. Market Analysis, Insights and Forecast - by End User
- 9.13.1. Banking, Financial Services, and Insurance
- 9.13.2. IT and Telecommunications
- 9.13.3. Government and Defense
- 9.13.4. Healthcare
- 9.13.5. Other End Users
- 9.14. Market Analysis, Insights and Forecast - by Banking, Financial Services, and Insurance
- 9.15. Market Analysis, Insights and Forecast - by IT and Telecommunications
- 9.16. Market Analysis, Insights and Forecast - by Government and Defense
- 9.17. Market Analysis, Insights and Forecast - by Healthcare
- 9.18. Market Analysis, Insights and Forecast - by Other End Users
- 9.19. Market Analysis, Insights and Forecast - by China
- 9.20. Market Analysis, Insights and Forecast - by India
- 9.21. Market Analysis, Insights and Forecast - by Japan
- 9.22. Market Analysis, Insights and Forecast - by Australia
- 9.23. Market Analysis, Insights and Forecast - by Indonesia
- 9.24. Market Analysis, Insights and Forecast - by Data Center Size
- 9.24.1. Small
- 9.24.2. Medium
- 9.24.3. Large
- 9.24.4. Massive
- 9.24.5. Mega
- 9.25. Market Analysis, Insights and Forecast - by Small
- 9.26. Market Analysis, Insights and Forecast - by Medium
- 9.27. Market Analysis, Insights and Forecast - by Large
- 9.28. Market Analysis, Insights and Forecast - by Massive
- 9.29. Market Analysis, Insights and Forecast - by Mega
- 9.1. Market Analysis, Insights and Forecast - by Infrastructure
- 10. Asia Pacific APAC Data Center Construction Market Analysis, Insights and Forecast, 2019-2031
- 10.1. Market Analysis, Insights and Forecast - by Infrastructure
- 10.1.1. Market Segmentation - By Electrical Infrastructure
- 10.1.1.1. Power Distribution Solution
- 10.1.1.1.1. PDU: Basic & Smart - Metered & Switched solutions
- 10.1.1.1.2. Transfer Switches
- 10.1.1.1.2.1. Static
- 10.1.1.1.2.2. Automatic (ATS)
- 10.1.1.1.3. Switchgear
- 10.1.1.1.3.1. Low-Voltage
- 10.1.1.1.3.2. Medium-Voltage
- 10.1.1.1.4. Power Panels and Components
- 10.1.1.1.5. Others
- 10.1.1.2. Power Back up Solutions
- 10.1.1.2.1. UPS
- 10.1.1.2.2. Generators
- 10.1.1.3. Service
- 10.1.1.1. Power Distribution Solution
- 10.1.2. Market Segmentation - By Mechanical Infrastructure
- 10.1.2.1. Cooling Systems
- 10.1.2.1.1. Immersion Cooling
- 10.1.2.1.2. Direct-To-Chip Cooling
- 10.1.2.1.3. Rear Door Heat Exchanger
- 10.1.2.1.4. In-Row and In-Rack Cooling
- 10.1.2.1.5. Racks
- 10.1.2.1.6. Other Mechanical Infrastructure
- 10.1.2.1. Cooling Systems
- 10.1.3. General Construction
- 10.1.1. Market Segmentation - By Electrical Infrastructure
- 10.2. Market Analysis, Insights and Forecast - by Electrical Infrastructure
- 10.2.1. Power Distribution Solution
- 10.2.1.1. PDU: Basic & Smart - Metered & Switched solutions
- 10.2.1.2. Transfer Switches
- 10.2.1.2.1. Static
- 10.2.1.2.2. Automatic (ATS)
- 10.2.1.3. Switchgear
- 10.2.1.3.1. Low-Voltage
- 10.2.1.3.2. Medium-Voltage
- 10.2.1.4. Power Panels and Components
- 10.2.1.5. Others
- 10.2.2. Power Back up Solutions
- 10.2.2.1. UPS
- 10.2.2.2. Generators
- 10.2.3. Service
- 10.2.1. Power Distribution Solution
- 10.3. Market Analysis, Insights and Forecast - by Power Distribution Solution
- 10.3.1. PDU: Basic & Smart - Metered & Switched solutions
- 10.3.2. Transfer Switches
- 10.3.2.1. Static
- 10.3.2.2. Automatic (ATS)
- 10.3.3. Switchgear
- 10.3.3.1. Low-Voltage
- 10.3.3.2. Medium-Voltage
- 10.3.4. Power Panels and Components
- 10.3.5. Others
- 10.4. Market Analysis, Insights and Forecast - by Power Back up Solutions
- 10.4.1. UPS
- 10.4.2. Generators
- 10.5. Market Analysis, Insights and Forecast - by Service
- 10.6. Market Analysis, Insights and Forecast - by Mechanical Infrastructure
- 10.6.1. Cooling Systems
- 10.6.1.1. Immersion Cooling
- 10.6.1.2. Direct-To-Chip Cooling
- 10.6.1.3. Rear Door Heat Exchanger
- 10.6.1.4. In-Row and In-Rack Cooling
- 10.6.1.5. Racks
- 10.6.1.6. Other Mechanical Infrastructure
- 10.6.1. Cooling Systems
- 10.7. Market Analysis, Insights and Forecast - by Cooling Systems
- 10.7.1. Immersion Cooling
- 10.7.2. Direct-To-Chip Cooling
- 10.7.3. Rear Door Heat Exchanger
- 10.7.4. In-Row and In-Rack Cooling
- 10.7.5. Racks
- 10.7.6. Other Mechanical Infrastructure
- 10.8. Market Analysis, Insights and Forecast - by General Construction
- 10.9. Market Analysis, Insights and Forecast - by Tier Type
- 10.9.1. Tier I and II
- 10.9.2. Tier-III
- 10.9.3. Tier-IV
- 10.10. Market Analysis, Insights and Forecast - by Tier I and II
- 10.11. Market Analysis, Insights and Forecast - by Tier-III
- 10.12. Market Analysis, Insights and Forecast - by Tier-IV
- 10.13. Market Analysis, Insights and Forecast - by End User
- 10.13.1. Banking, Financial Services, and Insurance
- 10.13.2. IT and Telecommunications
- 10.13.3. Government and Defense
- 10.13.4. Healthcare
- 10.13.5. Other End Users
- 10.14. Market Analysis, Insights and Forecast - by Banking, Financial Services, and Insurance
- 10.15. Market Analysis, Insights and Forecast - by IT and Telecommunications
- 10.16. Market Analysis, Insights and Forecast - by Government and Defense
- 10.17. Market Analysis, Insights and Forecast - by Healthcare
- 10.18. Market Analysis, Insights and Forecast - by Other End Users
- 10.19. Market Analysis, Insights and Forecast - by China
- 10.20. Market Analysis, Insights and Forecast - by India
- 10.21. Market Analysis, Insights and Forecast - by Japan
- 10.22. Market Analysis, Insights and Forecast - by Australia
- 10.23. Market Analysis, Insights and Forecast - by Indonesia
- 10.24. Market Analysis, Insights and Forecast - by Data Center Size
- 10.24.1. Small
- 10.24.2. Medium
- 10.24.3. Large
- 10.24.4. Massive
- 10.24.5. Mega
- 10.25. Market Analysis, Insights and Forecast - by Small
- 10.26. Market Analysis, Insights and Forecast - by Medium
- 10.27. Market Analysis, Insights and Forecast - by Large
- 10.28. Market Analysis, Insights and Forecast - by Massive
- 10.29. Market Analysis, Insights and Forecast - by Mega
- 10.1. Market Analysis, Insights and Forecast - by Infrastructure
- 11. Saudi Arabia APAC Data Center Construction Market Analysis, Insights and Forecast, 2019-2031
- 11.1. Market Analysis, Insights and Forecast - By Country/Sub-region
- 11.1.1.
- 12. United Arab Emirates APAC Data Center Construction Market Analysis, Insights and Forecast, 2019-2031
- 12.1. Market Analysis, Insights and Forecast - By Country/Sub-region
- 12.1.1.
- 13. Israel APAC Data Center Construction Market Analysis, Insights and Forecast, 2019-2031
- 13.1. Market Analysis, Insights and Forecast - By Country/Sub-region
- 13.1.1.
- 14. Rest of Middle East APAC Data Center Construction Market Analysis, Insights and Forecast, 2019-2031
- 14.1. Market Analysis, Insights and Forecast - By Country/Sub-region
- 14.1.1.
- 15. Competitive Analysis
- 15.1. Global Market Share Analysis 2024
- 15.2. Company Profiles
- 15.2.1 SAS Institute Inc
- 15.2.1.1. Overview
- 15.2.1.2. Products
- 15.2.1.3. SWOT Analysis
- 15.2.1.4. Recent Developments
- 15.2.1.5. Financials (Based on Availability)
- 15.2.2 Fortis Construction
- 15.2.2.1. Overview
- 15.2.2.2. Products
- 15.2.2.3. SWOT Analysis
- 15.2.2.4. Recent Developments
- 15.2.2.5. Financials (Based on Availability)
- 15.2.3 Aueron Group
- 15.2.3.1. Overview
- 15.2.3.2. Products
- 15.2.3.3. SWOT Analysis
- 15.2.3.4. Recent Developments
- 15.2.3.5. Financials (Based on Availability)
- 15.2.4 JE Dunn Construction Group Inc
- 15.2.4.1. Overview
- 15.2.4.2. Products
- 15.2.4.3. SWOT Analysis
- 15.2.4.4. Recent Developments
- 15.2.4.5. Financials (Based on Availability)
- 15.2.5 Hutchinson Builders
- 15.2.5.1. Overview
- 15.2.5.2. Products
- 15.2.5.3. SWOT Analysis
- 15.2.5.4. Recent Developments
- 15.2.5.5. Financials (Based on Availability)
- 15.2.6 Kienta Engineering Construction
- 15.2.6.1. Overview
- 15.2.6.2. Products
- 15.2.6.3. SWOT Analysis
- 15.2.6.4. Recent Developments
- 15.2.6.5. Financials (Based on Availability)
- 15.2.7 DSCO Group
- 15.2.7.1. Overview
- 15.2.7.2. Products
- 15.2.7.3. SWOT Analysis
- 15.2.7.4. Recent Developments
- 15.2.7.5. Financials (Based on Availability)
- 15.2.8 IBM Corporation
- 15.2.8.1. Overview
- 15.2.8.2. Products
- 15.2.8.3. SWOT Analysis
- 15.2.8.4. Recent Developments
- 15.2.8.5. Financials (Based on Availability)
- 15.2.9 Sato Kogyo
- 15.2.9.1. Overview
- 15.2.9.2. Products
- 15.2.9.3. SWOT Analysis
- 15.2.9.4. Recent Developments
- 15.2.9.5. Financials (Based on Availability)
- 15.2.10 Nakano Corporation
- 15.2.10.1. Overview
- 15.2.10.2. Products
- 15.2.10.3. SWOT Analysis
- 15.2.10.4. Recent Developments
- 15.2.10.5. Financials (Based on Availability)
- 15.2.11 Gammon Construction
- 15.2.11.1. Overview
- 15.2.11.2. Products
- 15.2.11.3. SWOT Analysis
- 15.2.11.4. Recent Developments
- 15.2.11.5. Financials (Based on Availability)
- 15.2.12 Studio one Design
- 15.2.12.1. Overview
- 15.2.12.2. Products
- 15.2.12.3. SWOT Analysis
- 15.2.12.4. Recent Developments
- 15.2.12.5. Financials (Based on Availability)
- 15.2.13 Powerware Systems
- 15.2.13.1. Overview
- 15.2.13.2. Products
- 15.2.13.3. SWOT Analysis
- 15.2.13.4. Recent Developments
- 15.2.13.5. Financials (Based on Availability)
- 15.2.14 Turner Construction Co
- 15.2.14.1. Overview
- 15.2.14.2. Products
- 15.2.14.3. SWOT Analysis
- 15.2.14.4. Recent Developments
- 15.2.14.5. Financials (Based on Availability)
- 15.2.15 DPR Construction Inc
- 15.2.15.1. Overview
- 15.2.15.2. Products
- 15.2.15.3. SWOT Analysis
- 15.2.15.4. Recent Developments
- 15.2.15.5. Financials (Based on Availability)
- 15.2.16 Hensel Phelps Construction Co Inc
- 15.2.16.1. Overview
- 15.2.16.2. Products
- 15.2.16.3. SWOT Analysis
- 15.2.16.4. Recent Developments
- 15.2.16.5. Financials (Based on Availability)
- 15.2.17 Obayashi Corporation
- 15.2.17.1. Overview
- 15.2.17.2. Products
- 15.2.17.3. SWOT Analysis
- 15.2.17.4. Recent Developments
- 15.2.17.5. Financials (Based on Availability)
- 15.2.18 CSF Group
- 15.2.18.1. Overview
- 15.2.18.2. Products
- 15.2.18.3. SWOT Analysis
- 15.2.18.4. Recent Developments
- 15.2.18.5. Financials (Based on Availability)
- 15.2.19 M+W Group
- 15.2.19.1. Overview
- 15.2.19.2. Products
- 15.2.19.3. SWOT Analysis
- 15.2.19.4. Recent Developments
- 15.2.19.5. Financials (Based on Availability)
- 15.2.20 NTT Facillities
- 15.2.20.1. Overview
- 15.2.20.2. Products
- 15.2.20.3. SWOT Analysis
- 15.2.20.4. Recent Developments
- 15.2.20.5. Financials (Based on Availability)
- 15.2.21 AECOM
- 15.2.21.1. Overview
- 15.2.21.2. Products
- 15.2.21.3. SWOT Analysis
- 15.2.21.4. Recent Developments
- 15.2.21.5. Financials (Based on Availability)
- 15.2.1 SAS Institute Inc
List of Figures
- Figure 1: Global APAC Data Center Construction Market Revenue Breakdown (Million, %) by Region 2024 & 2032
- Figure 2: Saudi Arabia APAC Data Center Construction Market Revenue (Million), by Country 2024 & 2032
- Figure 3: Saudi Arabia APAC Data Center Construction Market Revenue Share (%), by Country 2024 & 2032
- Figure 4: United Arab Emirates APAC Data Center Construction Market Revenue (Million), by Country 2024 & 2032
- Figure 5: United Arab Emirates APAC Data Center Construction Market Revenue Share (%), by Country 2024 & 2032
- Figure 6: Israel APAC Data Center Construction Market Revenue (Million), by Country 2024 & 2032
- Figure 7: Israel APAC Data Center Construction Market Revenue Share (%), by Country 2024 & 2032
- Figure 8: Rest of Middle East APAC Data Center Construction Market Revenue (Million), by Country 2024 & 2032
- Figure 9: Rest of Middle East APAC Data Center Construction Market Revenue Share (%), by Country 2024 & 2032
- Figure 10: North America APAC Data Center Construction Market Revenue (Million), by Infrastructure 2024 & 2032
- Figure 11: North America APAC Data Center Construction Market Revenue Share (%), by Infrastructure 2024 & 2032
- Figure 12: North America APAC Data Center Construction Market Revenue (Million), by Electrical Infrastructure 2024 & 2032
- Figure 13: North America APAC Data Center Construction Market Revenue Share (%), by Electrical Infrastructure 2024 & 2032
- Figure 14: North America APAC Data Center Construction Market Revenue (Million), by Power Distribution Solution 2024 & 2032
- Figure 15: North America APAC Data Center Construction Market Revenue Share (%), by Power Distribution Solution 2024 & 2032
- Figure 16: North America APAC Data Center Construction Market Revenue (Million), by Power Back up Solutions 2024 & 2032
- Figure 17: North America APAC Data Center Construction Market Revenue Share (%), by Power Back up Solutions 2024 & 2032
- Figure 18: North America APAC Data Center Construction Market Revenue (Million), by Service 2024 & 2032
- Figure 19: North America APAC Data Center Construction Market Revenue Share (%), by Service 2024 & 2032
- Figure 20: North America APAC Data Center Construction Market Revenue (Million), by Mechanical Infrastructure 2024 & 2032
- Figure 21: North America APAC Data Center Construction Market Revenue Share (%), by Mechanical Infrastructure 2024 & 2032
- Figure 22: North America APAC Data Center Construction Market Revenue (Million), by Cooling Systems 2024 & 2032
- Figure 23: North America APAC Data Center Construction Market Revenue Share (%), by Cooling Systems 2024 & 2032
- Figure 24: North America APAC Data Center Construction Market Revenue (Million), by General Construction 2024 & 2032
- Figure 25: North America APAC Data Center Construction Market Revenue Share (%), by General Construction 2024 & 2032
- Figure 26: North America APAC Data Center Construction Market Revenue (Million), by Tier Type 2024 & 2032
- Figure 27: North America APAC Data Center Construction Market Revenue Share (%), by Tier Type 2024 & 2032
- Figure 28: North America APAC Data Center Construction Market Revenue (Million), by Tier I and II 2024 & 2032
- Figure 29: North America APAC Data Center Construction Market Revenue Share (%), by Tier I and II 2024 & 2032
- Figure 30: North America APAC Data Center Construction Market Revenue (Million), by Tier-III 2024 & 2032
- Figure 31: North America APAC Data Center Construction Market Revenue Share (%), by Tier-III 2024 & 2032
- Figure 32: North America APAC Data Center Construction Market Revenue (Million), by Tier-IV 2024 & 2032
- Figure 33: North America APAC Data Center Construction Market Revenue Share (%), by Tier-IV 2024 & 2032
- Figure 34: North America APAC Data Center Construction Market Revenue (Million), by End User 2024 & 2032
- Figure 35: North America APAC Data Center Construction Market Revenue Share (%), by End User 2024 & 2032
- Figure 36: North America APAC Data Center Construction Market Revenue (Million), by Banking, Financial Services, and Insurance 2024 & 2032
- Figure 37: North America APAC Data Center Construction Market Revenue Share (%), by Banking, Financial Services, and Insurance 2024 & 2032
- Figure 38: North America APAC Data Center Construction Market Revenue (Million), by IT and Telecommunications 2024 & 2032
- Figure 39: North America APAC Data Center Construction Market Revenue Share (%), by IT and Telecommunications 2024 & 2032
- Figure 40: North America APAC Data Center Construction Market Revenue (Million), by Government and Defense 2024 & 2032
- Figure 41: North America APAC Data Center Construction Market Revenue Share (%), by Government and Defense 2024 & 2032
- Figure 42: North America APAC Data Center Construction Market Revenue (Million), by Healthcare 2024 & 2032
- Figure 43: North America APAC Data Center Construction Market Revenue Share (%), by Healthcare 2024 & 2032
- Figure 44: North America APAC Data Center Construction Market Revenue (Million), by Other End Users 2024 & 2032
- Figure 45: North America APAC Data Center Construction Market Revenue Share (%), by Other End Users 2024 & 2032
- Figure 46: North America APAC Data Center Construction Market Revenue (Million), by China 2024 & 2032
- Figure 47: North America APAC Data Center Construction Market Revenue Share (%), by China 2024 & 2032
- Figure 48: North America APAC Data Center Construction Market Revenue (Million), by India 2024 & 2032
- Figure 49: North America APAC Data Center Construction Market Revenue Share (%), by India 2024 & 2032
- Figure 50: North America APAC Data Center Construction Market Revenue (Million), by Japan 2024 & 2032
- Figure 51: North America APAC Data Center Construction Market Revenue Share (%), by Japan 2024 & 2032
- Figure 52: North America APAC Data Center Construction Market Revenue (Million), by Australia 2024 & 2032
- Figure 53: North America APAC Data Center Construction Market Revenue Share (%), by Australia 2024 & 2032
- Figure 54: North America APAC Data Center Construction Market Revenue (Million), by Indonesia 2024 & 2032
- Figure 55: North America APAC Data Center Construction Market Revenue Share (%), by Indonesia 2024 & 2032
- Figure 56: North America APAC Data Center Construction Market Revenue (Million), by Data Center Size 2024 & 2032
- Figure 57: North America APAC Data Center Construction Market Revenue Share (%), by Data Center Size 2024 & 2032
- Figure 58: North America APAC Data Center Construction Market Revenue (Million), by Small 2024 & 2032
- Figure 59: North America APAC Data Center Construction Market Revenue Share (%), by Small 2024 & 2032
- Figure 60: North America APAC Data Center Construction Market Revenue (Million), by Medium 2024 & 2032
- Figure 61: North America APAC Data Center Construction Market Revenue Share (%), by Medium 2024 & 2032
- Figure 62: North America APAC Data Center Construction Market Revenue (Million), by Large 2024 & 2032
- Figure 63: North America APAC Data Center Construction Market Revenue Share (%), by Large 2024 & 2032
- Figure 64: North America APAC Data Center Construction Market Revenue (Million), by Massive 2024 & 2032
- Figure 65: North America APAC Data Center Construction Market Revenue Share (%), by Massive 2024 & 2032
- Figure 66: North America APAC Data Center Construction Market Revenue (Million), by Mega 2024 & 2032
- Figure 67: North America APAC Data Center Construction Market Revenue Share (%), by Mega 2024 & 2032
- Figure 68: North America APAC Data Center Construction Market Revenue (Million), by Country 2024 & 2032
- Figure 69: North America APAC Data Center Construction Market Revenue Share (%), by Country 2024 & 2032
- Figure 70: South America APAC Data Center Construction Market Revenue (Million), by Infrastructure 2024 & 2032
- Figure 71: South America APAC Data Center Construction Market Revenue Share (%), by Infrastructure 2024 & 2032
- Figure 72: South America APAC Data Center Construction Market Revenue (Million), by Electrical Infrastructure 2024 & 2032
- Figure 73: South America APAC Data Center Construction Market Revenue Share (%), by Electrical Infrastructure 2024 & 2032
- Figure 74: South America APAC Data Center Construction Market Revenue (Million), by Power Distribution Solution 2024 & 2032
- Figure 75: South America APAC Data Center Construction Market Revenue Share (%), by Power Distribution Solution 2024 & 2032
- Figure 76: South America APAC Data Center Construction Market Revenue (Million), by Power Back up Solutions 2024 & 2032
- Figure 77: South America APAC Data Center Construction Market Revenue Share (%), by Power Back up Solutions 2024 & 2032
- Figure 78: South America APAC Data Center Construction Market Revenue (Million), by Service 2024 & 2032
- Figure 79: South America APAC Data Center Construction Market Revenue Share (%), by Service 2024 & 2032
- Figure 80: South America APAC Data Center Construction Market Revenue (Million), by Mechanical Infrastructure 2024 & 2032
- Figure 81: South America APAC Data Center Construction Market Revenue Share (%), by Mechanical Infrastructure 2024 & 2032
- Figure 82: South America APAC Data Center Construction Market Revenue (Million), by Cooling Systems 2024 & 2032
- Figure 83: South America APAC Data Center Construction Market Revenue Share (%), by Cooling Systems 2024 & 2032
- Figure 84: South America APAC Data Center Construction Market Revenue (Million), by General Construction 2024 & 2032
- Figure 85: South America APAC Data Center Construction Market Revenue Share (%), by General Construction 2024 & 2032
- Figure 86: South America APAC Data Center Construction Market Revenue (Million), by Tier Type 2024 & 2032
- Figure 87: South America APAC Data Center Construction Market Revenue Share (%), by Tier Type 2024 & 2032
- Figure 88: South America APAC Data Center Construction Market Revenue (Million), by Tier I and II 2024 & 2032
- Figure 89: South America APAC Data Center Construction Market Revenue Share (%), by Tier I and II 2024 & 2032
- Figure 90: South America APAC Data Center Construction Market Revenue (Million), by Tier-III 2024 & 2032
- Figure 91: South America APAC Data Center Construction Market Revenue Share (%), by Tier-III 2024 & 2032
- Figure 92: South America APAC Data Center Construction Market Revenue (Million), by Tier-IV 2024 & 2032
- Figure 93: South America APAC Data Center Construction Market Revenue Share (%), by Tier-IV 2024 & 2032
- Figure 94: South America APAC Data Center Construction Market Revenue (Million), by End User 2024 & 2032
- Figure 95: South America APAC Data Center Construction Market Revenue Share (%), by End User 2024 & 2032
- Figure 96: South America APAC Data Center Construction Market Revenue (Million), by Banking, Financial Services, and Insurance 2024 & 2032
- Figure 97: South America APAC Data Center Construction Market Revenue Share (%), by Banking, Financial Services, and Insurance 2024 & 2032
- Figure 98: South America APAC Data Center Construction Market Revenue (Million), by IT and Telecommunications 2024 & 2032
- Figure 99: South America APAC Data Center Construction Market Revenue Share (%), by IT and Telecommunications 2024 & 2032
- Figure 100: South America APAC Data Center Construction Market Revenue (Million), by Government and Defense 2024 & 2032
- Figure 101: South America APAC Data Center Construction Market Revenue Share (%), by Government and Defense 2024 & 2032
- Figure 102: South America APAC Data Center Construction Market Revenue (Million), by Healthcare 2024 & 2032
- Figure 103: South America APAC Data Center Construction Market Revenue Share (%), by Healthcare 2024 & 2032
- Figure 104: South America APAC Data Center Construction Market Revenue (Million), by Other End Users 2024 & 2032
- Figure 105: South America APAC Data Center Construction Market Revenue Share (%), by Other End Users 2024 & 2032
- Figure 106: South America APAC Data Center Construction Market Revenue (Million), by China 2024 & 2032
- Figure 107: South America APAC Data Center Construction Market Revenue Share (%), by China 2024 & 2032
- Figure 108: South America APAC Data Center Construction Market Revenue (Million), by India 2024 & 2032
- Figure 109: South America APAC Data Center Construction Market Revenue Share (%), by India 2024 & 2032
- Figure 110: South America APAC Data Center Construction Market Revenue (Million), by Japan 2024 & 2032
- Figure 111: South America APAC Data Center Construction Market Revenue Share (%), by Japan 2024 & 2032
- Figure 112: South America APAC Data Center Construction Market Revenue (Million), by Australia 2024 & 2032
- Figure 113: South America APAC Data Center Construction Market Revenue Share (%), by Australia 2024 & 2032
- Figure 114: South America APAC Data Center Construction Market Revenue (Million), by Indonesia 2024 & 2032
- Figure 115: South America APAC Data Center Construction Market Revenue Share (%), by Indonesia 2024 & 2032
- Figure 116: South America APAC Data Center Construction Market Revenue (Million), by Data Center Size 2024 & 2032
- Figure 117: South America APAC Data Center Construction Market Revenue Share (%), by Data Center Size 2024 & 2032
- Figure 118: South America APAC Data Center Construction Market Revenue (Million), by Small 2024 & 2032
- Figure 119: South America APAC Data Center Construction Market Revenue Share (%), by Small 2024 & 2032
- Figure 120: South America APAC Data Center Construction Market Revenue (Million), by Medium 2024 & 2032
- Figure 121: South America APAC Data Center Construction Market Revenue Share (%), by Medium 2024 & 2032
- Figure 122: South America APAC Data Center Construction Market Revenue (Million), by Large 2024 & 2032
- Figure 123: South America APAC Data Center Construction Market Revenue Share (%), by Large 2024 & 2032
- Figure 124: South America APAC Data Center Construction Market Revenue (Million), by Massive 2024 & 2032
- Figure 125: South America APAC Data Center Construction Market Revenue Share (%), by Massive 2024 & 2032
- Figure 126: South America APAC Data Center Construction Market Revenue (Million), by Mega 2024 & 2032
- Figure 127: South America APAC Data Center Construction Market Revenue Share (%), by Mega 2024 & 2032
- Figure 128: South America APAC Data Center Construction Market Revenue (Million), by Country 2024 & 2032
- Figure 129: South America APAC Data Center Construction Market Revenue Share (%), by Country 2024 & 2032
- Figure 130: Europe APAC Data Center Construction Market Revenue (Million), by Infrastructure 2024 & 2032
- Figure 131: Europe APAC Data Center Construction Market Revenue Share (%), by Infrastructure 2024 & 2032
- Figure 132: Europe APAC Data Center Construction Market Revenue (Million), by Electrical Infrastructure 2024 & 2032
- Figure 133: Europe APAC Data Center Construction Market Revenue Share (%), by Electrical Infrastructure 2024 & 2032
- Figure 134: Europe APAC Data Center Construction Market Revenue (Million), by Power Distribution Solution 2024 & 2032
- Figure 135: Europe APAC Data Center Construction Market Revenue Share (%), by Power Distribution Solution 2024 & 2032
- Figure 136: Europe APAC Data Center Construction Market Revenue (Million), by Power Back up Solutions 2024 & 2032
- Figure 137: Europe APAC Data Center Construction Market Revenue Share (%), by Power Back up Solutions 2024 & 2032
- Figure 138: Europe APAC Data Center Construction Market Revenue (Million), by Service 2024 & 2032
- Figure 139: Europe APAC Data Center Construction Market Revenue Share (%), by Service 2024 & 2032
- Figure 140: Europe APAC Data Center Construction Market Revenue (Million), by Mechanical Infrastructure 2024 & 2032
- Figure 141: Europe APAC Data Center Construction Market Revenue Share (%), by Mechanical Infrastructure 2024 & 2032
- Figure 142: Europe APAC Data Center Construction Market Revenue (Million), by Cooling Systems 2024 & 2032
- Figure 143: Europe APAC Data Center Construction Market Revenue Share (%), by Cooling Systems 2024 & 2032
- Figure 144: Europe APAC Data Center Construction Market Revenue (Million), by General Construction 2024 & 2032
- Figure 145: Europe APAC Data Center Construction Market Revenue Share (%), by General Construction 2024 & 2032
- Figure 146: Europe APAC Data Center Construction Market Revenue (Million), by Tier Type 2024 & 2032
- Figure 147: Europe APAC Data Center Construction Market Revenue Share (%), by Tier Type 2024 & 2032
- Figure 148: Europe APAC Data Center Construction Market Revenue (Million), by Tier I and II 2024 & 2032
- Figure 149: Europe APAC Data Center Construction Market Revenue Share (%), by Tier I and II 2024 & 2032
- Figure 150: Europe APAC Data Center Construction Market Revenue (Million), by Tier-III 2024 & 2032
- Figure 151: Europe APAC Data Center Construction Market Revenue Share (%), by Tier-III 2024 & 2032
- Figure 152: Europe APAC Data Center Construction Market Revenue (Million), by Tier-IV 2024 & 2032
- Figure 153: Europe APAC Data Center Construction Market Revenue Share (%), by Tier-IV 2024 & 2032
- Figure 154: Europe APAC Data Center Construction Market Revenue (Million), by End User 2024 & 2032
- Figure 155: Europe APAC Data Center Construction Market Revenue Share (%), by End User 2024 & 2032
- Figure 156: Europe APAC Data Center Construction Market Revenue (Million), by Banking, Financial Services, and Insurance 2024 & 2032
- Figure 157: Europe APAC Data Center Construction Market Revenue Share (%), by Banking, Financial Services, and Insurance 2024 & 2032
- Figure 158: Europe APAC Data Center Construction Market Revenue (Million), by IT and Telecommunications 2024 & 2032
- Figure 159: Europe APAC Data Center Construction Market Revenue Share (%), by IT and Telecommunications 2024 & 2032
- Figure 160: Europe APAC Data Center Construction Market Revenue (Million), by Government and Defense 2024 & 2032
- Figure 161: Europe APAC Data Center Construction Market Revenue Share (%), by Government and Defense 2024 & 2032
- Figure 162: Europe APAC Data Center Construction Market Revenue (Million), by Healthcare 2024 & 2032
- Figure 163: Europe APAC Data Center Construction Market Revenue Share (%), by Healthcare 2024 & 2032
- Figure 164: Europe APAC Data Center Construction Market Revenue (Million), by Other End Users 2024 & 2032
- Figure 165: Europe APAC Data Center Construction Market Revenue Share (%), by Other End Users 2024 & 2032
- Figure 166: Europe APAC Data Center Construction Market Revenue (Million), by China 2024 & 2032
- Figure 167: Europe APAC Data Center Construction Market Revenue Share (%), by China 2024 & 2032
- Figure 168: Europe APAC Data Center Construction Market Revenue (Million), by India 2024 & 2032
- Figure 169: Europe APAC Data Center Construction Market Revenue Share (%), by India 2024 & 2032
- Figure 170: Europe APAC Data Center Construction Market Revenue (Million), by Japan 2024 & 2032
- Figure 171: Europe APAC Data Center Construction Market Revenue Share (%), by Japan 2024 & 2032
- Figure 172: Europe APAC Data Center Construction Market Revenue (Million), by Australia 2024 & 2032
- Figure 173: Europe APAC Data Center Construction Market Revenue Share (%), by Australia 2024 & 2032
- Figure 174: Europe APAC Data Center Construction Market Revenue (Million), by Indonesia 2024 & 2032
- Figure 175: Europe APAC Data Center Construction Market Revenue Share (%), by Indonesia 2024 & 2032
- Figure 176: Europe APAC Data Center Construction Market Revenue (Million), by Data Center Size 2024 & 2032
- Figure 177: Europe APAC Data Center Construction Market Revenue Share (%), by Data Center Size 2024 & 2032
- Figure 178: Europe APAC Data Center Construction Market Revenue (Million), by Small 2024 & 2032
- Figure 179: Europe APAC Data Center Construction Market Revenue Share (%), by Small 2024 & 2032
- Figure 180: Europe APAC Data Center Construction Market Revenue (Million), by Medium 2024 & 2032
- Figure 181: Europe APAC Data Center Construction Market Revenue Share (%), by Medium 2024 & 2032
- Figure 182: Europe APAC Data Center Construction Market Revenue (Million), by Large 2024 & 2032
- Figure 183: Europe APAC Data Center Construction Market Revenue Share (%), by Large 2024 & 2032
- Figure 184: Europe APAC Data Center Construction Market Revenue (Million), by Massive 2024 & 2032
- Figure 185: Europe APAC Data Center Construction Market Revenue Share (%), by Massive 2024 & 2032
- Figure 186: Europe APAC Data Center Construction Market Revenue (Million), by Mega 2024 & 2032
- Figure 187: Europe APAC Data Center Construction Market Revenue Share (%), by Mega 2024 & 2032
- Figure 188: Europe APAC Data Center Construction Market Revenue (Million), by Country 2024 & 2032
- Figure 189: Europe APAC Data Center Construction Market Revenue Share (%), by Country 2024 & 2032
- Figure 190: Middle East & Africa APAC Data Center Construction Market Revenue (Million), by Infrastructure 2024 & 2032
- Figure 191: Middle East & Africa APAC Data Center Construction Market Revenue Share (%), by Infrastructure 2024 & 2032
- Figure 192: Middle East & Africa APAC Data Center Construction Market Revenue (Million), by Electrical Infrastructure 2024 & 2032
- Figure 193: Middle East & Africa APAC Data Center Construction Market Revenue Share (%), by Electrical Infrastructure 2024 & 2032
- Figure 194: Middle East & Africa APAC Data Center Construction Market Revenue (Million), by Power Distribution Solution 2024 & 2032
- Figure 195: Middle East & Africa APAC Data Center Construction Market Revenue Share (%), by Power Distribution Solution 2024 & 2032
- Figure 196: Middle East & Africa APAC Data Center Construction Market Revenue (Million), by Power Back up Solutions 2024 & 2032
- Figure 197: Middle East & Africa APAC Data Center Construction Market Revenue Share (%), by Power Back up Solutions 2024 & 2032
- Figure 198: Middle East & Africa APAC Data Center Construction Market Revenue (Million), by Service 2024 & 2032
- Figure 199: Middle East & Africa APAC Data Center Construction Market Revenue Share (%), by Service 2024 & 2032
- Figure 200: Middle East & Africa APAC Data Center Construction Market Revenue (Million), by Mechanical Infrastructure 2024 & 2032
- Figure 201: Middle East & Africa APAC Data Center Construction Market Revenue Share (%), by Mechanical Infrastructure 2024 & 2032
- Figure 202: Middle East & Africa APAC Data Center Construction Market Revenue (Million), by Cooling Systems 2024 & 2032
- Figure 203: Middle East & Africa APAC Data Center Construction Market Revenue Share (%), by Cooling Systems 2024 & 2032
- Figure 204: Middle East & Africa APAC Data Center Construction Market Revenue (Million), by General Construction 2024 & 2032
- Figure 205: Middle East & Africa APAC Data Center Construction Market Revenue Share (%), by General Construction 2024 & 2032
- Figure 206: Middle East & Africa APAC Data Center Construction Market Revenue (Million), by Tier Type 2024 & 2032
- Figure 207: Middle East & Africa APAC Data Center Construction Market Revenue Share (%), by Tier Type 2024 & 2032
- Figure 208: Middle East & Africa APAC Data Center Construction Market Revenue (Million), by Tier I and II 2024 & 2032
- Figure 209: Middle East & Africa APAC Data Center Construction Market Revenue Share (%), by Tier I and II 2024 & 2032
- Figure 210: Middle East & Africa APAC Data Center Construction Market Revenue (Million), by Tier-III 2024 & 2032
- Figure 211: Middle East & Africa APAC Data Center Construction Market Revenue Share (%), by Tier-III 2024 & 2032
- Figure 212: Middle East & Africa APAC Data Center Construction Market Revenue (Million), by Tier-IV 2024 & 2032
- Figure 213: Middle East & Africa APAC Data Center Construction Market Revenue Share (%), by Tier-IV 2024 & 2032
- Figure 214: Middle East & Africa APAC Data Center Construction Market Revenue (Million), by End User 2024 & 2032
- Figure 215: Middle East & Africa APAC Data Center Construction Market Revenue Share (%), by End User 2024 & 2032
- Figure 216: Middle East & Africa APAC Data Center Construction Market Revenue (Million), by Banking, Financial Services, and Insurance 2024 & 2032
- Figure 217: Middle East & Africa APAC Data Center Construction Market Revenue Share (%), by Banking, Financial Services, and Insurance 2024 & 2032
- Figure 218: Middle East & Africa APAC Data Center Construction Market Revenue (Million), by IT and Telecommunications 2024 & 2032
- Figure 219: Middle East & Africa APAC Data Center Construction Market Revenue Share (%), by IT and Telecommunications 2024 & 2032
- Figure 220: Middle East & Africa APAC Data Center Construction Market Revenue (Million), by Government and Defense 2024 & 2032
- Figure 221: Middle East & Africa APAC Data Center Construction Market Revenue Share (%), by Government and Defense 2024 & 2032
- Figure 222: Middle East & Africa APAC Data Center Construction Market Revenue (Million), by Healthcare 2024 & 2032
- Figure 223: Middle East & Africa APAC Data Center Construction Market Revenue Share (%), by Healthcare 2024 & 2032
- Figure 224: Middle East & Africa APAC Data Center Construction Market Revenue (Million), by Other End Users 2024 & 2032
- Figure 225: Middle East & Africa APAC Data Center Construction Market Revenue Share (%), by Other End Users 2024 & 2032
- Figure 226: Middle East & Africa APAC Data Center Construction Market Revenue (Million), by China 2024 & 2032
- Figure 227: Middle East & Africa APAC Data Center Construction Market Revenue Share (%), by China 2024 & 2032
- Figure 228: Middle East & Africa APAC Data Center Construction Market Revenue (Million), by India 2024 & 2032
- Figure 229: Middle East & Africa APAC Data Center Construction Market Revenue Share (%), by India 2024 & 2032
- Figure 230: Middle East & Africa APAC Data Center Construction Market Revenue (Million), by Japan 2024 & 2032
- Figure 231: Middle East & Africa APAC Data Center Construction Market Revenue Share (%), by Japan 2024 & 2032
- Figure 232: Middle East & Africa APAC Data Center Construction Market Revenue (Million), by Australia 2024 & 2032
- Figure 233: Middle East & Africa APAC Data Center Construction Market Revenue Share (%), by Australia 2024 & 2032
- Figure 234: Middle East & Africa APAC Data Center Construction Market Revenue (Million), by Indonesia 2024 & 2032
- Figure 235: Middle East & Africa APAC Data Center Construction Market Revenue Share (%), by Indonesia 2024 & 2032
- Figure 236: Middle East & Africa APAC Data Center Construction Market Revenue (Million), by Data Center Size 2024 & 2032
- Figure 237: Middle East & Africa APAC Data Center Construction Market Revenue Share (%), by Data Center Size 2024 & 2032
- Figure 238: Middle East & Africa APAC Data Center Construction Market Revenue (Million), by Small 2024 & 2032
- Figure 239: Middle East & Africa APAC Data Center Construction Market Revenue Share (%), by Small 2024 & 2032
- Figure 240: Middle East & Africa APAC Data Center Construction Market Revenue (Million), by Medium 2024 & 2032
- Figure 241: Middle East & Africa APAC Data Center Construction Market Revenue Share (%), by Medium 2024 & 2032
- Figure 242: Middle East & Africa APAC Data Center Construction Market Revenue (Million), by Large 2024 & 2032
- Figure 243: Middle East & Africa APAC Data Center Construction Market Revenue Share (%), by Large 2024 & 2032
- Figure 244: Middle East & Africa APAC Data Center Construction Market Revenue (Million), by Massive 2024 & 2032
- Figure 245: Middle East & Africa APAC Data Center Construction Market Revenue Share (%), by Massive 2024 & 2032
- Figure 246: Middle East & Africa APAC Data Center Construction Market Revenue (Million), by Mega 2024 & 2032
- Figure 247: Middle East & Africa APAC Data Center Construction Market Revenue Share (%), by Mega 2024 & 2032
- Figure 248: Middle East & Africa APAC Data Center Construction Market Revenue (Million), by Country 2024 & 2032
- Figure 249: Middle East & Africa APAC Data Center Construction Market Revenue Share (%), by Country 2024 & 2032
- Figure 250: Asia Pacific APAC Data Center Construction Market Revenue (Million), by Infrastructure 2024 & 2032
- Figure 251: Asia Pacific APAC Data Center Construction Market Revenue Share (%), by Infrastructure 2024 & 2032
- Figure 252: Asia Pacific APAC Data Center Construction Market Revenue (Million), by Electrical Infrastructure 2024 & 2032
- Figure 253: Asia Pacific APAC Data Center Construction Market Revenue Share (%), by Electrical Infrastructure 2024 & 2032
- Figure 254: Asia Pacific APAC Data Center Construction Market Revenue (Million), by Power Distribution Solution 2024 & 2032
- Figure 255: Asia Pacific APAC Data Center Construction Market Revenue Share (%), by Power Distribution Solution 2024 & 2032
- Figure 256: Asia Pacific APAC Data Center Construction Market Revenue (Million), by Power Back up Solutions 2024 & 2032
- Figure 257: Asia Pacific APAC Data Center Construction Market Revenue Share (%), by Power Back up Solutions 2024 & 2032
- Figure 258: Asia Pacific APAC Data Center Construction Market Revenue (Million), by Service 2024 & 2032
- Figure 259: Asia Pacific APAC Data Center Construction Market Revenue Share (%), by Service 2024 & 2032
- Figure 260: Asia Pacific APAC Data Center Construction Market Revenue (Million), by Mechanical Infrastructure 2024 & 2032
- Figure 261: Asia Pacific APAC Data Center Construction Market Revenue Share (%), by Mechanical Infrastructure 2024 & 2032
- Figure 262: Asia Pacific APAC Data Center Construction Market Revenue (Million), by Cooling Systems 2024 & 2032
- Figure 263: Asia Pacific APAC Data Center Construction Market Revenue Share (%), by Cooling Systems 2024 & 2032
- Figure 264: Asia Pacific APAC Data Center Construction Market Revenue (Million), by General Construction 2024 & 2032
- Figure 265: Asia Pacific APAC Data Center Construction Market Revenue Share (%), by General Construction 2024 & 2032
- Figure 266: Asia Pacific APAC Data Center Construction Market Revenue (Million), by Tier Type 2024 & 2032
- Figure 267: Asia Pacific APAC Data Center Construction Market Revenue Share (%), by Tier Type 2024 & 2032
- Figure 268: Asia Pacific APAC Data Center Construction Market Revenue (Million), by Tier I and II 2024 & 2032
- Figure 269: Asia Pacific APAC Data Center Construction Market Revenue Share (%), by Tier I and II 2024 & 2032
- Figure 270: Asia Pacific APAC Data Center Construction Market Revenue (Million), by Tier-III 2024 & 2032
- Figure 271: Asia Pacific APAC Data Center Construction Market Revenue Share (%), by Tier-III 2024 & 2032
- Figure 272: Asia Pacific APAC Data Center Construction Market Revenue (Million), by Tier-IV 2024 & 2032
- Figure 273: Asia Pacific APAC Data Center Construction Market Revenue Share (%), by Tier-IV 2024 & 2032
- Figure 274: Asia Pacific APAC Data Center Construction Market Revenue (Million), by End User 2024 & 2032
- Figure 275: Asia Pacific APAC Data Center Construction Market Revenue Share (%), by End User 2024 & 2032
- Figure 276: Asia Pacific APAC Data Center Construction Market Revenue (Million), by Banking, Financial Services, and Insurance 2024 & 2032
- Figure 277: Asia Pacific APAC Data Center Construction Market Revenue Share (%), by Banking, Financial Services, and Insurance 2024 & 2032
- Figure 278: Asia Pacific APAC Data Center Construction Market Revenue (Million), by IT and Telecommunications 2024 & 2032
- Figure 279: Asia Pacific APAC Data Center Construction Market Revenue Share (%), by IT and Telecommunications 2024 & 2032
- Figure 280: Asia Pacific APAC Data Center Construction Market Revenue (Million), by Government and Defense 2024 & 2032
- Figure 281: Asia Pacific APAC Data Center Construction Market Revenue Share (%), by Government and Defense 2024 & 2032
- Figure 282: Asia Pacific APAC Data Center Construction Market Revenue (Million), by Healthcare 2024 & 2032
- Figure 283: Asia Pacific APAC Data Center Construction Market Revenue Share (%), by Healthcare 2024 & 2032
- Figure 284: Asia Pacific APAC Data Center Construction Market Revenue (Million), by Other End Users 2024 & 2032
- Figure 285: Asia Pacific APAC Data Center Construction Market Revenue Share (%), by Other End Users 2024 & 2032
- Figure 286: Asia Pacific APAC Data Center Construction Market Revenue (Million), by China 2024 & 2032
- Figure 287: Asia Pacific APAC Data Center Construction Market Revenue Share (%), by China 2024 & 2032
- Figure 288: Asia Pacific APAC Data Center Construction Market Revenue (Million), by India 2024 & 2032
- Figure 289: Asia Pacific APAC Data Center Construction Market Revenue Share (%), by India 2024 & 2032
- Figure 290: Asia Pacific APAC Data Center Construction Market Revenue (Million), by Japan 2024 & 2032
- Figure 291: Asia Pacific APAC Data Center Construction Market Revenue Share (%), by Japan 2024 & 2032
- Figure 292: Asia Pacific APAC Data Center Construction Market Revenue (Million), by Australia 2024 & 2032
- Figure 293: Asia Pacific APAC Data Center Construction Market Revenue Share (%), by Australia 2024 & 2032
- Figure 294: Asia Pacific APAC Data Center Construction Market Revenue (Million), by Indonesia 2024 & 2032
- Figure 295: Asia Pacific APAC Data Center Construction Market Revenue Share (%), by Indonesia 2024 & 2032
- Figure 296: Asia Pacific APAC Data Center Construction Market Revenue (Million), by Data Center Size 2024 & 2032
- Figure 297: Asia Pacific APAC Data Center Construction Market Revenue Share (%), by Data Center Size 2024 & 2032
- Figure 298: Asia Pacific APAC Data Center Construction Market Revenue (Million), by Small 2024 & 2032
- Figure 299: Asia Pacific APAC Data Center Construction Market Revenue Share (%), by Small 2024 & 2032
- Figure 300: Asia Pacific APAC Data Center Construction Market Revenue (Million), by Medium 2024 & 2032
- Figure 301: Asia Pacific APAC Data Center Construction Market Revenue Share (%), by Medium 2024 & 2032
- Figure 302: Asia Pacific APAC Data Center Construction Market Revenue (Million), by Large 2024 & 2032
- Figure 303: Asia Pacific APAC Data Center Construction Market Revenue Share (%), by Large 2024 & 2032
- Figure 304: Asia Pacific APAC Data Center Construction Market Revenue (Million), by Massive 2024 & 2032
- Figure 305: Asia Pacific APAC Data Center Construction Market Revenue Share (%), by Massive 2024 & 2032
- Figure 306: Asia Pacific APAC Data Center Construction Market Revenue (Million), by Mega 2024 & 2032
- Figure 307: Asia Pacific APAC Data Center Construction Market Revenue Share (%), by Mega 2024 & 2032
- Figure 308: Asia Pacific APAC Data Center Construction Market Revenue (Million), by Country 2024 & 2032
- Figure 309: Asia Pacific APAC Data Center Construction Market Revenue Share (%), by Country 2024 & 2032
List of Tables
- Table 1: Global APAC Data Center Construction Market Revenue Million Forecast, by Region 2019 & 2032
- Table 2: Global APAC Data Center Construction Market Revenue Million Forecast, by Infrastructure 2019 & 2032
- Table 3: Global APAC Data Center Construction Market Revenue Million Forecast, by Electrical Infrastructure 2019 & 2032
- Table 4: Global APAC Data Center Construction Market Revenue Million Forecast, by Power Distribution Solution 2019 & 2032
- Table 5: Global APAC Data Center Construction Market Revenue Million Forecast, by Power Back up Solutions 2019 & 2032
- Table 6: Global APAC Data Center Construction Market Revenue Million Forecast, by Service 2019 & 2032
- Table 7: Global APAC Data Center Construction Market Revenue Million Forecast, by Mechanical Infrastructure 2019 & 2032
- Table 8: Global APAC Data Center Construction Market Revenue Million Forecast, by Cooling Systems 2019 & 2032
- Table 9: Global APAC Data Center Construction Market Revenue Million Forecast, by General Construction 2019 & 2032
- Table 10: Global APAC Data Center Construction Market Revenue Million Forecast, by Tier Type 2019 & 2032
- Table 11: Global APAC Data Center Construction Market Revenue Million Forecast, by Tier I and II 2019 & 2032
- Table 12: Global APAC Data Center Construction Market Revenue Million Forecast, by Tier-III 2019 & 2032
- Table 13: Global APAC Data Center Construction Market Revenue Million Forecast, by Tier-IV 2019 & 2032
- Table 14: Global APAC Data Center Construction Market Revenue Million Forecast, by End User 2019 & 2032
- Table 15: Global APAC Data Center Construction Market Revenue Million Forecast, by Banking, Financial Services, and Insurance 2019 & 2032
- Table 16: Global APAC Data Center Construction Market Revenue Million Forecast, by IT and Telecommunications 2019 & 2032
- Table 17: Global APAC Data Center Construction Market Revenue Million Forecast, by Government and Defense 2019 & 2032
- Table 18: Global APAC Data Center Construction Market Revenue Million Forecast, by Healthcare 2019 & 2032
- Table 19: Global APAC Data Center Construction Market Revenue Million Forecast, by Other End Users 2019 & 2032
- Table 20: Global APAC Data Center Construction Market Revenue Million Forecast, by China 2019 & 2032
- Table 21: Global APAC Data Center Construction Market Revenue Million Forecast, by India 2019 & 2032
- Table 22: Global APAC Data Center Construction Market Revenue Million Forecast, by Japan 2019 & 2032
- Table 23: Global APAC Data Center Construction Market Revenue Million Forecast, by Australia 2019 & 2032
- Table 24: Global APAC Data Center Construction Market Revenue Million Forecast, by Indonesia 2019 & 2032
- Table 25: Global APAC Data Center Construction Market Revenue Million Forecast, by Data Center Size 2019 & 2032
- Table 26: Global APAC Data Center Construction Market Revenue Million Forecast, by Small 2019 & 2032
- Table 27: Global APAC Data Center Construction Market Revenue Million Forecast, by Medium 2019 & 2032
- Table 28: Global APAC Data Center Construction Market Revenue Million Forecast, by Large 2019 & 2032
- Table 29: Global APAC Data Center Construction Market Revenue Million Forecast, by Massive 2019 & 2032
- Table 30: Global APAC Data Center Construction Market Revenue Million Forecast, by Mega 2019 & 2032
- Table 31: Global APAC Data Center Construction Market Revenue Million Forecast, by Region 2019 & 2032
- Table 32: Global APAC Data Center Construction Market Revenue Million Forecast, by Country 2019 & 2032
- Table 33: APAC Data Center Construction Market Revenue (Million) Forecast, by Application 2019 & 2032
- Table 34: Global APAC Data Center Construction Market Revenue Million Forecast, by Country 2019 & 2032
- Table 35: APAC Data Center Construction Market Revenue (Million) Forecast, by Application 2019 & 2032
- Table 36: Global APAC Data Center Construction Market Revenue Million Forecast, by Country 2019 & 2032
- Table 37: APAC Data Center Construction Market Revenue (Million) Forecast, by Application 2019 & 2032
- Table 38: Global APAC Data Center Construction Market Revenue Million Forecast, by Country 2019 & 2032
- Table 39: APAC Data Center Construction Market Revenue (Million) Forecast, by Application 2019 & 2032
- Table 40: Global APAC Data Center Construction Market Revenue Million Forecast, by Infrastructure 2019 & 2032
- Table 41: Global APAC Data Center Construction Market Revenue Million Forecast, by Electrical Infrastructure 2019 & 2032
- Table 42: Global APAC Data Center Construction Market Revenue Million Forecast, by Power Distribution Solution 2019 & 2032
- Table 43: Global APAC Data Center Construction Market Revenue Million Forecast, by Power Back up Solutions 2019 & 2032
- Table 44: Global APAC Data Center Construction Market Revenue Million Forecast, by Service 2019 & 2032
- Table 45: Global APAC Data Center Construction Market Revenue Million Forecast, by Mechanical Infrastructure 2019 & 2032
- Table 46: Global APAC Data Center Construction Market Revenue Million Forecast, by Cooling Systems 2019 & 2032
- Table 47: Global APAC Data Center Construction Market Revenue Million Forecast, by General Construction 2019 & 2032
- Table 48: Global APAC Data Center Construction Market Revenue Million Forecast, by Tier Type 2019 & 2032
- Table 49: Global APAC Data Center Construction Market Revenue Million Forecast, by Tier I and II 2019 & 2032
- Table 50: Global APAC Data Center Construction Market Revenue Million Forecast, by Tier-III 2019 & 2032
- Table 51: Global APAC Data Center Construction Market Revenue Million Forecast, by Tier-IV 2019 & 2032
- Table 52: Global APAC Data Center Construction Market Revenue Million Forecast, by End User 2019 & 2032
- Table 53: Global APAC Data Center Construction Market Revenue Million Forecast, by Banking, Financial Services, and Insurance 2019 & 2032
- Table 54: Global APAC Data Center Construction Market Revenue Million Forecast, by IT and Telecommunications 2019 & 2032
- Table 55: Global APAC Data Center Construction Market Revenue Million Forecast, by Government and Defense 2019 & 2032
- Table 56: Global APAC Data Center Construction Market Revenue Million Forecast, by Healthcare 2019 & 2032
- Table 57: Global APAC Data Center Construction Market Revenue Million Forecast, by Other End Users 2019 & 2032
- Table 58: Global APAC Data Center Construction Market Revenue Million Forecast, by China 2019 & 2032
- Table 59: Global APAC Data Center Construction Market Revenue Million Forecast, by India 2019 & 2032
- Table 60: Global APAC Data Center Construction Market Revenue Million Forecast, by Japan 2019 & 2032
- Table 61: Global APAC Data Center Construction Market Revenue Million Forecast, by Australia 2019 & 2032
- Table 62: Global APAC Data Center Construction Market Revenue Million Forecast, by Indonesia 2019 & 2032
- Table 63: Global APAC Data Center Construction Market Revenue Million Forecast, by Data Center Size 2019 & 2032
- Table 64: Global APAC Data Center Construction Market Revenue Million Forecast, by Small 2019 & 2032
- Table 65: Global APAC Data Center Construction Market Revenue Million Forecast, by Medium 2019 & 2032
- Table 66: Global APAC Data Center Construction Market Revenue Million Forecast, by Large 2019 & 2032
- Table 67: Global APAC Data Center Construction Market Revenue Million Forecast, by Massive 2019 & 2032
- Table 68: Global APAC Data Center Construction Market Revenue Million Forecast, by Mega 2019 & 2032
- Table 69: Global APAC Data Center Construction Market Revenue Million Forecast, by Country 2019 & 2032
- Table 70: United States APAC Data Center Construction Market Revenue (Million) Forecast, by Application 2019 & 2032
- Table 71: Canada APAC Data Center Construction Market Revenue (Million) Forecast, by Application 2019 & 2032
- Table 72: Mexico APAC Data Center Construction Market Revenue (Million) Forecast, by Application 2019 & 2032
- Table 73: Global APAC Data Center Construction Market Revenue Million Forecast, by Infrastructure 2019 & 2032
- Table 74: Global APAC Data Center Construction Market Revenue Million Forecast, by Electrical Infrastructure 2019 & 2032
- Table 75: Global APAC Data Center Construction Market Revenue Million Forecast, by Power Distribution Solution 2019 & 2032
- Table 76: Global APAC Data Center Construction Market Revenue Million Forecast, by Power Back up Solutions 2019 & 2032
- Table 77: Global APAC Data Center Construction Market Revenue Million Forecast, by Service 2019 & 2032
- Table 78: Global APAC Data Center Construction Market Revenue Million Forecast, by Mechanical Infrastructure 2019 & 2032
- Table 79: Global APAC Data Center Construction Market Revenue Million Forecast, by Cooling Systems 2019 & 2032
- Table 80: Global APAC Data Center Construction Market Revenue Million Forecast, by General Construction 2019 & 2032
- Table 81: Global APAC Data Center Construction Market Revenue Million Forecast, by Tier Type 2019 & 2032
- Table 82: Global APAC Data Center Construction Market Revenue Million Forecast, by Tier I and II 2019 & 2032
- Table 83: Global APAC Data Center Construction Market Revenue Million Forecast, by Tier-III 2019 & 2032
- Table 84: Global APAC Data Center Construction Market Revenue Million Forecast, by Tier-IV 2019 & 2032
- Table 85: Global APAC Data Center Construction Market Revenue Million Forecast, by End User 2019 & 2032
- Table 86: Global APAC Data Center Construction Market Revenue Million Forecast, by Banking, Financial Services, and Insurance 2019 & 2032
- Table 87: Global APAC Data Center Construction Market Revenue Million Forecast, by IT and Telecommunications 2019 & 2032
- Table 88: Global APAC Data Center Construction Market Revenue Million Forecast, by Government and Defense 2019 & 2032
- Table 89: Global APAC Data Center Construction Market Revenue Million Forecast, by Healthcare 2019 & 2032
- Table 90: Global APAC Data Center Construction Market Revenue Million Forecast, by Other End Users 2019 & 2032
- Table 91: Global APAC Data Center Construction Market Revenue Million Forecast, by China 2019 & 2032
- Table 92: Global APAC Data Center Construction Market Revenue Million Forecast, by India 2019 & 2032
- Table 93: Global APAC Data Center Construction Market Revenue Million Forecast, by Japan 2019 & 2032
- Table 94: Global APAC Data Center Construction Market Revenue Million Forecast, by Australia 2019 & 2032
- Table 95: Global APAC Data Center Construction Market Revenue Million Forecast, by Indonesia 2019 & 2032
- Table 96: Global APAC Data Center Construction Market Revenue Million Forecast, by Data Center Size 2019 & 2032
- Table 97: Global APAC Data Center Construction Market Revenue Million Forecast, by Small 2019 & 2032
- Table 98: Global APAC Data Center Construction Market Revenue Million Forecast, by Medium 2019 & 2032
- Table 99: Global APAC Data Center Construction Market Revenue Million Forecast, by Large 2019 & 2032
- Table 100: Global APAC Data Center Construction Market Revenue Million Forecast, by Massive 2019 & 2032
- Table 101: Global APAC Data Center Construction Market Revenue Million Forecast, by Mega 2019 & 2032
- Table 102: Global APAC Data Center Construction Market Revenue Million Forecast, by Country 2019 & 2032
- Table 103: Brazil APAC Data Center Construction Market Revenue (Million) Forecast, by Application 2019 & 2032
- Table 104: Argentina APAC Data Center Construction Market Revenue (Million) Forecast, by Application 2019 & 2032
- Table 105: Rest of South America APAC Data Center Construction Market Revenue (Million) Forecast, by Application 2019 & 2032
- Table 106: Global APAC Data Center Construction Market Revenue Million Forecast, by Infrastructure 2019 & 2032
- Table 107: Global APAC Data Center Construction Market Revenue Million Forecast, by Electrical Infrastructure 2019 & 2032
- Table 108: Global APAC Data Center Construction Market Revenue Million Forecast, by Power Distribution Solution 2019 & 2032
- Table 109: Global APAC Data Center Construction Market Revenue Million Forecast, by Power Back up Solutions 2019 & 2032
- Table 110: Global APAC Data Center Construction Market Revenue Million Forecast, by Service 2019 & 2032
- Table 111: Global APAC Data Center Construction Market Revenue Million Forecast, by Mechanical Infrastructure 2019 & 2032
- Table 112: Global APAC Data Center Construction Market Revenue Million Forecast, by Cooling Systems 2019 & 2032
- Table 113: Global APAC Data Center Construction Market Revenue Million Forecast, by General Construction 2019 & 2032
- Table 114: Global APAC Data Center Construction Market Revenue Million Forecast, by Tier Type 2019 & 2032
- Table 115: Global APAC Data Center Construction Market Revenue Million Forecast, by Tier I and II 2019 & 2032
- Table 116: Global APAC Data Center Construction Market Revenue Million Forecast, by Tier-III 2019 & 2032
- Table 117: Global APAC Data Center Construction Market Revenue Million Forecast, by Tier-IV 2019 & 2032
- Table 118: Global APAC Data Center Construction Market Revenue Million Forecast, by End User 2019 & 2032
- Table 119: Global APAC Data Center Construction Market Revenue Million Forecast, by Banking, Financial Services, and Insurance 2019 & 2032
- Table 120: Global APAC Data Center Construction Market Revenue Million Forecast, by IT and Telecommunications 2019 & 2032
- Table 121: Global APAC Data Center Construction Market Revenue Million Forecast, by Government and Defense 2019 & 2032
- Table 122: Global APAC Data Center Construction Market Revenue Million Forecast, by Healthcare 2019 & 2032
- Table 123: Global APAC Data Center Construction Market Revenue Million Forecast, by Other End Users 2019 & 2032
- Table 124: Global APAC Data Center Construction Market Revenue Million Forecast, by China 2019 & 2032
- Table 125: Global APAC Data Center Construction Market Revenue Million Forecast, by India 2019 & 2032
- Table 126: Global APAC Data Center Construction Market Revenue Million Forecast, by Japan 2019 & 2032
- Table 127: Global APAC Data Center Construction Market Revenue Million Forecast, by Australia 2019 & 2032
- Table 128: Global APAC Data Center Construction Market Revenue Million Forecast, by Indonesia 2019 & 2032
- Table 129: Global APAC Data Center Construction Market Revenue Million Forecast, by Data Center Size 2019 & 2032
- Table 130: Global APAC Data Center Construction Market Revenue Million Forecast, by Small 2019 & 2032
- Table 131: Global APAC Data Center Construction Market Revenue Million Forecast, by Medium 2019 & 2032
- Table 132: Global APAC Data Center Construction Market Revenue Million Forecast, by Large 2019 & 2032
- Table 133: Global APAC Data Center Construction Market Revenue Million Forecast, by Massive 2019 & 2032
- Table 134: Global APAC Data Center Construction Market Revenue Million Forecast, by Mega 2019 & 2032
- Table 135: Global APAC Data Center Construction Market Revenue Million Forecast, by Country 2019 & 2032
- Table 136: United Kingdom APAC Data Center Construction Market Revenue (Million) Forecast, by Application 2019 & 2032
- Table 137: Germany APAC Data Center Construction Market Revenue (Million) Forecast, by Application 2019 & 2032
- Table 138: France APAC Data Center Construction Market Revenue (Million) Forecast, by Application 2019 & 2032
- Table 139: Italy APAC Data Center Construction Market Revenue (Million) Forecast, by Application 2019 & 2032
- Table 140: Spain APAC Data Center Construction Market Revenue (Million) Forecast, by Application 2019 & 2032
- Table 141: Russia APAC Data Center Construction Market Revenue (Million) Forecast, by Application 2019 & 2032
- Table 142: Benelux APAC Data Center Construction Market Revenue (Million) Forecast, by Application 2019 & 2032
- Table 143: Nordics APAC Data Center Construction Market Revenue (Million) Forecast, by Application 2019 & 2032
- Table 144: Rest of Europe APAC Data Center Construction Market Revenue (Million) Forecast, by Application 2019 & 2032
- Table 145: Global APAC Data Center Construction Market Revenue Million Forecast, by Infrastructure 2019 & 2032
- Table 146: Global APAC Data Center Construction Market Revenue Million Forecast, by Electrical Infrastructure 2019 & 2032
- Table 147: Global APAC Data Center Construction Market Revenue Million Forecast, by Power Distribution Solution 2019 & 2032
- Table 148: Global APAC Data Center Construction Market Revenue Million Forecast, by Power Back up Solutions 2019 & 2032
- Table 149: Global APAC Data Center Construction Market Revenue Million Forecast, by Service 2019 & 2032
- Table 150: Global APAC Data Center Construction Market Revenue Million Forecast, by Mechanical Infrastructure 2019 & 2032
- Table 151: Global APAC Data Center Construction Market Revenue Million Forecast, by Cooling Systems 2019 & 2032
- Table 152: Global APAC Data Center Construction Market Revenue Million Forecast, by General Construction 2019 & 2032
- Table 153: Global APAC Data Center Construction Market Revenue Million Forecast, by Tier Type 2019 & 2032
- Table 154: Global APAC Data Center Construction Market Revenue Million Forecast, by Tier I and II 2019 & 2032
- Table 155: Global APAC Data Center Construction Market Revenue Million Forecast, by Tier-III 2019 & 2032
- Table 156: Global APAC Data Center Construction Market Revenue Million Forecast, by Tier-IV 2019 & 2032
- Table 157: Global APAC Data Center Construction Market Revenue Million Forecast, by End User 2019 & 2032
- Table 158: Global APAC Data Center Construction Market Revenue Million Forecast, by Banking, Financial Services, and Insurance 2019 & 2032
- Table 159: Global APAC Data Center Construction Market Revenue Million Forecast, by IT and Telecommunications 2019 & 2032
- Table 160: Global APAC Data Center Construction Market Revenue Million Forecast, by Government and Defense 2019 & 2032
- Table 161: Global APAC Data Center Construction Market Revenue Million Forecast, by Healthcare 2019 & 2032
- Table 162: Global APAC Data Center Construction Market Revenue Million Forecast, by Other End Users 2019 & 2032
- Table 163: Global APAC Data Center Construction Market Revenue Million Forecast, by China 2019 & 2032
- Table 164: Global APAC Data Center Construction Market Revenue Million Forecast, by India 2019 & 2032
- Table 165: Global APAC Data Center Construction Market Revenue Million Forecast, by Japan 2019 & 2032
- Table 166: Global APAC Data Center Construction Market Revenue Million Forecast, by Australia 2019 & 2032
- Table 167: Global APAC Data Center Construction Market Revenue Million Forecast, by Indonesia 2019 & 2032
- Table 168: Global APAC Data Center Construction Market Revenue Million Forecast, by Data Center Size 2019 & 2032
- Table 169: Global APAC Data Center Construction Market Revenue Million Forecast, by Small 2019 & 2032
- Table 170: Global APAC Data Center Construction Market Revenue Million Forecast, by Medium 2019 & 2032
- Table 171: Global APAC Data Center Construction Market Revenue Million Forecast, by Large 2019 & 2032
- Table 172: Global APAC Data Center Construction Market Revenue Million Forecast, by Massive 2019 & 2032
- Table 173: Global APAC Data Center Construction Market Revenue Million Forecast, by Mega 2019 & 2032
- Table 174: Global APAC Data Center Construction Market Revenue Million Forecast, by Country 2019 & 2032
- Table 175: Turkey APAC Data Center Construction Market Revenue (Million) Forecast, by Application 2019 & 2032
- Table 176: Israel APAC Data Center Construction Market Revenue (Million) Forecast, by Application 2019 & 2032
- Table 177: GCC APAC Data Center Construction Market Revenue (Million) Forecast, by Application 2019 & 2032
- Table 178: North Africa APAC Data Center Construction Market Revenue (Million) Forecast, by Application 2019 & 2032
- Table 179: South Africa APAC Data Center Construction Market Revenue (Million) Forecast, by Application 2019 & 2032
- Table 180: Rest of Middle East & Africa APAC Data Center Construction Market Revenue (Million) Forecast, by Application 2019 & 2032
- Table 181: Global APAC Data Center Construction Market Revenue Million Forecast, by Infrastructure 2019 & 2032
- Table 182: Global APAC Data Center Construction Market Revenue Million Forecast, by Electrical Infrastructure 2019 & 2032
- Table 183: Global APAC Data Center Construction Market Revenue Million Forecast, by Power Distribution Solution 2019 & 2032
- Table 184: Global APAC Data Center Construction Market Revenue Million Forecast, by Power Back up Solutions 2019 & 2032
- Table 185: Global APAC Data Center Construction Market Revenue Million Forecast, by Service 2019 & 2032
- Table 186: Global APAC Data Center Construction Market Revenue Million Forecast, by Mechanical Infrastructure 2019 & 2032
- Table 187: Global APAC Data Center Construction Market Revenue Million Forecast, by Cooling Systems 2019 & 2032
- Table 188: Global APAC Data Center Construction Market Revenue Million Forecast, by General Construction 2019 & 2032
- Table 189: Global APAC Data Center Construction Market Revenue Million Forecast, by Tier Type 2019 & 2032
- Table 190: Global APAC Data Center Construction Market Revenue Million Forecast, by Tier I and II 2019 & 2032
- Table 191: Global APAC Data Center Construction Market Revenue Million Forecast, by Tier-III 2019 & 2032
- Table 192: Global APAC Data Center Construction Market Revenue Million Forecast, by Tier-IV 2019 & 2032
- Table 193: Global APAC Data Center Construction Market Revenue Million Forecast, by End User 2019 & 2032
- Table 194: Global APAC Data Center Construction Market Revenue Million Forecast, by Banking, Financial Services, and Insurance 2019 & 2032
- Table 195: Global APAC Data Center Construction Market Revenue Million Forecast, by IT and Telecommunications 2019 & 2032
- Table 196: Global APAC Data Center Construction Market Revenue Million Forecast, by Government and Defense 2019 & 2032
- Table 197: Global APAC Data Center Construction Market Revenue Million Forecast, by Healthcare 2019 & 2032
- Table 198: Global APAC Data Center Construction Market Revenue Million Forecast, by Other End Users 2019 & 2032
- Table 199: Global APAC Data Center Construction Market Revenue Million Forecast, by China 2019 & 2032
- Table 200: Global APAC Data Center Construction Market Revenue Million Forecast, by India 2019 & 2032
- Table 201: Global APAC Data Center Construction Market Revenue Million Forecast, by Japan 2019 & 2032
- Table 202: Global APAC Data Center Construction Market Revenue Million Forecast, by Australia 2019 & 2032
- Table 203: Global APAC Data Center Construction Market Revenue Million Forecast, by Indonesia 2019 & 2032
- Table 204: Global APAC Data Center Construction Market Revenue Million Forecast, by Data Center Size 2019 & 2032
- Table 205: Global APAC Data Center Construction Market Revenue Million Forecast, by Small 2019 & 2032
- Table 206: Global APAC Data Center Construction Market Revenue Million Forecast, by Medium 2019 & 2032
- Table 207: Global APAC Data Center Construction Market Revenue Million Forecast, by Large 2019 & 2032
- Table 208: Global APAC Data Center Construction Market Revenue Million Forecast, by Massive 2019 & 2032
- Table 209: Global APAC Data Center Construction Market Revenue Million Forecast, by Mega 2019 & 2032
- Table 210: Global APAC Data Center Construction Market Revenue Million Forecast, by Country 2019 & 2032
- Table 211: China APAC Data Center Construction Market Revenue (Million) Forecast, by Application 2019 & 2032
- Table 212: India APAC Data Center Construction Market Revenue (Million) Forecast, by Application 2019 & 2032
- Table 213: Japan APAC Data Center Construction Market Revenue (Million) Forecast, by Application 2019 & 2032
- Table 214: South Korea APAC Data Center Construction Market Revenue (Million) Forecast, by Application 2019 & 2032
- Table 215: ASEAN APAC Data Center Construction Market Revenue (Million) Forecast, by Application 2019 & 2032
- Table 216: Oceania APAC Data Center Construction Market Revenue (Million) Forecast, by Application 2019 & 2032
- Table 217: Rest of Asia Pacific APAC Data Center Construction Market Revenue (Million) Forecast, by Application 2019 & 2032
Frequently Asked Questions
1. What is the projected Compound Annual Growth Rate (CAGR) of the APAC Data Center Construction Market?
The projected CAGR is approximately 8.62%.
2. Which companies are prominent players in the APAC Data Center Construction Market?
Key companies in the market include SAS Institute Inc, Fortis Construction, Aueron Group, JE Dunn Construction Group Inc, Hutchinson Builders, Kienta Engineering Construction, DSCO Group, IBM Corporation, Sato Kogyo, Nakano Corporation, Gammon Construction, Studio one Design, Powerware Systems, Turner Construction Co, DPR Construction Inc, Hensel Phelps Construction Co Inc, Obayashi Corporation, CSF Group, M+W Group, NTT Facillities, AECOM.
3. What are the main segments of the APAC Data Center Construction Market?
The market segments include Infrastructure, Electrical Infrastructure, Power Distribution Solution, Power Back up Solutions, Service , Mechanical Infrastructure, Cooling Systems, General Construction, Tier Type, Tier I and II, Tier-III, Tier-IV, End User, Banking, Financial Services, and Insurance, IT and Telecommunications, Government and Defense, Healthcare, Other End Users, China, India, Japan, Australia, Indonesia, Data Center Size, Small, Medium, Large, Massive, Mega.
4. Can you provide details about the market size?
The market size is estimated to be USD XX Million as of 2022.
5. What are some drivers contributing to market growth?
9.1 Growing Demand for SMAC (Social. Mobile. Analytics. and Cloud) Applications9.2 Growing Adoption of Hyperscale Data Centers in Large Enterprises9.3 Major Initiatives Undertaken by Governments to Promote Digital Economy and Connectivity Infrastructure.
6. What are the notable trends driving market growth?
China witnessing rapid data center construction activities.
7. Are there any restraints impacting market growth?
10.1 Environmental. Cost. and Workforce-related Challenges.
8. Can you provide examples of recent developments in the market?
June 2023: Bridge Data Centers announced expanding its hyperscale data centers with an IT power capacity of 64MW in Kuala Lumpur, Malaysia. This provides opportunities for Data Center Construction Vendors in the market.
9. What pricing options are available for accessing the report?
Pricing options include single-user, multi-user, and enterprise licenses priced at USD 4750, USD 4950, and USD 6800 respectively.
10. Is the market size provided in terms of value or volume?
The market size is provided in terms of value, measured in Million.
11. Are there any specific market keywords associated with the report?
Yes, the market keyword associated with the report is "APAC Data Center Construction Market," which aids in identifying and referencing the specific market segment covered.
12. How do I determine which pricing option suits my needs best?
The pricing options vary based on user requirements and access needs. Individual users may opt for single-user licenses, while businesses requiring broader access may choose multi-user or enterprise licenses for cost-effective access to the report.
13. Are there any additional resources or data provided in the APAC Data Center Construction Market report?
While the report offers comprehensive insights, it's advisable to review the specific contents or supplementary materials provided to ascertain if additional resources or data are available.
14. How can I stay updated on further developments or reports in the APAC Data Center Construction Market?
To stay informed about further developments, trends, and reports in the APAC Data Center Construction Market, consider subscribing to industry newsletters, following relevant companies and organizations, or regularly checking reputable industry news sources and publications.
Methodology
Step 1 - Identification of Relevant Samples Size from Population Database


Step 2 - Approaches for Defining Global Market Size (Value, Volume* & Price*)

Note*: In applicable scenarios
Step 3 - Data Sources
Primary Research
- Web Analytics
- Survey Reports
- Research Institute
- Latest Research Reports
- Opinion Leaders
Secondary Research
- Annual Reports
- White Paper
- Latest Press Release
- Industry Association
- Paid Database
- Investor Presentations

Step 4 - Data Triangulation
Involves using different sources of information in order to increase the validity of a study
These sources are likely to be stakeholders in a program - participants, other researchers, program staff, other community members, and so on.
Then we put all data in single framework & apply various statistical tools to find out the dynamic on the market.
During the analysis stage, feedback from the stakeholder groups would be compared to determine areas of agreement as well as areas of divergence


