
Key Insights
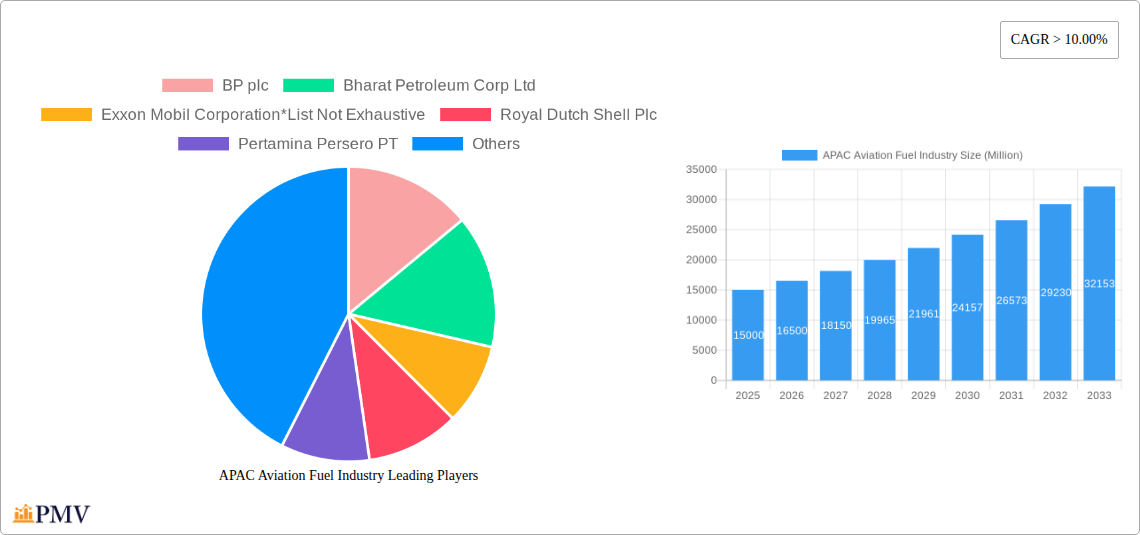
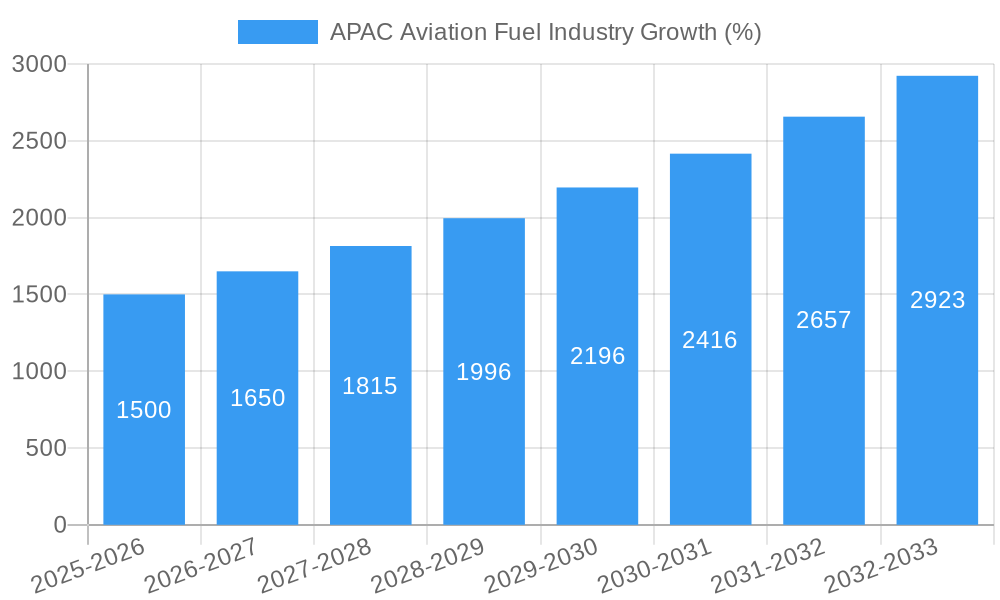
The Asia-Pacific (APAC) aviation fuel market is experiencing robust growth, driven by the region's burgeoning air travel sector and expanding economies. A CAGR exceeding 10% from 2019-2033 indicates significant market expansion. Key growth drivers include increasing disposable incomes leading to higher air passenger numbers, particularly in rapidly developing nations like India, China, and Southeast Asia. The rise of low-cost carriers further fuels demand, making air travel more accessible to a wider population. While the market is dominated by traditional Air Turbine Fuel (ATF), the increasing adoption of sustainable aviation biofuels is a notable trend, albeit still a relatively small segment. Government regulations promoting sustainable practices and reducing carbon emissions are pushing the adoption of biofuels, although infrastructure limitations and higher production costs currently hinder wider implementation. The commercial aircraft segment holds the largest market share within APAC, reflecting the dominance of passenger air travel. However, the military aircraft and general aviation segments are anticipated to experience growth, fueled by defense modernization and increasing private aviation. Competition is fierce, with both international and domestic players vying for market share. Major players include BP plc, Bharat Petroleum Corp Ltd, Exxon Mobil Corporation, and others, engaging in strategic partnerships and investments to strengthen their positions. Regional variations exist, with China, India, and Southeast Asia showing the most promising growth trajectories.
The forecast period (2025-2033) projects continued expansion, driven by further infrastructure development in the region, including new airports and improved air traffic management systems. However, potential restraints include fluctuating crude oil prices, geopolitical instability, and the ongoing impact of global events on air travel demand. A strategic focus on sustainable aviation biofuels will be crucial for long-term growth, requiring significant investment in research and development, as well as government support and policy changes. Despite potential challenges, the long-term outlook for the APAC aviation fuel market remains positive, promising significant returns for stakeholders who can adapt to the evolving market landscape and embrace sustainable practices.
APAC Aviation Fuel Industry: Market Analysis, Trends & Forecast 2019-2033
This comprehensive report provides a detailed analysis of the Asia-Pacific (APAC) aviation fuel industry, offering invaluable insights for stakeholders across the value chain. The study covers the period 2019-2033, with a base year of 2025 and a forecast period extending to 2033. Key segments analyzed include Air Turbine Fuel (ATF), Aviation Biofuel, and other fuel types, along with application segments covering commercial, military, and general aviation. The report features data on market size (in Millions), growth rates (CAGR), and competitive dynamics, focusing on major players such as BP plc, Bharat Petroleum Corp Ltd, Exxon Mobil Corporation, Royal Dutch Shell Plc, Pertamina Persero PT, Chevron Corporation, World Fuel Services Corp, Petronas Aviation Sdn Bhd, China Aviation Oil Corporation Ltd, and Vitol Holding BV.
APAC Aviation Fuel Industry Market Structure & Competitive Dynamics
This section delves into the competitive landscape of the APAC aviation fuel market, examining market concentration, innovation ecosystems, regulatory frameworks, and the role of substitute products. The analysis encompasses end-user trends and significant mergers and acquisitions (M&A) activities. The report quantifies market share amongst leading players and provides an overview of significant M&A deal values (in Millions) over the historical period. The highly fragmented nature of the market, with a relatively low concentration ratio, fosters significant competition. Innovation primarily focuses on improving fuel efficiency and exploring sustainable alternatives, like aviation biofuels. Regulatory frameworks, particularly those concerning emissions and safety, play a significant role in shaping market dynamics. The increasing adoption of sustainable aviation fuels is expected to reshape the competitive landscape and drive innovation. Significant M&A activity has consolidated several players, and the report provides a detailed breakdown of these transactions, with an estimated xx Million in total deal value during the 2019-2024 period.
- Market Concentration: Moderately Fragmented (using xx% as a estimated market share for top 5 players)
- M&A Activity: xx deals with a total estimated value of xx Million during 2019-2024.
- Regulatory Influence: Stringent emission standards and safety regulations are major drivers shaping industry dynamics.
APAC Aviation Fuel Industry Industry Trends & Insights
This section provides a comprehensive overview of the key trends driving the APAC aviation fuel market. We analyze market growth drivers, technological disruptions impacting the sector, evolving consumer preferences, and the competitive landscape. The report projects a compound annual growth rate (CAGR) of xx% for the forecast period (2025-2033), driven by factors such as the burgeoning air travel sector, increasing demand from both commercial and military aviation, and government initiatives to promote sustainable aviation fuel (SAF). Technological advancements, including the development of more fuel-efficient aircraft and the rise of SAF, are significantly influencing market dynamics. Consumer preferences increasingly favor sustainable travel options, creating a strong demand for biofuels and other environmentally friendly alternatives. The competitive dynamics are characterized by intense competition among major players, emphasizing efficiency and sustainable practices. Market penetration of SAF is estimated at xx% in 2025, projected to reach xx% by 2033.
Dominant Markets & Segments in APAC Aviation Fuel Industry
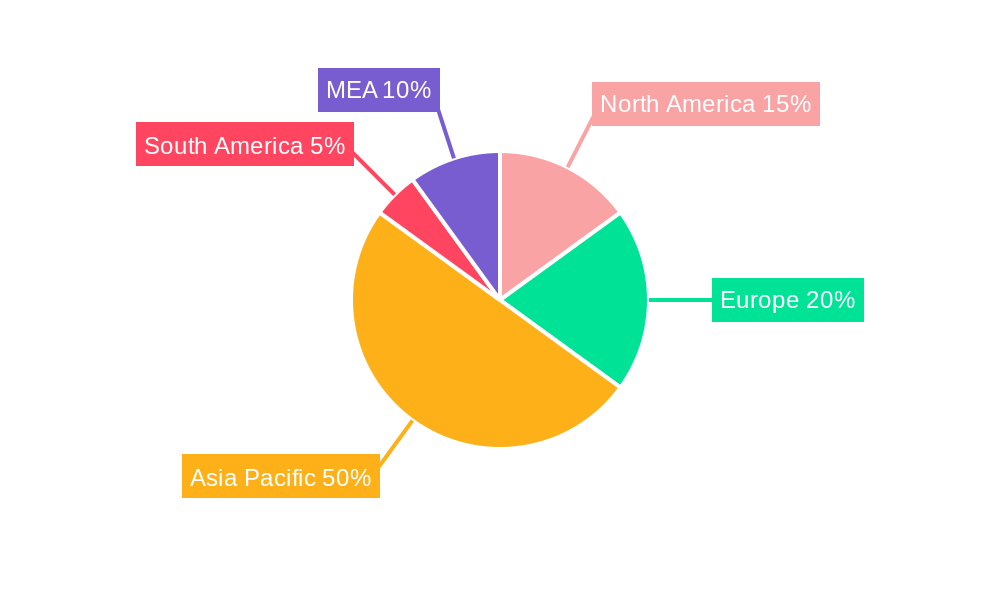
This section identifies the leading regions, countries, and segments within the APAC aviation fuel market. The analysis considers fuel types (ATF, Aviation Biofuel, Others) and applications (Commercial Aircraft, Military Aircraft, General Aviation). The market is largely dominated by countries with robust air travel sectors and substantial military aviation activity.
Leading Regions/Countries: China, India, Japan, and Southeast Asia are key markets.
- Key Drivers (China): Rapid economic growth, expanding air travel infrastructure, and government initiatives supporting the aviation sector.
- Key Drivers (India): Strong domestic air travel growth, increasing demand from both commercial and budget airlines.
- Key Drivers (Japan): Well-established aviation infrastructure, high per capita disposable income, and a significant number of international flights.
- Key Drivers (Southeast Asia): Rapid economic expansion in several countries, increased tourism and business travel.
Dominant Segments:
- Fuel Type: ATF remains the dominant segment, though Aviation Biofuel is experiencing rapid growth.
- Application: Commercial Aircraft constitutes the largest application segment.
The report provides a detailed analysis of market size and growth projections for each segment and region, outlining specific drivers and challenges impacting their dominance.
APAC Aviation Fuel Industry Product Innovations
The APAC aviation fuel industry is witnessing significant product innovations driven by the need for increased fuel efficiency and environmental sustainability. Key innovations include the development of advanced biofuels, blended fuels incorporating SAF, and improved fuel additives to enhance combustion efficiency and reduce emissions. These innovations offer improved performance characteristics, lower greenhouse gas emissions, and enhanced fuel economy for aircraft. The market fit for these innovations is strong, driven by stringent environmental regulations and increasing consumer demand for sustainable travel options. The competitive advantage for companies investing in and deploying these innovative technologies lies in improved operational efficiency and a stronger brand image.
Report Segmentation & Scope
This report segments the APAC aviation fuel market by fuel type and application:
Fuel Type:
- Air Turbine Fuel (ATF): This segment represents the largest share of the market, projected to grow at a CAGR of xx% during the forecast period. Competition is intense amongst established players.
- Aviation Biofuel: This segment is experiencing the fastest growth, driven by environmental concerns and government regulations. Market share is expected to increase from xx% to xx% between 2025 and 2033.
- Others: This segment includes other types of aviation fuels and is expected to exhibit moderate growth.
Application:
- Commercial Aircraft: This segment dominates the market due to the high volume of commercial flights in the region. Growth mirrors the growth of the air travel sector.
- Military Aircraft: This segment is relatively smaller but demonstrates consistent growth, influenced by military spending and modernization programs.
- General Aviation: This segment includes private and recreational aircraft, expected to show steady growth but remains a smaller portion of the overall market.
Key Drivers of APAC Aviation Fuel Industry Growth
The growth of the APAP aviation fuel industry is driven by several key factors:
- Growing Air Travel: The increasing number of air passengers in the region drives significant demand for aviation fuel.
- Economic Growth: Strong economic growth in many APAC countries fuels increased business and leisure travel.
- Infrastructure Development: Investments in new airports and improved air traffic management systems support growth.
- Government Policies: Supportive government regulations and incentives for the aviation sector play a significant role.
- Technological Advancements: Fuel efficiency improvements and the development of biofuels are further growth drivers.
Challenges in the APAC Aviation Fuel Industry Sector
Several challenges hinder the growth of the APAC aviation fuel industry:
- Oil Price Volatility: Fluctuations in crude oil prices directly impact the cost of aviation fuel.
- Environmental Regulations: Stringent emission standards require investment in cleaner fuels and technologies.
- Supply Chain Disruptions: Global events can significantly impact fuel availability and distribution.
- Competition: Intense competition among fuel suppliers necessitates operational efficiency and strategic partnerships. Price wars and competition for market share put pressure on profit margins. The total estimated impact of these challenges on the market value is projected at xx Million during the 2025-2033 forecast period.
Leading Players in the APAC Aviation Fuel Industry Market
- BP plc
- Bharat Petroleum Corp Ltd
- Exxon Mobil Corporation
- Royal Dutch Shell Plc
- Pertamina Persero PT
- Chevron Corporation
- World Fuel Services Corp
- Petronas Aviation Sdn Bhd
- China Aviation Oil Corporation Ltd
- Vitol Holding BV
Key Developments in APAC Aviation Fuel Industry Sector
- 2022-Q4: Several major players announced investments in sustainable aviation fuel production facilities.
- 2023-Q1: New regulations regarding aviation fuel emissions were implemented in several countries.
- 2023-Q2: A significant M&A deal involved the acquisition of a smaller fuel supplier by a leading player. (Estimated Value: xx Million).
Strategic APAC Aviation Fuel Industry Market Outlook
The APAC aviation fuel market presents significant growth opportunities, driven by the region's expanding aviation sector and the increasing demand for sustainable aviation fuels. Strategic investments in biofuel production, infrastructure development, and technological advancements are expected to drive future market growth. Companies adopting sustainable practices and innovating in fuel efficiency will be best positioned to capitalize on future market potential. The market's future outlook is positive, projecting substantial growth driven by economic development, increased air travel, and a shift towards sustainable aviation fuels.
APAC Aviation Fuel Industry Segmentation
-
1. Fuel Type
- 1.1. Air Turbine Fuel (ATF)
- 1.2. Aviation Biofuel
- 1.3. Others
-
2. Application
- 2.1. Commercial Aircraft
- 2.2. Military Aircraft
- 2.3. General Aviation
-
3. Geography
- 3.1. China
- 3.2. Japan
- 3.3. India
- 3.4. Indonesia
- 3.5. Australia
- 3.6. Rest of Asia-Pacific
APAC Aviation Fuel Industry Segmentation By Geography
- 1. China
- 2. Japan
- 3. India
- 4. Indonesia
- 5. Australia
- 6. Rest of Asia Pacific
APAC Aviation Fuel Industry REPORT HIGHLIGHTS
| Aspects | Details |
|---|---|
| Study Period | 2019-2033 |
| Base Year | 2024 |
| Estimated Year | 2025 |
| Forecast Period | 2025-2033 |
| Historical Period | 2019-2024 |
| Growth Rate | CAGR of > 10.00% from 2019-2033 |
| Segmentation |
|
Table of Contents
- 1. Introduction
- 1.1. Research Scope
- 1.2. Market Segmentation
- 1.3. Research Methodology
- 1.4. Definitions and Assumptions
- 2. Executive Summary
- 2.1. Introduction
- 3. Market Dynamics
- 3.1. Introduction
- 3.2. Market Drivers
- 3.2.1. 4.; Increase in Prices of Electricity Procured from Conventional Mechanisms 4.; Decline in Cost of Solar Energy Infrastructure
- 3.3. Market Restrains
- 3.3.1. 4.; Competition from Other Alternative Energy Sources
- 3.4. Market Trends
- 3.4.1. Commercial Aircraft Segment to Dominate the Market
- 4. Market Factor Analysis
- 4.1. Porters Five Forces
- 4.2. Supply/Value Chain
- 4.3. PESTEL analysis
- 4.4. Market Entropy
- 4.5. Patent/Trademark Analysis
- 5. Global APAC Aviation Fuel Industry Analysis, Insights and Forecast, 2019-2031
- 5.1. Market Analysis, Insights and Forecast - by Fuel Type
- 5.1.1. Air Turbine Fuel (ATF)
- 5.1.2. Aviation Biofuel
- 5.1.3. Others
- 5.2. Market Analysis, Insights and Forecast - by Application
- 5.2.1. Commercial Aircraft
- 5.2.2. Military Aircraft
- 5.2.3. General Aviation
- 5.3. Market Analysis, Insights and Forecast - by Geography
- 5.3.1. China
- 5.3.2. Japan
- 5.3.3. India
- 5.3.4. Indonesia
- 5.3.5. Australia
- 5.3.6. Rest of Asia-Pacific
- 5.4. Market Analysis, Insights and Forecast - by Region
- 5.4.1. China
- 5.4.2. Japan
- 5.4.3. India
- 5.4.4. Indonesia
- 5.4.5. Australia
- 5.4.6. Rest of Asia Pacific
- 5.1. Market Analysis, Insights and Forecast - by Fuel Type
- 6. China APAC Aviation Fuel Industry Analysis, Insights and Forecast, 2019-2031
- 6.1. Market Analysis, Insights and Forecast - by Fuel Type
- 6.1.1. Air Turbine Fuel (ATF)
- 6.1.2. Aviation Biofuel
- 6.1.3. Others
- 6.2. Market Analysis, Insights and Forecast - by Application
- 6.2.1. Commercial Aircraft
- 6.2.2. Military Aircraft
- 6.2.3. General Aviation
- 6.3. Market Analysis, Insights and Forecast - by Geography
- 6.3.1. China
- 6.3.2. Japan
- 6.3.3. India
- 6.3.4. Indonesia
- 6.3.5. Australia
- 6.3.6. Rest of Asia-Pacific
- 6.1. Market Analysis, Insights and Forecast - by Fuel Type
- 7. Japan APAC Aviation Fuel Industry Analysis, Insights and Forecast, 2019-2031
- 7.1. Market Analysis, Insights and Forecast - by Fuel Type
- 7.1.1. Air Turbine Fuel (ATF)
- 7.1.2. Aviation Biofuel
- 7.1.3. Others
- 7.2. Market Analysis, Insights and Forecast - by Application
- 7.2.1. Commercial Aircraft
- 7.2.2. Military Aircraft
- 7.2.3. General Aviation
- 7.3. Market Analysis, Insights and Forecast - by Geography
- 7.3.1. China
- 7.3.2. Japan
- 7.3.3. India
- 7.3.4. Indonesia
- 7.3.5. Australia
- 7.3.6. Rest of Asia-Pacific
- 7.1. Market Analysis, Insights and Forecast - by Fuel Type
- 8. India APAC Aviation Fuel Industry Analysis, Insights and Forecast, 2019-2031
- 8.1. Market Analysis, Insights and Forecast - by Fuel Type
- 8.1.1. Air Turbine Fuel (ATF)
- 8.1.2. Aviation Biofuel
- 8.1.3. Others
- 8.2. Market Analysis, Insights and Forecast - by Application
- 8.2.1. Commercial Aircraft
- 8.2.2. Military Aircraft
- 8.2.3. General Aviation
- 8.3. Market Analysis, Insights and Forecast - by Geography
- 8.3.1. China
- 8.3.2. Japan
- 8.3.3. India
- 8.3.4. Indonesia
- 8.3.5. Australia
- 8.3.6. Rest of Asia-Pacific
- 8.1. Market Analysis, Insights and Forecast - by Fuel Type
- 9. Indonesia APAC Aviation Fuel Industry Analysis, Insights and Forecast, 2019-2031
- 9.1. Market Analysis, Insights and Forecast - by Fuel Type
- 9.1.1. Air Turbine Fuel (ATF)
- 9.1.2. Aviation Biofuel
- 9.1.3. Others
- 9.2. Market Analysis, Insights and Forecast - by Application
- 9.2.1. Commercial Aircraft
- 9.2.2. Military Aircraft
- 9.2.3. General Aviation
- 9.3. Market Analysis, Insights and Forecast - by Geography
- 9.3.1. China
- 9.3.2. Japan
- 9.3.3. India
- 9.3.4. Indonesia
- 9.3.5. Australia
- 9.3.6. Rest of Asia-Pacific
- 9.1. Market Analysis, Insights and Forecast - by Fuel Type
- 10. Australia APAC Aviation Fuel Industry Analysis, Insights and Forecast, 2019-2031
- 10.1. Market Analysis, Insights and Forecast - by Fuel Type
- 10.1.1. Air Turbine Fuel (ATF)
- 10.1.2. Aviation Biofuel
- 10.1.3. Others
- 10.2. Market Analysis, Insights and Forecast - by Application
- 10.2.1. Commercial Aircraft
- 10.2.2. Military Aircraft
- 10.2.3. General Aviation
- 10.3. Market Analysis, Insights and Forecast - by Geography
- 10.3.1. China
- 10.3.2. Japan
- 10.3.3. India
- 10.3.4. Indonesia
- 10.3.5. Australia
- 10.3.6. Rest of Asia-Pacific
- 10.1. Market Analysis, Insights and Forecast - by Fuel Type
- 11. Rest of Asia Pacific APAC Aviation Fuel Industry Analysis, Insights and Forecast, 2019-2031
- 11.1. Market Analysis, Insights and Forecast - by Fuel Type
- 11.1.1. Air Turbine Fuel (ATF)
- 11.1.2. Aviation Biofuel
- 11.1.3. Others
- 11.2. Market Analysis, Insights and Forecast - by Application
- 11.2.1. Commercial Aircraft
- 11.2.2. Military Aircraft
- 11.2.3. General Aviation
- 11.3. Market Analysis, Insights and Forecast - by Geography
- 11.3.1. China
- 11.3.2. Japan
- 11.3.3. India
- 11.3.4. Indonesia
- 11.3.5. Australia
- 11.3.6. Rest of Asia-Pacific
- 11.1. Market Analysis, Insights and Forecast - by Fuel Type
- 12. North America APAC Aviation Fuel Industry Analysis, Insights and Forecast, 2019-2031
- 12.1. Market Analysis, Insights and Forecast - By Country/Sub-region
- 12.1.1 United States
- 12.1.2 Canada
- 12.1.3 Mexico
- 13. Europe APAC Aviation Fuel Industry Analysis, Insights and Forecast, 2019-2031
- 13.1. Market Analysis, Insights and Forecast - By Country/Sub-region
- 13.1.1 Germany
- 13.1.2 United Kingdom
- 13.1.3 France
- 13.1.4 Spain
- 13.1.5 Italy
- 13.1.6 Spain
- 13.1.7 Belgium
- 13.1.8 Netherland
- 13.1.9 Nordics
- 13.1.10 Rest of Europe
- 14. Asia Pacific APAC Aviation Fuel Industry Analysis, Insights and Forecast, 2019-2031
- 14.1. Market Analysis, Insights and Forecast - By Country/Sub-region
- 14.1.1 China
- 14.1.2 Japan
- 14.1.3 India
- 14.1.4 South Korea
- 14.1.5 Southeast Asia
- 14.1.6 Australia
- 14.1.7 Indonesia
- 14.1.8 Phillipes
- 14.1.9 Singapore
- 14.1.10 Thailandc
- 14.1.11 Rest of Asia Pacific
- 15. South America APAC Aviation Fuel Industry Analysis, Insights and Forecast, 2019-2031
- 15.1. Market Analysis, Insights and Forecast - By Country/Sub-region
- 15.1.1 Brazil
- 15.1.2 Argentina
- 15.1.3 Peru
- 15.1.4 Chile
- 15.1.5 Colombia
- 15.1.6 Ecuador
- 15.1.7 Venezuela
- 15.1.8 Rest of South America
- 16. North America APAC Aviation Fuel Industry Analysis, Insights and Forecast, 2019-2031
- 16.1. Market Analysis, Insights and Forecast - By Country/Sub-region
- 16.1.1 United States
- 16.1.2 Canada
- 16.1.3 Mexico
- 17. MEA APAC Aviation Fuel Industry Analysis, Insights and Forecast, 2019-2031
- 17.1. Market Analysis, Insights and Forecast - By Country/Sub-region
- 17.1.1 United Arab Emirates
- 17.1.2 Saudi Arabia
- 17.1.3 South Africa
- 17.1.4 Rest of Middle East and Africa
- 18. Competitive Analysis
- 18.1. Global Market Share Analysis 2024
- 18.2. Company Profiles
- 18.2.1 BP plc
- 18.2.1.1. Overview
- 18.2.1.2. Products
- 18.2.1.3. SWOT Analysis
- 18.2.1.4. Recent Developments
- 18.2.1.5. Financials (Based on Availability)
- 18.2.2 Bharat Petroleum Corp Ltd
- 18.2.2.1. Overview
- 18.2.2.2. Products
- 18.2.2.3. SWOT Analysis
- 18.2.2.4. Recent Developments
- 18.2.2.5. Financials (Based on Availability)
- 18.2.3 Exxon Mobil Corporation*List Not Exhaustive
- 18.2.3.1. Overview
- 18.2.3.2. Products
- 18.2.3.3. SWOT Analysis
- 18.2.3.4. Recent Developments
- 18.2.3.5. Financials (Based on Availability)
- 18.2.4 Royal Dutch Shell Plc
- 18.2.4.1. Overview
- 18.2.4.2. Products
- 18.2.4.3. SWOT Analysis
- 18.2.4.4. Recent Developments
- 18.2.4.5. Financials (Based on Availability)
- 18.2.5 Pertamina Persero PT
- 18.2.5.1. Overview
- 18.2.5.2. Products
- 18.2.5.3. SWOT Analysis
- 18.2.5.4. Recent Developments
- 18.2.5.5. Financials (Based on Availability)
- 18.2.6 Chevron Corporation
- 18.2.6.1. Overview
- 18.2.6.2. Products
- 18.2.6.3. SWOT Analysis
- 18.2.6.4. Recent Developments
- 18.2.6.5. Financials (Based on Availability)
- 18.2.7 World Fuel Services Corp
- 18.2.7.1. Overview
- 18.2.7.2. Products
- 18.2.7.3. SWOT Analysis
- 18.2.7.4. Recent Developments
- 18.2.7.5. Financials (Based on Availability)
- 18.2.8 Petronas Aviation Sdn Bhd
- 18.2.8.1. Overview
- 18.2.8.2. Products
- 18.2.8.3. SWOT Analysis
- 18.2.8.4. Recent Developments
- 18.2.8.5. Financials (Based on Availability)
- 18.2.9 China Aviation Oil Corporation Ltd
- 18.2.9.1. Overview
- 18.2.9.2. Products
- 18.2.9.3. SWOT Analysis
- 18.2.9.4. Recent Developments
- 18.2.9.5. Financials (Based on Availability)
- 18.2.10 Vitol Holding BV
- 18.2.10.1. Overview
- 18.2.10.2. Products
- 18.2.10.3. SWOT Analysis
- 18.2.10.4. Recent Developments
- 18.2.10.5. Financials (Based on Availability)
- 18.2.1 BP plc
List of Figures
- Figure 1: Global APAC Aviation Fuel Industry Revenue Breakdown (Million, %) by Region 2024 & 2032
- Figure 2: Global APAC Aviation Fuel Industry Volume Breakdown (Litre, %) by Region 2024 & 2032
- Figure 3: North America APAC Aviation Fuel Industry Revenue (Million), by Country 2024 & 2032
- Figure 4: North America APAC Aviation Fuel Industry Volume (Litre), by Country 2024 & 2032
- Figure 5: North America APAC Aviation Fuel Industry Revenue Share (%), by Country 2024 & 2032
- Figure 6: North America APAC Aviation Fuel Industry Volume Share (%), by Country 2024 & 2032
- Figure 7: Europe APAC Aviation Fuel Industry Revenue (Million), by Country 2024 & 2032
- Figure 8: Europe APAC Aviation Fuel Industry Volume (Litre), by Country 2024 & 2032
- Figure 9: Europe APAC Aviation Fuel Industry Revenue Share (%), by Country 2024 & 2032
- Figure 10: Europe APAC Aviation Fuel Industry Volume Share (%), by Country 2024 & 2032
- Figure 11: Asia Pacific APAC Aviation Fuel Industry Revenue (Million), by Country 2024 & 2032
- Figure 12: Asia Pacific APAC Aviation Fuel Industry Volume (Litre), by Country 2024 & 2032
- Figure 13: Asia Pacific APAC Aviation Fuel Industry Revenue Share (%), by Country 2024 & 2032
- Figure 14: Asia Pacific APAC Aviation Fuel Industry Volume Share (%), by Country 2024 & 2032
- Figure 15: South America APAC Aviation Fuel Industry Revenue (Million), by Country 2024 & 2032
- Figure 16: South America APAC Aviation Fuel Industry Volume (Litre), by Country 2024 & 2032
- Figure 17: South America APAC Aviation Fuel Industry Revenue Share (%), by Country 2024 & 2032
- Figure 18: South America APAC Aviation Fuel Industry Volume Share (%), by Country 2024 & 2032
- Figure 19: North America APAC Aviation Fuel Industry Revenue (Million), by Country 2024 & 2032
- Figure 20: North America APAC Aviation Fuel Industry Volume (Litre), by Country 2024 & 2032
- Figure 21: North America APAC Aviation Fuel Industry Revenue Share (%), by Country 2024 & 2032
- Figure 22: North America APAC Aviation Fuel Industry Volume Share (%), by Country 2024 & 2032
- Figure 23: MEA APAC Aviation Fuel Industry Revenue (Million), by Country 2024 & 2032
- Figure 24: MEA APAC Aviation Fuel Industry Volume (Litre), by Country 2024 & 2032
- Figure 25: MEA APAC Aviation Fuel Industry Revenue Share (%), by Country 2024 & 2032
- Figure 26: MEA APAC Aviation Fuel Industry Volume Share (%), by Country 2024 & 2032
- Figure 27: China APAC Aviation Fuel Industry Revenue (Million), by Fuel Type 2024 & 2032
- Figure 28: China APAC Aviation Fuel Industry Volume (Litre), by Fuel Type 2024 & 2032
- Figure 29: China APAC Aviation Fuel Industry Revenue Share (%), by Fuel Type 2024 & 2032
- Figure 30: China APAC Aviation Fuel Industry Volume Share (%), by Fuel Type 2024 & 2032
- Figure 31: China APAC Aviation Fuel Industry Revenue (Million), by Application 2024 & 2032
- Figure 32: China APAC Aviation Fuel Industry Volume (Litre), by Application 2024 & 2032
- Figure 33: China APAC Aviation Fuel Industry Revenue Share (%), by Application 2024 & 2032
- Figure 34: China APAC Aviation Fuel Industry Volume Share (%), by Application 2024 & 2032
- Figure 35: China APAC Aviation Fuel Industry Revenue (Million), by Geography 2024 & 2032
- Figure 36: China APAC Aviation Fuel Industry Volume (Litre), by Geography 2024 & 2032
- Figure 37: China APAC Aviation Fuel Industry Revenue Share (%), by Geography 2024 & 2032
- Figure 38: China APAC Aviation Fuel Industry Volume Share (%), by Geography 2024 & 2032
- Figure 39: China APAC Aviation Fuel Industry Revenue (Million), by Country 2024 & 2032
- Figure 40: China APAC Aviation Fuel Industry Volume (Litre), by Country 2024 & 2032
- Figure 41: China APAC Aviation Fuel Industry Revenue Share (%), by Country 2024 & 2032
- Figure 42: China APAC Aviation Fuel Industry Volume Share (%), by Country 2024 & 2032
- Figure 43: Japan APAC Aviation Fuel Industry Revenue (Million), by Fuel Type 2024 & 2032
- Figure 44: Japan APAC Aviation Fuel Industry Volume (Litre), by Fuel Type 2024 & 2032
- Figure 45: Japan APAC Aviation Fuel Industry Revenue Share (%), by Fuel Type 2024 & 2032
- Figure 46: Japan APAC Aviation Fuel Industry Volume Share (%), by Fuel Type 2024 & 2032
- Figure 47: Japan APAC Aviation Fuel Industry Revenue (Million), by Application 2024 & 2032
- Figure 48: Japan APAC Aviation Fuel Industry Volume (Litre), by Application 2024 & 2032
- Figure 49: Japan APAC Aviation Fuel Industry Revenue Share (%), by Application 2024 & 2032
- Figure 50: Japan APAC Aviation Fuel Industry Volume Share (%), by Application 2024 & 2032
- Figure 51: Japan APAC Aviation Fuel Industry Revenue (Million), by Geography 2024 & 2032
- Figure 52: Japan APAC Aviation Fuel Industry Volume (Litre), by Geography 2024 & 2032
- Figure 53: Japan APAC Aviation Fuel Industry Revenue Share (%), by Geography 2024 & 2032
- Figure 54: Japan APAC Aviation Fuel Industry Volume Share (%), by Geography 2024 & 2032
- Figure 55: Japan APAC Aviation Fuel Industry Revenue (Million), by Country 2024 & 2032
- Figure 56: Japan APAC Aviation Fuel Industry Volume (Litre), by Country 2024 & 2032
- Figure 57: Japan APAC Aviation Fuel Industry Revenue Share (%), by Country 2024 & 2032
- Figure 58: Japan APAC Aviation Fuel Industry Volume Share (%), by Country 2024 & 2032
- Figure 59: India APAC Aviation Fuel Industry Revenue (Million), by Fuel Type 2024 & 2032
- Figure 60: India APAC Aviation Fuel Industry Volume (Litre), by Fuel Type 2024 & 2032
- Figure 61: India APAC Aviation Fuel Industry Revenue Share (%), by Fuel Type 2024 & 2032
- Figure 62: India APAC Aviation Fuel Industry Volume Share (%), by Fuel Type 2024 & 2032
- Figure 63: India APAC Aviation Fuel Industry Revenue (Million), by Application 2024 & 2032
- Figure 64: India APAC Aviation Fuel Industry Volume (Litre), by Application 2024 & 2032
- Figure 65: India APAC Aviation Fuel Industry Revenue Share (%), by Application 2024 & 2032
- Figure 66: India APAC Aviation Fuel Industry Volume Share (%), by Application 2024 & 2032
- Figure 67: India APAC Aviation Fuel Industry Revenue (Million), by Geography 2024 & 2032
- Figure 68: India APAC Aviation Fuel Industry Volume (Litre), by Geography 2024 & 2032
- Figure 69: India APAC Aviation Fuel Industry Revenue Share (%), by Geography 2024 & 2032
- Figure 70: India APAC Aviation Fuel Industry Volume Share (%), by Geography 2024 & 2032
- Figure 71: India APAC Aviation Fuel Industry Revenue (Million), by Country 2024 & 2032
- Figure 72: India APAC Aviation Fuel Industry Volume (Litre), by Country 2024 & 2032
- Figure 73: India APAC Aviation Fuel Industry Revenue Share (%), by Country 2024 & 2032
- Figure 74: India APAC Aviation Fuel Industry Volume Share (%), by Country 2024 & 2032
- Figure 75: Indonesia APAC Aviation Fuel Industry Revenue (Million), by Fuel Type 2024 & 2032
- Figure 76: Indonesia APAC Aviation Fuel Industry Volume (Litre), by Fuel Type 2024 & 2032
- Figure 77: Indonesia APAC Aviation Fuel Industry Revenue Share (%), by Fuel Type 2024 & 2032
- Figure 78: Indonesia APAC Aviation Fuel Industry Volume Share (%), by Fuel Type 2024 & 2032
- Figure 79: Indonesia APAC Aviation Fuel Industry Revenue (Million), by Application 2024 & 2032
- Figure 80: Indonesia APAC Aviation Fuel Industry Volume (Litre), by Application 2024 & 2032
- Figure 81: Indonesia APAC Aviation Fuel Industry Revenue Share (%), by Application 2024 & 2032
- Figure 82: Indonesia APAC Aviation Fuel Industry Volume Share (%), by Application 2024 & 2032
- Figure 83: Indonesia APAC Aviation Fuel Industry Revenue (Million), by Geography 2024 & 2032
- Figure 84: Indonesia APAC Aviation Fuel Industry Volume (Litre), by Geography 2024 & 2032
- Figure 85: Indonesia APAC Aviation Fuel Industry Revenue Share (%), by Geography 2024 & 2032
- Figure 86: Indonesia APAC Aviation Fuel Industry Volume Share (%), by Geography 2024 & 2032
- Figure 87: Indonesia APAC Aviation Fuel Industry Revenue (Million), by Country 2024 & 2032
- Figure 88: Indonesia APAC Aviation Fuel Industry Volume (Litre), by Country 2024 & 2032
- Figure 89: Indonesia APAC Aviation Fuel Industry Revenue Share (%), by Country 2024 & 2032
- Figure 90: Indonesia APAC Aviation Fuel Industry Volume Share (%), by Country 2024 & 2032
- Figure 91: Australia APAC Aviation Fuel Industry Revenue (Million), by Fuel Type 2024 & 2032
- Figure 92: Australia APAC Aviation Fuel Industry Volume (Litre), by Fuel Type 2024 & 2032
- Figure 93: Australia APAC Aviation Fuel Industry Revenue Share (%), by Fuel Type 2024 & 2032
- Figure 94: Australia APAC Aviation Fuel Industry Volume Share (%), by Fuel Type 2024 & 2032
- Figure 95: Australia APAC Aviation Fuel Industry Revenue (Million), by Application 2024 & 2032
- Figure 96: Australia APAC Aviation Fuel Industry Volume (Litre), by Application 2024 & 2032
- Figure 97: Australia APAC Aviation Fuel Industry Revenue Share (%), by Application 2024 & 2032
- Figure 98: Australia APAC Aviation Fuel Industry Volume Share (%), by Application 2024 & 2032
- Figure 99: Australia APAC Aviation Fuel Industry Revenue (Million), by Geography 2024 & 2032
- Figure 100: Australia APAC Aviation Fuel Industry Volume (Litre), by Geography 2024 & 2032
- Figure 101: Australia APAC Aviation Fuel Industry Revenue Share (%), by Geography 2024 & 2032
- Figure 102: Australia APAC Aviation Fuel Industry Volume Share (%), by Geography 2024 & 2032
- Figure 103: Australia APAC Aviation Fuel Industry Revenue (Million), by Country 2024 & 2032
- Figure 104: Australia APAC Aviation Fuel Industry Volume (Litre), by Country 2024 & 2032
- Figure 105: Australia APAC Aviation Fuel Industry Revenue Share (%), by Country 2024 & 2032
- Figure 106: Australia APAC Aviation Fuel Industry Volume Share (%), by Country 2024 & 2032
- Figure 107: Rest of Asia Pacific APAC Aviation Fuel Industry Revenue (Million), by Fuel Type 2024 & 2032
- Figure 108: Rest of Asia Pacific APAC Aviation Fuel Industry Volume (Litre), by Fuel Type 2024 & 2032
- Figure 109: Rest of Asia Pacific APAC Aviation Fuel Industry Revenue Share (%), by Fuel Type 2024 & 2032
- Figure 110: Rest of Asia Pacific APAC Aviation Fuel Industry Volume Share (%), by Fuel Type 2024 & 2032
- Figure 111: Rest of Asia Pacific APAC Aviation Fuel Industry Revenue (Million), by Application 2024 & 2032
- Figure 112: Rest of Asia Pacific APAC Aviation Fuel Industry Volume (Litre), by Application 2024 & 2032
- Figure 113: Rest of Asia Pacific APAC Aviation Fuel Industry Revenue Share (%), by Application 2024 & 2032
- Figure 114: Rest of Asia Pacific APAC Aviation Fuel Industry Volume Share (%), by Application 2024 & 2032
- Figure 115: Rest of Asia Pacific APAC Aviation Fuel Industry Revenue (Million), by Geography 2024 & 2032
- Figure 116: Rest of Asia Pacific APAC Aviation Fuel Industry Volume (Litre), by Geography 2024 & 2032
- Figure 117: Rest of Asia Pacific APAC Aviation Fuel Industry Revenue Share (%), by Geography 2024 & 2032
- Figure 118: Rest of Asia Pacific APAC Aviation Fuel Industry Volume Share (%), by Geography 2024 & 2032
- Figure 119: Rest of Asia Pacific APAC Aviation Fuel Industry Revenue (Million), by Country 2024 & 2032
- Figure 120: Rest of Asia Pacific APAC Aviation Fuel Industry Volume (Litre), by Country 2024 & 2032
- Figure 121: Rest of Asia Pacific APAC Aviation Fuel Industry Revenue Share (%), by Country 2024 & 2032
- Figure 122: Rest of Asia Pacific APAC Aviation Fuel Industry Volume Share (%), by Country 2024 & 2032
List of Tables
- Table 1: Global APAC Aviation Fuel Industry Revenue Million Forecast, by Region 2019 & 2032
- Table 2: Global APAC Aviation Fuel Industry Volume Litre Forecast, by Region 2019 & 2032
- Table 3: Global APAC Aviation Fuel Industry Revenue Million Forecast, by Fuel Type 2019 & 2032
- Table 4: Global APAC Aviation Fuel Industry Volume Litre Forecast, by Fuel Type 2019 & 2032
- Table 5: Global APAC Aviation Fuel Industry Revenue Million Forecast, by Application 2019 & 2032
- Table 6: Global APAC Aviation Fuel Industry Volume Litre Forecast, by Application 2019 & 2032
- Table 7: Global APAC Aviation Fuel Industry Revenue Million Forecast, by Geography 2019 & 2032
- Table 8: Global APAC Aviation Fuel Industry Volume Litre Forecast, by Geography 2019 & 2032
- Table 9: Global APAC Aviation Fuel Industry Revenue Million Forecast, by Region 2019 & 2032
- Table 10: Global APAC Aviation Fuel Industry Volume Litre Forecast, by Region 2019 & 2032
- Table 11: Global APAC Aviation Fuel Industry Revenue Million Forecast, by Country 2019 & 2032
- Table 12: Global APAC Aviation Fuel Industry Volume Litre Forecast, by Country 2019 & 2032
- Table 13: United States APAC Aviation Fuel Industry Revenue (Million) Forecast, by Application 2019 & 2032
- Table 14: United States APAC Aviation Fuel Industry Volume (Litre) Forecast, by Application 2019 & 2032
- Table 15: Canada APAC Aviation Fuel Industry Revenue (Million) Forecast, by Application 2019 & 2032
- Table 16: Canada APAC Aviation Fuel Industry Volume (Litre) Forecast, by Application 2019 & 2032
- Table 17: Mexico APAC Aviation Fuel Industry Revenue (Million) Forecast, by Application 2019 & 2032
- Table 18: Mexico APAC Aviation Fuel Industry Volume (Litre) Forecast, by Application 2019 & 2032
- Table 19: Global APAC Aviation Fuel Industry Revenue Million Forecast, by Country 2019 & 2032
- Table 20: Global APAC Aviation Fuel Industry Volume Litre Forecast, by Country 2019 & 2032
- Table 21: Germany APAC Aviation Fuel Industry Revenue (Million) Forecast, by Application 2019 & 2032
- Table 22: Germany APAC Aviation Fuel Industry Volume (Litre) Forecast, by Application 2019 & 2032
- Table 23: United Kingdom APAC Aviation Fuel Industry Revenue (Million) Forecast, by Application 2019 & 2032
- Table 24: United Kingdom APAC Aviation Fuel Industry Volume (Litre) Forecast, by Application 2019 & 2032
- Table 25: France APAC Aviation Fuel Industry Revenue (Million) Forecast, by Application 2019 & 2032
- Table 26: France APAC Aviation Fuel Industry Volume (Litre) Forecast, by Application 2019 & 2032
- Table 27: Spain APAC Aviation Fuel Industry Revenue (Million) Forecast, by Application 2019 & 2032
- Table 28: Spain APAC Aviation Fuel Industry Volume (Litre) Forecast, by Application 2019 & 2032
- Table 29: Italy APAC Aviation Fuel Industry Revenue (Million) Forecast, by Application 2019 & 2032
- Table 30: Italy APAC Aviation Fuel Industry Volume (Litre) Forecast, by Application 2019 & 2032
- Table 31: Spain APAC Aviation Fuel Industry Revenue (Million) Forecast, by Application 2019 & 2032
- Table 32: Spain APAC Aviation Fuel Industry Volume (Litre) Forecast, by Application 2019 & 2032
- Table 33: Belgium APAC Aviation Fuel Industry Revenue (Million) Forecast, by Application 2019 & 2032
- Table 34: Belgium APAC Aviation Fuel Industry Volume (Litre) Forecast, by Application 2019 & 2032
- Table 35: Netherland APAC Aviation Fuel Industry Revenue (Million) Forecast, by Application 2019 & 2032
- Table 36: Netherland APAC Aviation Fuel Industry Volume (Litre) Forecast, by Application 2019 & 2032
- Table 37: Nordics APAC Aviation Fuel Industry Revenue (Million) Forecast, by Application 2019 & 2032
- Table 38: Nordics APAC Aviation Fuel Industry Volume (Litre) Forecast, by Application 2019 & 2032
- Table 39: Rest of Europe APAC Aviation Fuel Industry Revenue (Million) Forecast, by Application 2019 & 2032
- Table 40: Rest of Europe APAC Aviation Fuel Industry Volume (Litre) Forecast, by Application 2019 & 2032
- Table 41: Global APAC Aviation Fuel Industry Revenue Million Forecast, by Country 2019 & 2032
- Table 42: Global APAC Aviation Fuel Industry Volume Litre Forecast, by Country 2019 & 2032
- Table 43: China APAC Aviation Fuel Industry Revenue (Million) Forecast, by Application 2019 & 2032
- Table 44: China APAC Aviation Fuel Industry Volume (Litre) Forecast, by Application 2019 & 2032
- Table 45: Japan APAC Aviation Fuel Industry Revenue (Million) Forecast, by Application 2019 & 2032
- Table 46: Japan APAC Aviation Fuel Industry Volume (Litre) Forecast, by Application 2019 & 2032
- Table 47: India APAC Aviation Fuel Industry Revenue (Million) Forecast, by Application 2019 & 2032
- Table 48: India APAC Aviation Fuel Industry Volume (Litre) Forecast, by Application 2019 & 2032
- Table 49: South Korea APAC Aviation Fuel Industry Revenue (Million) Forecast, by Application 2019 & 2032
- Table 50: South Korea APAC Aviation Fuel Industry Volume (Litre) Forecast, by Application 2019 & 2032
- Table 51: Southeast Asia APAC Aviation Fuel Industry Revenue (Million) Forecast, by Application 2019 & 2032
- Table 52: Southeast Asia APAC Aviation Fuel Industry Volume (Litre) Forecast, by Application 2019 & 2032
- Table 53: Australia APAC Aviation Fuel Industry Revenue (Million) Forecast, by Application 2019 & 2032
- Table 54: Australia APAC Aviation Fuel Industry Volume (Litre) Forecast, by Application 2019 & 2032
- Table 55: Indonesia APAC Aviation Fuel Industry Revenue (Million) Forecast, by Application 2019 & 2032
- Table 56: Indonesia APAC Aviation Fuel Industry Volume (Litre) Forecast, by Application 2019 & 2032
- Table 57: Phillipes APAC Aviation Fuel Industry Revenue (Million) Forecast, by Application 2019 & 2032
- Table 58: Phillipes APAC Aviation Fuel Industry Volume (Litre) Forecast, by Application 2019 & 2032
- Table 59: Singapore APAC Aviation Fuel Industry Revenue (Million) Forecast, by Application 2019 & 2032
- Table 60: Singapore APAC Aviation Fuel Industry Volume (Litre) Forecast, by Application 2019 & 2032
- Table 61: Thailandc APAC Aviation Fuel Industry Revenue (Million) Forecast, by Application 2019 & 2032
- Table 62: Thailandc APAC Aviation Fuel Industry Volume (Litre) Forecast, by Application 2019 & 2032
- Table 63: Rest of Asia Pacific APAC Aviation Fuel Industry Revenue (Million) Forecast, by Application 2019 & 2032
- Table 64: Rest of Asia Pacific APAC Aviation Fuel Industry Volume (Litre) Forecast, by Application 2019 & 2032
- Table 65: Global APAC Aviation Fuel Industry Revenue Million Forecast, by Country 2019 & 2032
- Table 66: Global APAC Aviation Fuel Industry Volume Litre Forecast, by Country 2019 & 2032
- Table 67: Brazil APAC Aviation Fuel Industry Revenue (Million) Forecast, by Application 2019 & 2032
- Table 68: Brazil APAC Aviation Fuel Industry Volume (Litre) Forecast, by Application 2019 & 2032
- Table 69: Argentina APAC Aviation Fuel Industry Revenue (Million) Forecast, by Application 2019 & 2032
- Table 70: Argentina APAC Aviation Fuel Industry Volume (Litre) Forecast, by Application 2019 & 2032
- Table 71: Peru APAC Aviation Fuel Industry Revenue (Million) Forecast, by Application 2019 & 2032
- Table 72: Peru APAC Aviation Fuel Industry Volume (Litre) Forecast, by Application 2019 & 2032
- Table 73: Chile APAC Aviation Fuel Industry Revenue (Million) Forecast, by Application 2019 & 2032
- Table 74: Chile APAC Aviation Fuel Industry Volume (Litre) Forecast, by Application 2019 & 2032
- Table 75: Colombia APAC Aviation Fuel Industry Revenue (Million) Forecast, by Application 2019 & 2032
- Table 76: Colombia APAC Aviation Fuel Industry Volume (Litre) Forecast, by Application 2019 & 2032
- Table 77: Ecuador APAC Aviation Fuel Industry Revenue (Million) Forecast, by Application 2019 & 2032
- Table 78: Ecuador APAC Aviation Fuel Industry Volume (Litre) Forecast, by Application 2019 & 2032
- Table 79: Venezuela APAC Aviation Fuel Industry Revenue (Million) Forecast, by Application 2019 & 2032
- Table 80: Venezuela APAC Aviation Fuel Industry Volume (Litre) Forecast, by Application 2019 & 2032
- Table 81: Rest of South America APAC Aviation Fuel Industry Revenue (Million) Forecast, by Application 2019 & 2032
- Table 82: Rest of South America APAC Aviation Fuel Industry Volume (Litre) Forecast, by Application 2019 & 2032
- Table 83: Global APAC Aviation Fuel Industry Revenue Million Forecast, by Country 2019 & 2032
- Table 84: Global APAC Aviation Fuel Industry Volume Litre Forecast, by Country 2019 & 2032
- Table 85: United States APAC Aviation Fuel Industry Revenue (Million) Forecast, by Application 2019 & 2032
- Table 86: United States APAC Aviation Fuel Industry Volume (Litre) Forecast, by Application 2019 & 2032
- Table 87: Canada APAC Aviation Fuel Industry Revenue (Million) Forecast, by Application 2019 & 2032
- Table 88: Canada APAC Aviation Fuel Industry Volume (Litre) Forecast, by Application 2019 & 2032
- Table 89: Mexico APAC Aviation Fuel Industry Revenue (Million) Forecast, by Application 2019 & 2032
- Table 90: Mexico APAC Aviation Fuel Industry Volume (Litre) Forecast, by Application 2019 & 2032
- Table 91: Global APAC Aviation Fuel Industry Revenue Million Forecast, by Country 2019 & 2032
- Table 92: Global APAC Aviation Fuel Industry Volume Litre Forecast, by Country 2019 & 2032
- Table 93: United Arab Emirates APAC Aviation Fuel Industry Revenue (Million) Forecast, by Application 2019 & 2032
- Table 94: United Arab Emirates APAC Aviation Fuel Industry Volume (Litre) Forecast, by Application 2019 & 2032
- Table 95: Saudi Arabia APAC Aviation Fuel Industry Revenue (Million) Forecast, by Application 2019 & 2032
- Table 96: Saudi Arabia APAC Aviation Fuel Industry Volume (Litre) Forecast, by Application 2019 & 2032
- Table 97: South Africa APAC Aviation Fuel Industry Revenue (Million) Forecast, by Application 2019 & 2032
- Table 98: South Africa APAC Aviation Fuel Industry Volume (Litre) Forecast, by Application 2019 & 2032
- Table 99: Rest of Middle East and Africa APAC Aviation Fuel Industry Revenue (Million) Forecast, by Application 2019 & 2032
- Table 100: Rest of Middle East and Africa APAC Aviation Fuel Industry Volume (Litre) Forecast, by Application 2019 & 2032
- Table 101: Global APAC Aviation Fuel Industry Revenue Million Forecast, by Fuel Type 2019 & 2032
- Table 102: Global APAC Aviation Fuel Industry Volume Litre Forecast, by Fuel Type 2019 & 2032
- Table 103: Global APAC Aviation Fuel Industry Revenue Million Forecast, by Application 2019 & 2032
- Table 104: Global APAC Aviation Fuel Industry Volume Litre Forecast, by Application 2019 & 2032
- Table 105: Global APAC Aviation Fuel Industry Revenue Million Forecast, by Geography 2019 & 2032
- Table 106: Global APAC Aviation Fuel Industry Volume Litre Forecast, by Geography 2019 & 2032
- Table 107: Global APAC Aviation Fuel Industry Revenue Million Forecast, by Country 2019 & 2032
- Table 108: Global APAC Aviation Fuel Industry Volume Litre Forecast, by Country 2019 & 2032
- Table 109: Global APAC Aviation Fuel Industry Revenue Million Forecast, by Fuel Type 2019 & 2032
- Table 110: Global APAC Aviation Fuel Industry Volume Litre Forecast, by Fuel Type 2019 & 2032
- Table 111: Global APAC Aviation Fuel Industry Revenue Million Forecast, by Application 2019 & 2032
- Table 112: Global APAC Aviation Fuel Industry Volume Litre Forecast, by Application 2019 & 2032
- Table 113: Global APAC Aviation Fuel Industry Revenue Million Forecast, by Geography 2019 & 2032
- Table 114: Global APAC Aviation Fuel Industry Volume Litre Forecast, by Geography 2019 & 2032
- Table 115: Global APAC Aviation Fuel Industry Revenue Million Forecast, by Country 2019 & 2032
- Table 116: Global APAC Aviation Fuel Industry Volume Litre Forecast, by Country 2019 & 2032
- Table 117: Global APAC Aviation Fuel Industry Revenue Million Forecast, by Fuel Type 2019 & 2032
- Table 118: Global APAC Aviation Fuel Industry Volume Litre Forecast, by Fuel Type 2019 & 2032
- Table 119: Global APAC Aviation Fuel Industry Revenue Million Forecast, by Application 2019 & 2032
- Table 120: Global APAC Aviation Fuel Industry Volume Litre Forecast, by Application 2019 & 2032
- Table 121: Global APAC Aviation Fuel Industry Revenue Million Forecast, by Geography 2019 & 2032
- Table 122: Global APAC Aviation Fuel Industry Volume Litre Forecast, by Geography 2019 & 2032
- Table 123: Global APAC Aviation Fuel Industry Revenue Million Forecast, by Country 2019 & 2032
- Table 124: Global APAC Aviation Fuel Industry Volume Litre Forecast, by Country 2019 & 2032
- Table 125: Global APAC Aviation Fuel Industry Revenue Million Forecast, by Fuel Type 2019 & 2032
- Table 126: Global APAC Aviation Fuel Industry Volume Litre Forecast, by Fuel Type 2019 & 2032
- Table 127: Global APAC Aviation Fuel Industry Revenue Million Forecast, by Application 2019 & 2032
- Table 128: Global APAC Aviation Fuel Industry Volume Litre Forecast, by Application 2019 & 2032
- Table 129: Global APAC Aviation Fuel Industry Revenue Million Forecast, by Geography 2019 & 2032
- Table 130: Global APAC Aviation Fuel Industry Volume Litre Forecast, by Geography 2019 & 2032
- Table 131: Global APAC Aviation Fuel Industry Revenue Million Forecast, by Country 2019 & 2032
- Table 132: Global APAC Aviation Fuel Industry Volume Litre Forecast, by Country 2019 & 2032
- Table 133: Global APAC Aviation Fuel Industry Revenue Million Forecast, by Fuel Type 2019 & 2032
- Table 134: Global APAC Aviation Fuel Industry Volume Litre Forecast, by Fuel Type 2019 & 2032
- Table 135: Global APAC Aviation Fuel Industry Revenue Million Forecast, by Application 2019 & 2032
- Table 136: Global APAC Aviation Fuel Industry Volume Litre Forecast, by Application 2019 & 2032
- Table 137: Global APAC Aviation Fuel Industry Revenue Million Forecast, by Geography 2019 & 2032
- Table 138: Global APAC Aviation Fuel Industry Volume Litre Forecast, by Geography 2019 & 2032
- Table 139: Global APAC Aviation Fuel Industry Revenue Million Forecast, by Country 2019 & 2032
- Table 140: Global APAC Aviation Fuel Industry Volume Litre Forecast, by Country 2019 & 2032
- Table 141: Global APAC Aviation Fuel Industry Revenue Million Forecast, by Fuel Type 2019 & 2032
- Table 142: Global APAC Aviation Fuel Industry Volume Litre Forecast, by Fuel Type 2019 & 2032
- Table 143: Global APAC Aviation Fuel Industry Revenue Million Forecast, by Application 2019 & 2032
- Table 144: Global APAC Aviation Fuel Industry Volume Litre Forecast, by Application 2019 & 2032
- Table 145: Global APAC Aviation Fuel Industry Revenue Million Forecast, by Geography 2019 & 2032
- Table 146: Global APAC Aviation Fuel Industry Volume Litre Forecast, by Geography 2019 & 2032
- Table 147: Global APAC Aviation Fuel Industry Revenue Million Forecast, by Country 2019 & 2032
- Table 148: Global APAC Aviation Fuel Industry Volume Litre Forecast, by Country 2019 & 2032
Frequently Asked Questions
1. What is the projected Compound Annual Growth Rate (CAGR) of the APAC Aviation Fuel Industry?
The projected CAGR is approximately > 10.00%.
2. Which companies are prominent players in the APAC Aviation Fuel Industry?
Key companies in the market include BP plc, Bharat Petroleum Corp Ltd, Exxon Mobil Corporation*List Not Exhaustive, Royal Dutch Shell Plc, Pertamina Persero PT, Chevron Corporation, World Fuel Services Corp, Petronas Aviation Sdn Bhd, China Aviation Oil Corporation Ltd, Vitol Holding BV.
3. What are the main segments of the APAC Aviation Fuel Industry?
The market segments include Fuel Type, Application, Geography.
4. Can you provide details about the market size?
The market size is estimated to be USD XX Million as of 2022.
5. What are some drivers contributing to market growth?
4.; Increase in Prices of Electricity Procured from Conventional Mechanisms 4.; Decline in Cost of Solar Energy Infrastructure.
6. What are the notable trends driving market growth?
Commercial Aircraft Segment to Dominate the Market.
7. Are there any restraints impacting market growth?
4.; Competition from Other Alternative Energy Sources.
8. Can you provide examples of recent developments in the market?
N/A
9. What pricing options are available for accessing the report?
Pricing options include single-user, multi-user, and enterprise licenses priced at USD 4750, USD 5250, and USD 8750 respectively.
10. Is the market size provided in terms of value or volume?
The market size is provided in terms of value, measured in Million and volume, measured in Litre.
11. Are there any specific market keywords associated with the report?
Yes, the market keyword associated with the report is "APAC Aviation Fuel Industry," which aids in identifying and referencing the specific market segment covered.
12. How do I determine which pricing option suits my needs best?
The pricing options vary based on user requirements and access needs. Individual users may opt for single-user licenses, while businesses requiring broader access may choose multi-user or enterprise licenses for cost-effective access to the report.
13. Are there any additional resources or data provided in the APAC Aviation Fuel Industry report?
While the report offers comprehensive insights, it's advisable to review the specific contents or supplementary materials provided to ascertain if additional resources or data are available.
14. How can I stay updated on further developments or reports in the APAC Aviation Fuel Industry?
To stay informed about further developments, trends, and reports in the APAC Aviation Fuel Industry, consider subscribing to industry newsletters, following relevant companies and organizations, or regularly checking reputable industry news sources and publications.
Methodology
Step 1 - Identification of Relevant Samples Size from Population Database


Step 2 - Approaches for Defining Global Market Size (Value, Volume* & Price*)

Note*: In applicable scenarios
Step 3 - Data Sources
Primary Research
- Web Analytics
- Survey Reports
- Research Institute
- Latest Research Reports
- Opinion Leaders
Secondary Research
- Annual Reports
- White Paper
- Latest Press Release
- Industry Association
- Paid Database
- Investor Presentations

Step 4 - Data Triangulation
Involves using different sources of information in order to increase the validity of a study
These sources are likely to be stakeholders in a program - participants, other researchers, program staff, other community members, and so on.
Then we put all data in single framework & apply various statistical tools to find out the dynamic on the market.
During the analysis stage, feedback from the stakeholder groups would be compared to determine areas of agreement as well as areas of divergence


