
Key Insights
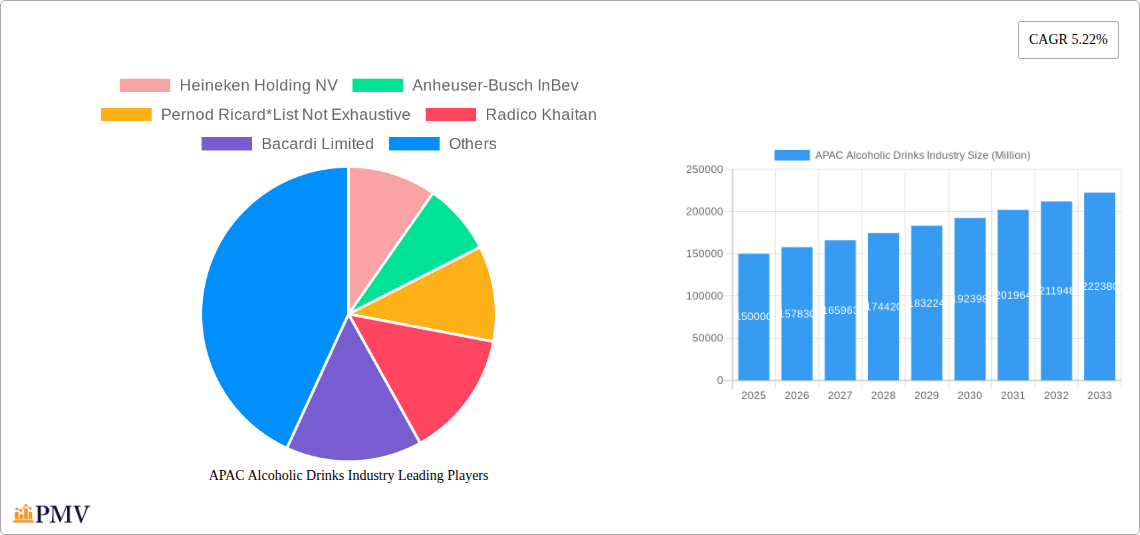
The Asia-Pacific (APAC) alcoholic drinks market, exhibiting a robust Compound Annual Growth Rate (CAGR) of 5.22%, presents a dynamic landscape shaped by diverse consumer preferences and evolving market dynamics. Driven by rising disposable incomes, particularly in burgeoning economies like India and China, coupled with a growing young adult population embracing Westernized lifestyles, the demand for alcoholic beverages is experiencing significant growth. The on-trade segment, encompassing bars, restaurants, and hotels, is witnessing expansion fueled by increasing urbanization and a preference for social drinking experiences. However, government regulations regarding alcohol consumption, particularly in certain regions with stricter licensing and advertising restrictions, act as a moderating influence. Furthermore, the rise of health consciousness among consumers is leading to a shift toward healthier alternatives, such as low-alcohol and no-alcohol beverages, impacting the growth trajectory of traditional alcoholic drinks. The market is segmented by product type (beer, wine, spirits) and distribution channel (on-trade, off-trade), with beer currently dominating the market share in several APAC countries.
Within the APAC region, distinct market characteristics emerge across sub-regions. China and India are pivotal growth drivers, boasting substantial populations and expanding middle classes. Japan, with its established preference for specific alcoholic beverage types, contributes significantly to the overall market value. Southeast Asian nations are witnessing accelerated growth driven by tourism and changing social norms. However, cultural sensitivities and religious beliefs in certain regions influence consumption patterns and product preferences. Competition is fierce, with both international giants and local players vying for market share. Strategic alliances, product diversification, and targeted marketing campaigns are key strategies employed by industry players to navigate the complex and diverse APAC alcoholic drinks market. The forecast period (2025-2033) anticipates sustained growth, albeit at potentially a slightly moderated pace compared to previous years, considering the impact of regulatory changes and shifting consumer behaviors.
This comprehensive report provides a detailed analysis of the Asia-Pacific (APAC) alcoholic drinks market, offering invaluable insights for industry stakeholders, investors, and businesses seeking to navigate this dynamic sector. With a study period spanning 2019-2033, a base year of 2025, and a forecast period of 2025-2033, this report offers a robust understanding of historical trends, current market conditions, and future growth projections. The report includes detailed segmentation by product type (beer, wine, spirits) and distribution channel (on-trade, off-trade), providing granular data for strategic decision-making. The total market size is estimated at xx Million in 2025.
APAC Alcoholic Drinks Industry Market Structure & Competitive Dynamics
The APAC alcoholic drinks market is characterized by a diverse competitive landscape, with a mix of global giants and regional players. Market concentration varies significantly across segments and countries. Key players such as Heineken Holding NV, Anheuser-Busch InBev, and Pernod Ricard hold significant market share, particularly in the beer and spirits segments. However, regional players like Radico Khaitan, Bacardi Limited, Suntory Beverages & Food Limited, Brown-Forman, Molson Coors Brewing Company, Diageo PLC, and The Wine Group LLC also play important roles, often dominating specific niches or geographic markets.
- Market Concentration: The market exhibits varying degrees of concentration, with higher concentration in established segments like beer in developed economies and more fragmented markets in emerging economies for spirits and wine.
- Innovation Ecosystems: APAC's vibrant innovation ecosystem fosters the development of new products, particularly in the craft beer and premium spirits categories.
- Regulatory Frameworks: Differing regulatory frameworks across countries impact market access and product offerings. Stringent alcohol regulations in some countries affect pricing and distribution strategies.
- Product Substitutes: The emergence of non-alcoholic and low-alcohol beverages poses a growing challenge to traditional alcoholic drinks. Health-conscious consumers are driving the demand for substitutes.
- End-User Trends: Changing consumer preferences, such as rising disposable incomes, increasing urbanization, and evolving tastes, significantly influence market demand. Premiumization and the growing demand for unique flavor profiles are shaping product development strategies.
- M&A Activities: The APAC alcoholic drinks market has seen significant M&A activity in recent years, with larger players consolidating market share and expanding their product portfolios. While precise deal values for all M&A transactions are not readily available, estimates suggest billions of dollars of transactions in the last 5 years.
APAC Alcoholic Drinks Industry Industry Trends & Insights
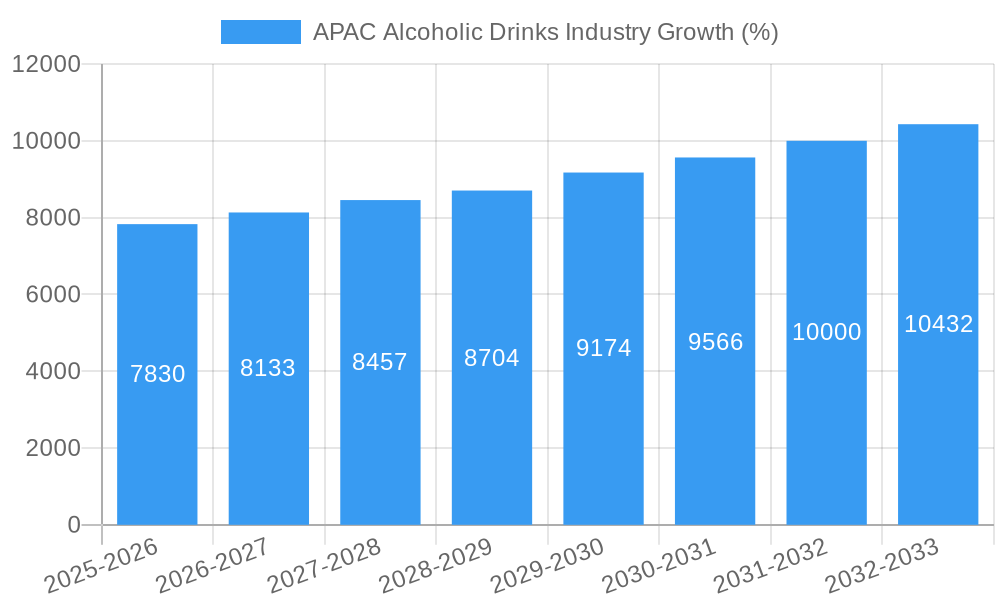
The APAC alcoholic drinks market is experiencing robust growth, driven by several key factors. The Compound Annual Growth Rate (CAGR) for the forecast period (2025-2033) is estimated at xx%. Rising disposable incomes, particularly in emerging economies, are fueling increased consumption. Urbanization is also a significant driver, as urban populations tend to exhibit higher alcohol consumption rates. Furthermore, changing consumer preferences, such as a shift toward premiumization and the increasing popularity of craft beverages, are driving market expansion. Technological disruptions, such as e-commerce and online delivery platforms, are transforming distribution channels and enhancing accessibility. Competitive dynamics are shaping innovation, leading to new product development and marketing strategies. Market penetration of premium alcoholic beverages is on the rise in many APAC countries.
Dominant Markets & Segments in APAC Alcoholic Drinks Industry
China and India are the dominant markets in the APAC alcoholic drinks industry, accounting for a significant portion of the total market volume.
Product Type:
- Beer: Remains the dominant segment, driven by high consumption in several countries.
- Spirits: Shows strong growth, fueled by rising demand for premium and craft spirits.
- Wine: Experiences moderate growth, but the market remains relatively smaller compared to beer and spirits.
Distribution Channel:
- On-Trade: Continues to be a significant distribution channel, particularly in urban areas.
- Off-Trade: Shows impressive growth due to the expansion of modern retail and e-commerce channels.
Key Drivers:
- Economic growth: Rising disposable incomes in many APAC countries fuel higher spending on alcoholic beverages.
- Urbanization: Concentrated populations in urban areas increase accessibility and convenience.
- Tourism: International tourism significantly boosts on-trade consumption in major tourist hubs.
- Government policies: Favorable alcohol policies in certain regions positively impact market growth.
- Infrastructure development: Better transportation and logistics improve distribution efficiency.
The dominance of specific regions and segments is a result of intricate interplay of various socio-economic factors including consumer preferences, economic conditions, cultural norms, and regulatory frameworks.
APAC Alcoholic Drinks Industry Product Innovations
Recent years have witnessed a surge in product innovation within the APAC alcoholic drinks market, driven by evolving consumer preferences and technological advancements. There's a significant focus on premiumization, with the launch of high-quality craft beers, premium spirits, and sophisticated wines. Ready-to-drink (RTD) cocktails and flavored alcoholic beverages are gaining popularity due to their convenience. Healthier alternatives such as low-alcohol and non-alcoholic options also show market traction, appealing to health-conscious consumers. Technological innovations enhance the production process, improve quality control, and optimize distribution.
Report Segmentation & Scope
This report offers a detailed segmentation of the APAC alcoholic drinks market based on product type (beer, wine, spirits) and distribution channel (on-trade, off-trade).
Product Type:
- Beer: This segment is further categorized by type (lager, ale, stout, etc.), pricing, and brand. The beer segment is projected to maintain a significant market share, with growth driven by increasing demand for craft beer and premium lagers. Competitive dynamics are intense, with both global and regional brewers vying for market share.
- Wine: This segment encompasses various wine types (red, white, rosé, sparkling) and price points. Growth is expected to be moderate, driven by increasing wine consumption in key markets.
- Spirits: This segment includes whiskies, vodkas, gins, rums, and other spirits. This segment is projected to experience robust growth, fueled by increasing demand for premium spirits and rising disposable incomes.
Distribution Channel:
- On-Trade: This includes restaurants, bars, and hotels. This channel is expected to experience continued growth, albeit at a slower pace compared to the off-trade channel, driven by the expansion of the hospitality sector.
- Off-Trade: This covers supermarkets, convenience stores, and online retailers. This segment demonstrates strong growth potential due to the increasing popularity of online alcohol delivery and the expanding modern retail landscape.
Key Drivers of APAC Alcoholic Drinks Industry Growth
Several factors propel the growth of the APAP alcoholic drinks industry. Firstly, the rising disposable incomes in many APAC countries, especially in emerging economies like India and China, allow consumers to spend more on premium and imported alcoholic beverages. Secondly, urbanization leads to increased alcohol consumption due to changes in lifestyle, higher social interactions, and greater accessibility to alcoholic beverages through various channels. Finally, evolving consumer preferences, such as the growing demand for craft beverages, healthier options, and convenience, are pushing innovation in product development and distribution.
Challenges in the APAC Alcoholic Drinks Industry Sector
The APAC alcoholic drinks industry faces various challenges. Stringent regulations on alcohol production, distribution, and advertising in several countries create hurdles for market entry and expansion. Supply chain disruptions, particularly those related to raw materials and transportation, can negatively impact production and pricing. Intense competition among both local and international players necessitates continuous innovation and effective marketing strategies to maintain market share. The rising popularity of non-alcoholic and low-alcohol alternatives poses a significant threat to the traditional alcohol market, impacting overall volume growth. The estimated impact of these challenges on market growth is xx Million annually.
Leading Players in the APAC Alcoholic Drinks Industry Market
- Heineken Holding NV
- Anheuser-Busch InBev
- Pernod Ricard
- Radico Khaitan
- Bacardi Limited
- Suntory Beverages & Food Limited
- Brown-Forman
- Molson Coors Brewing Company
- Diageo PLC
- The Wine Group LLC
Key Developments in APAC Alcoholic Drinks Industry Sector
- April 2022: Diageo India launched a new single malt whisky and two mixers for its Johnnie Walker and Black & White Scotch brands, showcasing adaptation to local tastes.
- February 2022: Bacardi GTR introduced a new travel-retail exclusive Teeling Whiskey line in partnership with China Duty-Free Group (CDFG), targeting a high-spending consumer segment.
- July 2021: The Boston Beer Company and Beam Suntory established a strategic partnership to expand into RTDs and bottled spirits, highlighting collaborative expansion into new product categories.
Strategic APAC Alcoholic Drinks Industry Market Outlook
The APAC alcoholic drinks market presents significant growth potential. Continued economic development, rising disposable incomes, and evolving consumer preferences will drive market expansion. Strategic opportunities exist in premiumization, innovation in product development, and expansion into emerging markets. Companies that adapt to changing consumer preferences, embrace technological advancements, and effectively navigate regulatory landscapes will be well-positioned for success. Focusing on sustainability and responsible consumption will also be crucial for long-term growth.
APAC Alcoholic Drinks Industry Segmentation
-
1. Product Type
- 1.1. Beer
- 1.2. Wine
- 1.3. Spirits
-
2. Distribution Channel
- 2.1. On-trade
-
2.2. Off-trade
- 2.2.1. Supermarkets/Hypermarkets
- 2.2.2. Specialist Stores
- 2.2.3. Online Retail Stores
- 2.2.4. Other Off-trade Channels
-
3. Geography
- 3.1. China
- 3.2. Japan
- 3.3. India
- 3.4. Australia
- 3.5. Rest of Asia-Pacific
APAC Alcoholic Drinks Industry Segmentation By Geography
- 1. China
- 2. Japan
- 3. India
- 4. Australia
- 5. Rest of Asia Pacific
APAC Alcoholic Drinks Industry REPORT HIGHLIGHTS
| Aspects | Details |
|---|---|
| Study Period | 2019-2033 |
| Base Year | 2024 |
| Estimated Year | 2025 |
| Forecast Period | 2025-2033 |
| Historical Period | 2019-2024 |
| Growth Rate | CAGR of 5.22% from 2019-2033 |
| Segmentation |
|
Table of Contents
- 1. Introduction
- 1.1. Research Scope
- 1.2. Market Segmentation
- 1.3. Research Methodology
- 1.4. Definitions and Assumptions
- 2. Executive Summary
- 2.1. Introduction
- 3. Market Dynamics
- 3.1. Introduction
- 3.2. Market Drivers
- 3.2.1. Convenience Offered By Online Food Delivery Services; Attractive Offers And Memberships Along With Advertisements And Marketing By Players
- 3.3. Market Restrains
- 3.3.1. Consumers Desire For Fine Dining Experience
- 3.4. Market Trends
- 3.4.1. Rising Demand for Cocktails and Other Mixed Drinks
- 4. Market Factor Analysis
- 4.1. Porters Five Forces
- 4.2. Supply/Value Chain
- 4.3. PESTEL analysis
- 4.4. Market Entropy
- 4.5. Patent/Trademark Analysis
- 5. Global APAC Alcoholic Drinks Industry Analysis, Insights and Forecast, 2019-2031
- 5.1. Market Analysis, Insights and Forecast - by Product Type
- 5.1.1. Beer
- 5.1.2. Wine
- 5.1.3. Spirits
- 5.2. Market Analysis, Insights and Forecast - by Distribution Channel
- 5.2.1. On-trade
- 5.2.2. Off-trade
- 5.2.2.1. Supermarkets/Hypermarkets
- 5.2.2.2. Specialist Stores
- 5.2.2.3. Online Retail Stores
- 5.2.2.4. Other Off-trade Channels
- 5.3. Market Analysis, Insights and Forecast - by Geography
- 5.3.1. China
- 5.3.2. Japan
- 5.3.3. India
- 5.3.4. Australia
- 5.3.5. Rest of Asia-Pacific
- 5.4. Market Analysis, Insights and Forecast - by Region
- 5.4.1. China
- 5.4.2. Japan
- 5.4.3. India
- 5.4.4. Australia
- 5.4.5. Rest of Asia Pacific
- 5.1. Market Analysis, Insights and Forecast - by Product Type
- 6. China APAC Alcoholic Drinks Industry Analysis, Insights and Forecast, 2019-2031
- 6.1. Market Analysis, Insights and Forecast - by Product Type
- 6.1.1. Beer
- 6.1.2. Wine
- 6.1.3. Spirits
- 6.2. Market Analysis, Insights and Forecast - by Distribution Channel
- 6.2.1. On-trade
- 6.2.2. Off-trade
- 6.2.2.1. Supermarkets/Hypermarkets
- 6.2.2.2. Specialist Stores
- 6.2.2.3. Online Retail Stores
- 6.2.2.4. Other Off-trade Channels
- 6.3. Market Analysis, Insights and Forecast - by Geography
- 6.3.1. China
- 6.3.2. Japan
- 6.3.3. India
- 6.3.4. Australia
- 6.3.5. Rest of Asia-Pacific
- 6.1. Market Analysis, Insights and Forecast - by Product Type
- 7. Japan APAC Alcoholic Drinks Industry Analysis, Insights and Forecast, 2019-2031
- 7.1. Market Analysis, Insights and Forecast - by Product Type
- 7.1.1. Beer
- 7.1.2. Wine
- 7.1.3. Spirits
- 7.2. Market Analysis, Insights and Forecast - by Distribution Channel
- 7.2.1. On-trade
- 7.2.2. Off-trade
- 7.2.2.1. Supermarkets/Hypermarkets
- 7.2.2.2. Specialist Stores
- 7.2.2.3. Online Retail Stores
- 7.2.2.4. Other Off-trade Channels
- 7.3. Market Analysis, Insights and Forecast - by Geography
- 7.3.1. China
- 7.3.2. Japan
- 7.3.3. India
- 7.3.4. Australia
- 7.3.5. Rest of Asia-Pacific
- 7.1. Market Analysis, Insights and Forecast - by Product Type
- 8. India APAC Alcoholic Drinks Industry Analysis, Insights and Forecast, 2019-2031
- 8.1. Market Analysis, Insights and Forecast - by Product Type
- 8.1.1. Beer
- 8.1.2. Wine
- 8.1.3. Spirits
- 8.2. Market Analysis, Insights and Forecast - by Distribution Channel
- 8.2.1. On-trade
- 8.2.2. Off-trade
- 8.2.2.1. Supermarkets/Hypermarkets
- 8.2.2.2. Specialist Stores
- 8.2.2.3. Online Retail Stores
- 8.2.2.4. Other Off-trade Channels
- 8.3. Market Analysis, Insights and Forecast - by Geography
- 8.3.1. China
- 8.3.2. Japan
- 8.3.3. India
- 8.3.4. Australia
- 8.3.5. Rest of Asia-Pacific
- 8.1. Market Analysis, Insights and Forecast - by Product Type
- 9. Australia APAC Alcoholic Drinks Industry Analysis, Insights and Forecast, 2019-2031
- 9.1. Market Analysis, Insights and Forecast - by Product Type
- 9.1.1. Beer
- 9.1.2. Wine
- 9.1.3. Spirits
- 9.2. Market Analysis, Insights and Forecast - by Distribution Channel
- 9.2.1. On-trade
- 9.2.2. Off-trade
- 9.2.2.1. Supermarkets/Hypermarkets
- 9.2.2.2. Specialist Stores
- 9.2.2.3. Online Retail Stores
- 9.2.2.4. Other Off-trade Channels
- 9.3. Market Analysis, Insights and Forecast - by Geography
- 9.3.1. China
- 9.3.2. Japan
- 9.3.3. India
- 9.3.4. Australia
- 9.3.5. Rest of Asia-Pacific
- 9.1. Market Analysis, Insights and Forecast - by Product Type
- 10. Rest of Asia Pacific APAC Alcoholic Drinks Industry Analysis, Insights and Forecast, 2019-2031
- 10.1. Market Analysis, Insights and Forecast - by Product Type
- 10.1.1. Beer
- 10.1.2. Wine
- 10.1.3. Spirits
- 10.2. Market Analysis, Insights and Forecast - by Distribution Channel
- 10.2.1. On-trade
- 10.2.2. Off-trade
- 10.2.2.1. Supermarkets/Hypermarkets
- 10.2.2.2. Specialist Stores
- 10.2.2.3. Online Retail Stores
- 10.2.2.4. Other Off-trade Channels
- 10.3. Market Analysis, Insights and Forecast - by Geography
- 10.3.1. China
- 10.3.2. Japan
- 10.3.3. India
- 10.3.4. Australia
- 10.3.5. Rest of Asia-Pacific
- 10.1. Market Analysis, Insights and Forecast - by Product Type
- 11. North America APAC Alcoholic Drinks Industry Analysis, Insights and Forecast, 2019-2031
- 11.1. Market Analysis, Insights and Forecast - By Country/Sub-region
- 11.1.1 United States
- 11.1.2 Canada
- 11.1.3 Mexico
- 12. Europe APAC Alcoholic Drinks Industry Analysis, Insights and Forecast, 2019-2031
- 12.1. Market Analysis, Insights and Forecast - By Country/Sub-region
- 12.1.1 Germany
- 12.1.2 United Kingdom
- 12.1.3 France
- 12.1.4 Spain
- 12.1.5 Italy
- 12.1.6 Spain
- 12.1.7 Belgium
- 12.1.8 Netherland
- 12.1.9 Nordics
- 12.1.10 Rest of Europe
- 13. Asia Pacific APAC Alcoholic Drinks Industry Analysis, Insights and Forecast, 2019-2031
- 13.1. Market Analysis, Insights and Forecast - By Country/Sub-region
- 13.1.1 China
- 13.1.2 Japan
- 13.1.3 India
- 13.1.4 South Korea
- 13.1.5 Southeast Asia
- 13.1.6 Australia
- 13.1.7 Indonesia
- 13.1.8 Phillipes
- 13.1.9 Singapore
- 13.1.10 Thailandc
- 13.1.11 Rest of Asia Pacific
- 14. South America APAC Alcoholic Drinks Industry Analysis, Insights and Forecast, 2019-2031
- 14.1. Market Analysis, Insights and Forecast - By Country/Sub-region
- 14.1.1 Brazil
- 14.1.2 Argentina
- 14.1.3 Peru
- 14.1.4 Chile
- 14.1.5 Colombia
- 14.1.6 Ecuador
- 14.1.7 Venezuela
- 14.1.8 Rest of South America
- 15. North America APAC Alcoholic Drinks Industry Analysis, Insights and Forecast, 2019-2031
- 15.1. Market Analysis, Insights and Forecast - By Country/Sub-region
- 15.1.1 United States
- 15.1.2 Canada
- 15.1.3 Mexico
- 16. MEA APAC Alcoholic Drinks Industry Analysis, Insights and Forecast, 2019-2031
- 16.1. Market Analysis, Insights and Forecast - By Country/Sub-region
- 16.1.1 United Arab Emirates
- 16.1.2 Saudi Arabia
- 16.1.3 South Africa
- 16.1.4 Rest of Middle East and Africa
- 17. Competitive Analysis
- 17.1. Global Market Share Analysis 2024
- 17.2. Company Profiles
- 17.2.1 Heineken Holding NV
- 17.2.1.1. Overview
- 17.2.1.2. Products
- 17.2.1.3. SWOT Analysis
- 17.2.1.4. Recent Developments
- 17.2.1.5. Financials (Based on Availability)
- 17.2.2 Anheuser-Busch InBev
- 17.2.2.1. Overview
- 17.2.2.2. Products
- 17.2.2.3. SWOT Analysis
- 17.2.2.4. Recent Developments
- 17.2.2.5. Financials (Based on Availability)
- 17.2.3 Pernod Ricard*List Not Exhaustive
- 17.2.3.1. Overview
- 17.2.3.2. Products
- 17.2.3.3. SWOT Analysis
- 17.2.3.4. Recent Developments
- 17.2.3.5. Financials (Based on Availability)
- 17.2.4 Radico Khaitan
- 17.2.4.1. Overview
- 17.2.4.2. Products
- 17.2.4.3. SWOT Analysis
- 17.2.4.4. Recent Developments
- 17.2.4.5. Financials (Based on Availability)
- 17.2.5 Bacardi Limited
- 17.2.5.1. Overview
- 17.2.5.2. Products
- 17.2.5.3. SWOT Analysis
- 17.2.5.4. Recent Developments
- 17.2.5.5. Financials (Based on Availability)
- 17.2.6 Suntory Beverages & Food Limited
- 17.2.6.1. Overview
- 17.2.6.2. Products
- 17.2.6.3. SWOT Analysis
- 17.2.6.4. Recent Developments
- 17.2.6.5. Financials (Based on Availability)
- 17.2.7 Brown-Forman
- 17.2.7.1. Overview
- 17.2.7.2. Products
- 17.2.7.3. SWOT Analysis
- 17.2.7.4. Recent Developments
- 17.2.7.5. Financials (Based on Availability)
- 17.2.8 Molson Coors Brewing Company
- 17.2.8.1. Overview
- 17.2.8.2. Products
- 17.2.8.3. SWOT Analysis
- 17.2.8.4. Recent Developments
- 17.2.8.5. Financials (Based on Availability)
- 17.2.9 Diageo PLC
- 17.2.9.1. Overview
- 17.2.9.2. Products
- 17.2.9.3. SWOT Analysis
- 17.2.9.4. Recent Developments
- 17.2.9.5. Financials (Based on Availability)
- 17.2.10 The Wine Group LLC
- 17.2.10.1. Overview
- 17.2.10.2. Products
- 17.2.10.3. SWOT Analysis
- 17.2.10.4. Recent Developments
- 17.2.10.5. Financials (Based on Availability)
- 17.2.1 Heineken Holding NV
List of Figures
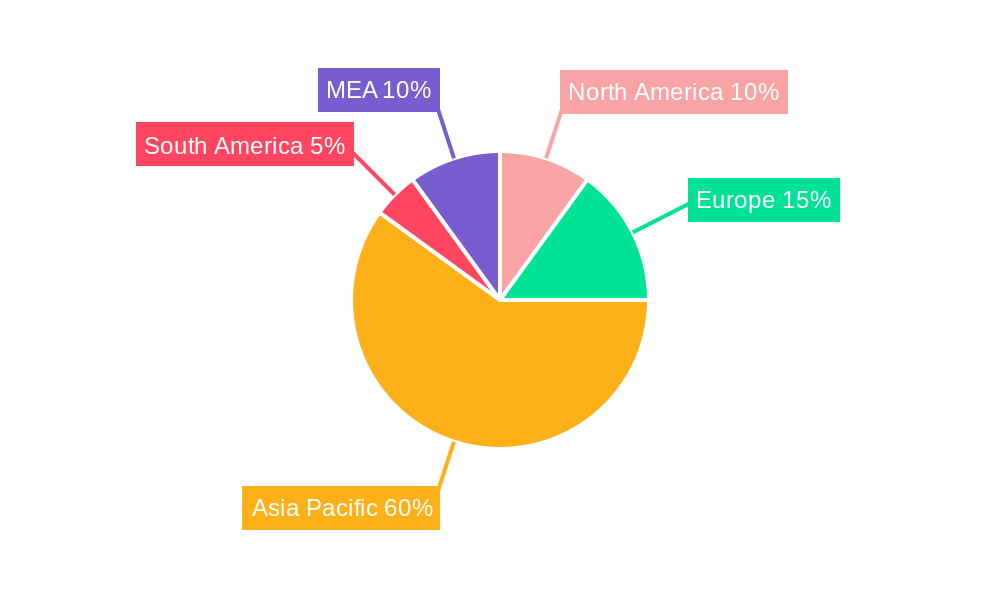
- Figure 1: Global APAC Alcoholic Drinks Industry Revenue Breakdown (Million, %) by Region 2024 & 2032
- Figure 2: North America APAC Alcoholic Drinks Industry Revenue (Million), by Country 2024 & 2032
- Figure 3: North America APAC Alcoholic Drinks Industry Revenue Share (%), by Country 2024 & 2032
- Figure 4: Europe APAC Alcoholic Drinks Industry Revenue (Million), by Country 2024 & 2032
- Figure 5: Europe APAC Alcoholic Drinks Industry Revenue Share (%), by Country 2024 & 2032
- Figure 6: Asia Pacific APAC Alcoholic Drinks Industry Revenue (Million), by Country 2024 & 2032
- Figure 7: Asia Pacific APAC Alcoholic Drinks Industry Revenue Share (%), by Country 2024 & 2032
- Figure 8: South America APAC Alcoholic Drinks Industry Revenue (Million), by Country 2024 & 2032
- Figure 9: South America APAC Alcoholic Drinks Industry Revenue Share (%), by Country 2024 & 2032
- Figure 10: North America APAC Alcoholic Drinks Industry Revenue (Million), by Country 2024 & 2032
- Figure 11: North America APAC Alcoholic Drinks Industry Revenue Share (%), by Country 2024 & 2032
- Figure 12: MEA APAC Alcoholic Drinks Industry Revenue (Million), by Country 2024 & 2032
- Figure 13: MEA APAC Alcoholic Drinks Industry Revenue Share (%), by Country 2024 & 2032
- Figure 14: China APAC Alcoholic Drinks Industry Revenue (Million), by Product Type 2024 & 2032
- Figure 15: China APAC Alcoholic Drinks Industry Revenue Share (%), by Product Type 2024 & 2032
- Figure 16: China APAC Alcoholic Drinks Industry Revenue (Million), by Distribution Channel 2024 & 2032
- Figure 17: China APAC Alcoholic Drinks Industry Revenue Share (%), by Distribution Channel 2024 & 2032
- Figure 18: China APAC Alcoholic Drinks Industry Revenue (Million), by Geography 2024 & 2032
- Figure 19: China APAC Alcoholic Drinks Industry Revenue Share (%), by Geography 2024 & 2032
- Figure 20: China APAC Alcoholic Drinks Industry Revenue (Million), by Country 2024 & 2032
- Figure 21: China APAC Alcoholic Drinks Industry Revenue Share (%), by Country 2024 & 2032
- Figure 22: Japan APAC Alcoholic Drinks Industry Revenue (Million), by Product Type 2024 & 2032
- Figure 23: Japan APAC Alcoholic Drinks Industry Revenue Share (%), by Product Type 2024 & 2032
- Figure 24: Japan APAC Alcoholic Drinks Industry Revenue (Million), by Distribution Channel 2024 & 2032
- Figure 25: Japan APAC Alcoholic Drinks Industry Revenue Share (%), by Distribution Channel 2024 & 2032
- Figure 26: Japan APAC Alcoholic Drinks Industry Revenue (Million), by Geography 2024 & 2032
- Figure 27: Japan APAC Alcoholic Drinks Industry Revenue Share (%), by Geography 2024 & 2032
- Figure 28: Japan APAC Alcoholic Drinks Industry Revenue (Million), by Country 2024 & 2032
- Figure 29: Japan APAC Alcoholic Drinks Industry Revenue Share (%), by Country 2024 & 2032
- Figure 30: India APAC Alcoholic Drinks Industry Revenue (Million), by Product Type 2024 & 2032
- Figure 31: India APAC Alcoholic Drinks Industry Revenue Share (%), by Product Type 2024 & 2032
- Figure 32: India APAC Alcoholic Drinks Industry Revenue (Million), by Distribution Channel 2024 & 2032
- Figure 33: India APAC Alcoholic Drinks Industry Revenue Share (%), by Distribution Channel 2024 & 2032
- Figure 34: India APAC Alcoholic Drinks Industry Revenue (Million), by Geography 2024 & 2032
- Figure 35: India APAC Alcoholic Drinks Industry Revenue Share (%), by Geography 2024 & 2032
- Figure 36: India APAC Alcoholic Drinks Industry Revenue (Million), by Country 2024 & 2032
- Figure 37: India APAC Alcoholic Drinks Industry Revenue Share (%), by Country 2024 & 2032
- Figure 38: Australia APAC Alcoholic Drinks Industry Revenue (Million), by Product Type 2024 & 2032
- Figure 39: Australia APAC Alcoholic Drinks Industry Revenue Share (%), by Product Type 2024 & 2032
- Figure 40: Australia APAC Alcoholic Drinks Industry Revenue (Million), by Distribution Channel 2024 & 2032
- Figure 41: Australia APAC Alcoholic Drinks Industry Revenue Share (%), by Distribution Channel 2024 & 2032
- Figure 42: Australia APAC Alcoholic Drinks Industry Revenue (Million), by Geography 2024 & 2032
- Figure 43: Australia APAC Alcoholic Drinks Industry Revenue Share (%), by Geography 2024 & 2032
- Figure 44: Australia APAC Alcoholic Drinks Industry Revenue (Million), by Country 2024 & 2032
- Figure 45: Australia APAC Alcoholic Drinks Industry Revenue Share (%), by Country 2024 & 2032
- Figure 46: Rest of Asia Pacific APAC Alcoholic Drinks Industry Revenue (Million), by Product Type 2024 & 2032
- Figure 47: Rest of Asia Pacific APAC Alcoholic Drinks Industry Revenue Share (%), by Product Type 2024 & 2032
- Figure 48: Rest of Asia Pacific APAC Alcoholic Drinks Industry Revenue (Million), by Distribution Channel 2024 & 2032
- Figure 49: Rest of Asia Pacific APAC Alcoholic Drinks Industry Revenue Share (%), by Distribution Channel 2024 & 2032
- Figure 50: Rest of Asia Pacific APAC Alcoholic Drinks Industry Revenue (Million), by Geography 2024 & 2032
- Figure 51: Rest of Asia Pacific APAC Alcoholic Drinks Industry Revenue Share (%), by Geography 2024 & 2032
- Figure 52: Rest of Asia Pacific APAC Alcoholic Drinks Industry Revenue (Million), by Country 2024 & 2032
- Figure 53: Rest of Asia Pacific APAC Alcoholic Drinks Industry Revenue Share (%), by Country 2024 & 2032
List of Tables
- Table 1: Global APAC Alcoholic Drinks Industry Revenue Million Forecast, by Region 2019 & 2032
- Table 2: Global APAC Alcoholic Drinks Industry Revenue Million Forecast, by Product Type 2019 & 2032
- Table 3: Global APAC Alcoholic Drinks Industry Revenue Million Forecast, by Distribution Channel 2019 & 2032
- Table 4: Global APAC Alcoholic Drinks Industry Revenue Million Forecast, by Geography 2019 & 2032
- Table 5: Global APAC Alcoholic Drinks Industry Revenue Million Forecast, by Region 2019 & 2032
- Table 6: Global APAC Alcoholic Drinks Industry Revenue Million Forecast, by Country 2019 & 2032
- Table 7: United States APAC Alcoholic Drinks Industry Revenue (Million) Forecast, by Application 2019 & 2032
- Table 8: Canada APAC Alcoholic Drinks Industry Revenue (Million) Forecast, by Application 2019 & 2032
- Table 9: Mexico APAC Alcoholic Drinks Industry Revenue (Million) Forecast, by Application 2019 & 2032
- Table 10: Global APAC Alcoholic Drinks Industry Revenue Million Forecast, by Country 2019 & 2032
- Table 11: Germany APAC Alcoholic Drinks Industry Revenue (Million) Forecast, by Application 2019 & 2032
- Table 12: United Kingdom APAC Alcoholic Drinks Industry Revenue (Million) Forecast, by Application 2019 & 2032
- Table 13: France APAC Alcoholic Drinks Industry Revenue (Million) Forecast, by Application 2019 & 2032
- Table 14: Spain APAC Alcoholic Drinks Industry Revenue (Million) Forecast, by Application 2019 & 2032
- Table 15: Italy APAC Alcoholic Drinks Industry Revenue (Million) Forecast, by Application 2019 & 2032
- Table 16: Spain APAC Alcoholic Drinks Industry Revenue (Million) Forecast, by Application 2019 & 2032
- Table 17: Belgium APAC Alcoholic Drinks Industry Revenue (Million) Forecast, by Application 2019 & 2032
- Table 18: Netherland APAC Alcoholic Drinks Industry Revenue (Million) Forecast, by Application 2019 & 2032
- Table 19: Nordics APAC Alcoholic Drinks Industry Revenue (Million) Forecast, by Application 2019 & 2032
- Table 20: Rest of Europe APAC Alcoholic Drinks Industry Revenue (Million) Forecast, by Application 2019 & 2032
- Table 21: Global APAC Alcoholic Drinks Industry Revenue Million Forecast, by Country 2019 & 2032
- Table 22: China APAC Alcoholic Drinks Industry Revenue (Million) Forecast, by Application 2019 & 2032
- Table 23: Japan APAC Alcoholic Drinks Industry Revenue (Million) Forecast, by Application 2019 & 2032
- Table 24: India APAC Alcoholic Drinks Industry Revenue (Million) Forecast, by Application 2019 & 2032
- Table 25: South Korea APAC Alcoholic Drinks Industry Revenue (Million) Forecast, by Application 2019 & 2032
- Table 26: Southeast Asia APAC Alcoholic Drinks Industry Revenue (Million) Forecast, by Application 2019 & 2032
- Table 27: Australia APAC Alcoholic Drinks Industry Revenue (Million) Forecast, by Application 2019 & 2032
- Table 28: Indonesia APAC Alcoholic Drinks Industry Revenue (Million) Forecast, by Application 2019 & 2032
- Table 29: Phillipes APAC Alcoholic Drinks Industry Revenue (Million) Forecast, by Application 2019 & 2032
- Table 30: Singapore APAC Alcoholic Drinks Industry Revenue (Million) Forecast, by Application 2019 & 2032
- Table 31: Thailandc APAC Alcoholic Drinks Industry Revenue (Million) Forecast, by Application 2019 & 2032
- Table 32: Rest of Asia Pacific APAC Alcoholic Drinks Industry Revenue (Million) Forecast, by Application 2019 & 2032
- Table 33: Global APAC Alcoholic Drinks Industry Revenue Million Forecast, by Country 2019 & 2032
- Table 34: Brazil APAC Alcoholic Drinks Industry Revenue (Million) Forecast, by Application 2019 & 2032
- Table 35: Argentina APAC Alcoholic Drinks Industry Revenue (Million) Forecast, by Application 2019 & 2032
- Table 36: Peru APAC Alcoholic Drinks Industry Revenue (Million) Forecast, by Application 2019 & 2032
- Table 37: Chile APAC Alcoholic Drinks Industry Revenue (Million) Forecast, by Application 2019 & 2032
- Table 38: Colombia APAC Alcoholic Drinks Industry Revenue (Million) Forecast, by Application 2019 & 2032
- Table 39: Ecuador APAC Alcoholic Drinks Industry Revenue (Million) Forecast, by Application 2019 & 2032
- Table 40: Venezuela APAC Alcoholic Drinks Industry Revenue (Million) Forecast, by Application 2019 & 2032
- Table 41: Rest of South America APAC Alcoholic Drinks Industry Revenue (Million) Forecast, by Application 2019 & 2032
- Table 42: Global APAC Alcoholic Drinks Industry Revenue Million Forecast, by Country 2019 & 2032
- Table 43: United States APAC Alcoholic Drinks Industry Revenue (Million) Forecast, by Application 2019 & 2032
- Table 44: Canada APAC Alcoholic Drinks Industry Revenue (Million) Forecast, by Application 2019 & 2032
- Table 45: Mexico APAC Alcoholic Drinks Industry Revenue (Million) Forecast, by Application 2019 & 2032
- Table 46: Global APAC Alcoholic Drinks Industry Revenue Million Forecast, by Country 2019 & 2032
- Table 47: United Arab Emirates APAC Alcoholic Drinks Industry Revenue (Million) Forecast, by Application 2019 & 2032
- Table 48: Saudi Arabia APAC Alcoholic Drinks Industry Revenue (Million) Forecast, by Application 2019 & 2032
- Table 49: South Africa APAC Alcoholic Drinks Industry Revenue (Million) Forecast, by Application 2019 & 2032
- Table 50: Rest of Middle East and Africa APAC Alcoholic Drinks Industry Revenue (Million) Forecast, by Application 2019 & 2032
- Table 51: Global APAC Alcoholic Drinks Industry Revenue Million Forecast, by Product Type 2019 & 2032
- Table 52: Global APAC Alcoholic Drinks Industry Revenue Million Forecast, by Distribution Channel 2019 & 2032
- Table 53: Global APAC Alcoholic Drinks Industry Revenue Million Forecast, by Geography 2019 & 2032
- Table 54: Global APAC Alcoholic Drinks Industry Revenue Million Forecast, by Country 2019 & 2032
- Table 55: Global APAC Alcoholic Drinks Industry Revenue Million Forecast, by Product Type 2019 & 2032
- Table 56: Global APAC Alcoholic Drinks Industry Revenue Million Forecast, by Distribution Channel 2019 & 2032
- Table 57: Global APAC Alcoholic Drinks Industry Revenue Million Forecast, by Geography 2019 & 2032
- Table 58: Global APAC Alcoholic Drinks Industry Revenue Million Forecast, by Country 2019 & 2032
- Table 59: Global APAC Alcoholic Drinks Industry Revenue Million Forecast, by Product Type 2019 & 2032
- Table 60: Global APAC Alcoholic Drinks Industry Revenue Million Forecast, by Distribution Channel 2019 & 2032
- Table 61: Global APAC Alcoholic Drinks Industry Revenue Million Forecast, by Geography 2019 & 2032
- Table 62: Global APAC Alcoholic Drinks Industry Revenue Million Forecast, by Country 2019 & 2032
- Table 63: Global APAC Alcoholic Drinks Industry Revenue Million Forecast, by Product Type 2019 & 2032
- Table 64: Global APAC Alcoholic Drinks Industry Revenue Million Forecast, by Distribution Channel 2019 & 2032
- Table 65: Global APAC Alcoholic Drinks Industry Revenue Million Forecast, by Geography 2019 & 2032
- Table 66: Global APAC Alcoholic Drinks Industry Revenue Million Forecast, by Country 2019 & 2032
- Table 67: Global APAC Alcoholic Drinks Industry Revenue Million Forecast, by Product Type 2019 & 2032
- Table 68: Global APAC Alcoholic Drinks Industry Revenue Million Forecast, by Distribution Channel 2019 & 2032
- Table 69: Global APAC Alcoholic Drinks Industry Revenue Million Forecast, by Geography 2019 & 2032
- Table 70: Global APAC Alcoholic Drinks Industry Revenue Million Forecast, by Country 2019 & 2032
Frequently Asked Questions
1. What is the projected Compound Annual Growth Rate (CAGR) of the APAC Alcoholic Drinks Industry?
The projected CAGR is approximately 5.22%.
2. Which companies are prominent players in the APAC Alcoholic Drinks Industry?
Key companies in the market include Heineken Holding NV, Anheuser-Busch InBev, Pernod Ricard*List Not Exhaustive, Radico Khaitan, Bacardi Limited, Suntory Beverages & Food Limited, Brown-Forman, Molson Coors Brewing Company, Diageo PLC, The Wine Group LLC.
3. What are the main segments of the APAC Alcoholic Drinks Industry?
The market segments include Product Type, Distribution Channel, Geography.
4. Can you provide details about the market size?
The market size is estimated to be USD XX Million as of 2022.
5. What are some drivers contributing to market growth?
Convenience Offered By Online Food Delivery Services; Attractive Offers And Memberships Along With Advertisements And Marketing By Players.
6. What are the notable trends driving market growth?
Rising Demand for Cocktails and Other Mixed Drinks.
7. Are there any restraints impacting market growth?
Consumers Desire For Fine Dining Experience.
8. Can you provide examples of recent developments in the market?
In April 2022, Diageo India launched a new single malt whisky and two mixers for its Johnnie Walker and Black & White Scotch brands. The new whisky was created using Rajasthan-specific six-row barley grains and was aged at a heat of more than 100°F.
9. What pricing options are available for accessing the report?
Pricing options include single-user, multi-user, and enterprise licenses priced at USD 4750, USD 5250, and USD 8750 respectively.
10. Is the market size provided in terms of value or volume?
The market size is provided in terms of value, measured in Million.
11. Are there any specific market keywords associated with the report?
Yes, the market keyword associated with the report is "APAC Alcoholic Drinks Industry," which aids in identifying and referencing the specific market segment covered.
12. How do I determine which pricing option suits my needs best?
The pricing options vary based on user requirements and access needs. Individual users may opt for single-user licenses, while businesses requiring broader access may choose multi-user or enterprise licenses for cost-effective access to the report.
13. Are there any additional resources or data provided in the APAC Alcoholic Drinks Industry report?
While the report offers comprehensive insights, it's advisable to review the specific contents or supplementary materials provided to ascertain if additional resources or data are available.
14. How can I stay updated on further developments or reports in the APAC Alcoholic Drinks Industry?
To stay informed about further developments, trends, and reports in the APAC Alcoholic Drinks Industry, consider subscribing to industry newsletters, following relevant companies and organizations, or regularly checking reputable industry news sources and publications.
Methodology
Step 1 - Identification of Relevant Samples Size from Population Database


Step 2 - Approaches for Defining Global Market Size (Value, Volume* & Price*)

Note*: In applicable scenarios
Step 3 - Data Sources
Primary Research
- Web Analytics
- Survey Reports
- Research Institute
- Latest Research Reports
- Opinion Leaders
Secondary Research
- Annual Reports
- White Paper
- Latest Press Release
- Industry Association
- Paid Database
- Investor Presentations

Step 4 - Data Triangulation
Involves using different sources of information in order to increase the validity of a study
These sources are likely to be stakeholders in a program - participants, other researchers, program staff, other community members, and so on.
Then we put all data in single framework & apply various statistical tools to find out the dynamic on the market.
During the analysis stage, feedback from the stakeholder groups would be compared to determine areas of agreement as well as areas of divergence


