
Key Insights
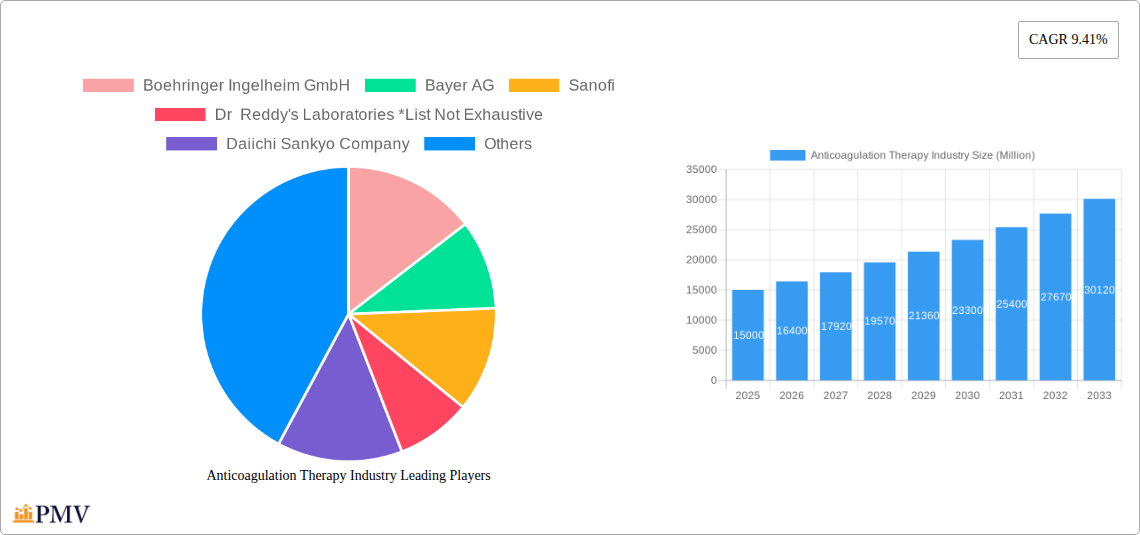
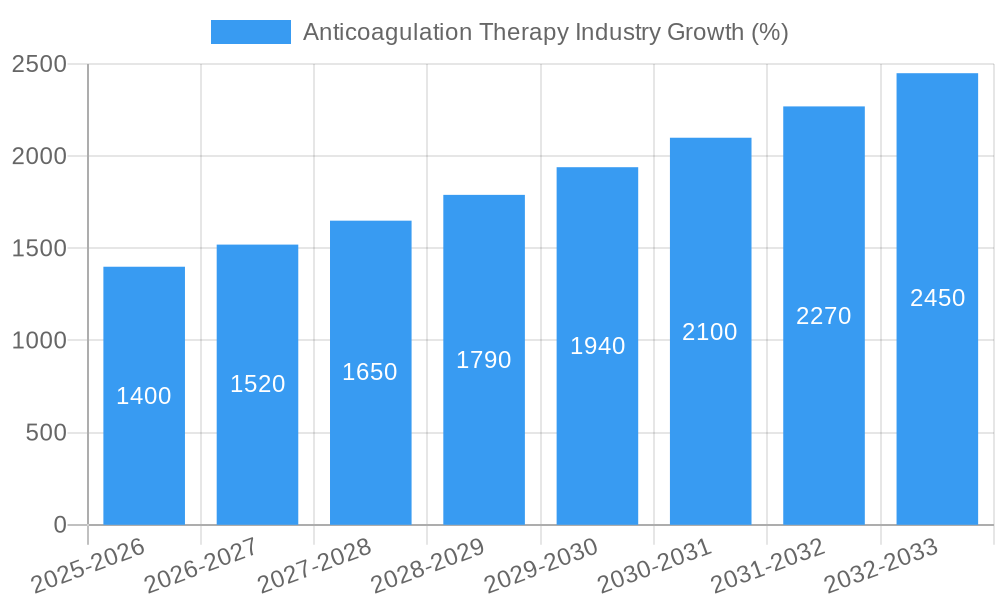
The global Anticoagulation Therapy market is experiencing robust growth, projected to reach a substantial size by 2033, driven by a rising prevalence of cardiovascular diseases like atrial fibrillation and deep vein thrombosis (DVT), an aging global population, and increasing awareness of the benefits of anticoagulation therapy. The market's 9.41% CAGR reflects consistent demand for effective treatments. Novel Oral Anticoagulants (NOACs) are a significant driver, offering improved efficacy and convenience compared to traditional Vitamin K antagonists (VKAs) like warfarin, leading to market share expansion. However, the high cost of NOACs and concerns about potential bleeding complications remain significant restraints, affecting market penetration, particularly in developing regions. The market is segmented by drug class (NOACs, Heparin/LMWH, VKAs) and application (atrial fibrillation, DVT, pulmonary embolism, others). The segment for Atrial Fibrillation/Myocardial Infarction dominates due to its high prevalence and the critical role of anticoagulation in preventing stroke. Geographic analysis reveals strong growth in North America and Europe, driven by high healthcare expenditure and advanced healthcare infrastructure. However, Asia-Pacific is emerging as a rapidly growing market, fueled by rising healthcare awareness, increasing disposable incomes, and expanding healthcare infrastructure. Competition is intense, with major pharmaceutical companies such as Boehringer Ingelheim, Bayer, Sanofi, and others actively engaged in developing and marketing innovative anticoagulation therapies.
The competitive landscape is characterized by both established players and emerging market entrants, leading to ongoing innovation and price competition. Strategic partnerships, mergers and acquisitions, and the development of biosimilars are expected to shape future market dynamics. The continued advancement of anticoagulant therapies, including the development of more targeted and safer drugs, will further drive market growth. Furthermore, improvements in diagnostic technologies and monitoring systems are expected to enhance the management and efficacy of anticoagulation therapy, contributing to market expansion. However, regulatory challenges related to drug approvals and pricing policies could affect market growth trajectories in certain regions. Future research will likely focus on personalized medicine approaches, aiming to tailor anticoagulation regimens to individual patient characteristics to improve both effectiveness and safety.
Anticoagulation Therapy Market Report: 2019-2033
This comprehensive report provides a detailed analysis of the Anticoagulation Therapy market, offering invaluable insights for stakeholders seeking to navigate this dynamic landscape. The study period covers 2019-2033, with a base year of 2025 and a forecast period of 2025-2033. The report leverages rigorous research methodologies to deliver actionable intelligence on market size, segmentation, growth drivers, challenges, competitive dynamics, and future outlook.
Anticoagulation Therapy Industry Market Structure & Competitive Dynamics
The Anticoagulation Therapy market is characterized by a moderately concentrated landscape with a few key players holding significant market share. Boehringer Ingelheim GmbH, Bayer AG, Sanofi, and Abbott Laboratories are among the leading companies, though the market also includes numerous smaller players and generic manufacturers like Dr. Reddy's Laboratories and Aspen Holdings. The competitive intensity is driven by innovation, price competition, and the pursuit of market share in various segments. The historical period (2019-2024) witnessed xx Million in M&A activity, with an estimated xx Million in deals expected during the forecast period (2025-2033).
- Market Concentration: The Herfindahl-Hirschman Index (HHI) for the market is estimated at xx, indicating a moderately concentrated structure.
- Innovation Ecosystems: Robust R&D efforts focus on developing novel anticoagulants with improved safety and efficacy profiles. Collaboration and partnerships are becoming increasingly prevalent.
- Regulatory Frameworks: Stringent regulatory approvals and post-market surveillance impact market entry and product lifecycle.
- Product Substitutes: Competition exists across different drug classes, with some showing significant crossover in therapeutic applications.
- End-User Trends: Increasing prevalence of cardiovascular diseases and a growing aging population drive demand for anticoagulation therapies.
- M&A Activities: Consolidation is anticipated, with larger companies seeking to expand their portfolios through acquisitions of smaller players.
Anticoagulation Therapy Industry Industry Trends & Insights
The global Anticoagulation Therapy market exhibits robust growth, driven by factors like the rising prevalence of cardiovascular diseases (CAGR of xx% during 2025-2033), an aging population, and increasing awareness regarding prevention and treatment. Technological advancements, such as the development of novel oral anticoagulants (NOACs) with improved safety profiles, are transforming the landscape. However, challenges such as bleeding risks, drug interactions, and high treatment costs influence market dynamics. Patient preferences are shifting toward oral therapies due to improved convenience and reduced need for frequent monitoring. Competitive dynamics are intense, driven by the launch of new products, generic competition, and pricing pressures. Market penetration of NOACs is expected to reach xx% by 2033, while the overall market size is projected to reach xx Million by the same year.
Dominant Markets & Segments in Anticoagulation Therapy Industry
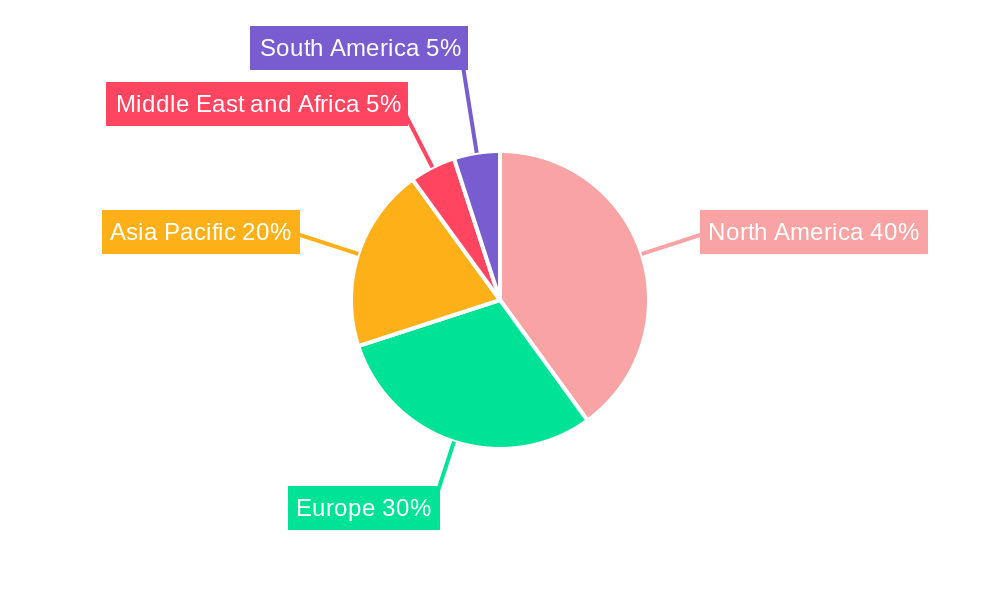
The North American market currently holds the largest share in the Anticoagulation Therapy market, driven by high healthcare expenditure, advanced healthcare infrastructure, and a high prevalence of cardiovascular diseases. However, the Asia-Pacific region is expected to exhibit significant growth during the forecast period.
By Drug Class:
- Novel Oral Anticoagulants (NOACs): Dominated by several key players and enjoys rapid growth due to convenience and efficacy, currently holding xx% market share.
- Heparin and Low Molecular Weight Heparin (LMWH): Remains significant, particularly in hospital settings, maintaining xx% market share due to established use and lower cost.
- Vitamin K Antagonist: Faces declining market share due to the rise of NOACs (xx% market share).
By Application:
- Atrial Fibrillation/Myocardial Infarction (Heart Attack): This segment is the largest, accounting for xx% of the market, due to the high prevalence of these conditions.
- Deep Vein Thrombosis (DVT) & Pulmonary Embolism: These applications represent a substantial portion of the market, with xx% market share collectively, with growth fueled by improved diagnostic capabilities.
- Other Applications: This includes various conditions where anticoagulation is necessary, capturing the remaining market share.
Key Drivers:
- Economic Policies: Increased healthcare spending and favorable reimbursement policies influence market growth.
- Infrastructure: Well-established healthcare infrastructure in developed markets enhances market access.
Anticoagulation Therapy Industry Product Innovations
Recent years have witnessed significant advancements in anticoagulation therapy. The development of NOACs has revolutionized treatment by offering improved safety profiles and reduced monitoring requirements compared to warfarin. Ongoing research focuses on enhancing efficacy, reducing bleeding risks, and developing personalized treatment approaches. The introduction of biosimilars and generics is also intensifying competition and driving down costs. These innovations are expected to further shape the market landscape and patient outcomes in the coming years.
Report Segmentation & Scope
The report segments the Anticoagulation Therapy market by drug class (NOACs, Heparin/LMWH, Vitamin K Antagonist) and application (Atrial Fibrillation/Myocardial Infarction, DVT, Pulmonary Embolism, Other). Each segment is analyzed based on its market size, growth rate, competitive dynamics, and key trends. Growth projections indicate significant expansion across all segments, with NOACs expected to show the fastest growth. The competitive landscape varies across segments, with some dominated by a few major players, while others exhibit greater fragmentation.
Key Drivers of Anticoagulation Therapy Industry Growth
The Anticoagulation Therapy market's growth is driven by several factors. The increasing prevalence of cardiovascular diseases, fueled by lifestyle changes and an aging population, is a primary driver. Technological advancements leading to safer and more effective anticoagulants, like NOACs, contribute significantly. Regulatory approvals and favorable reimbursement policies in various regions further boost market expansion. Finally, rising healthcare expenditure and improved awareness among patients and physicians also play a crucial role.
Challenges in the Anticoagulation Therapy Industry Sector
The Anticoagulation Therapy industry faces certain challenges. Stringent regulatory requirements for drug approvals and post-market surveillance add complexities to market entry and product lifecycle management. Supply chain disruptions and variations in raw material pricing can impact production and pricing. Intense competition from established players and emerging market entrants exert pressure on pricing and profitability. Furthermore, the inherent risks of bleeding associated with anticoagulation therapies necessitate careful patient monitoring and management.
Leading Players in the Anticoagulation Therapy Industry Market
- Boehringer Ingelheim GmbH
- Bayer AG
- Sanofi
- Dr Reddy's Laboratories
- Daiichi Sankyo Company
- Leo Pharma AS
- Abbott Laboratories
- Alexion Pharmaceuticals Inc
- Aspen Holdings
- Johnson & Johnson
- Bristol-Myers Squibb Company
- Pfizer Inc
Key Developments in Anticoagulation Therapy Industry Sector
- February 2022: The United States Food and Drug Administration granted fast-track status to Bayer's oral Factor Xia inhibitor Asundexian.
- February 2022: Techdow USA Inc. launched its Heparin Sodium Injection, USP in the United States market.
Strategic Anticoagulation Therapy Industry Market Outlook
The Anticoagulation Therapy market holds significant potential for future growth, driven by continuous innovation in drug development, expanding indications, and increasing global healthcare spending. Strategic opportunities lie in focusing on personalized medicine approaches, improving patient compliance through innovative delivery systems, and developing cost-effective solutions to address affordability concerns. Companies that invest in R&D, leverage technological advancements, and effectively address patient needs are best positioned for success in this dynamic market.
Anticoagulation Therapy Industry Segmentation
-
1. Drug Class
- 1.1. Novel Oral Anticoagulants (NOACs)
- 1.2. Heparin and Low Molecular Weight Heparin (LMWH)
- 1.3. Vitamin K Antagonist
-
2. Application
- 2.1. Atrial F
- 2.2. Deep Vein Thrombosis (DVT)
- 2.3. Pulmonary Embolism
- 2.4. Other Applications
Anticoagulation Therapy Industry Segmentation By Geography
-
1. North America
- 1.1. United States
- 1.2. Canada
- 1.3. Mexico
-
2. Europe
- 2.1. Germany
- 2.2. United Kingdom
- 2.3. France
- 2.4. Italy
- 2.5. Spain
- 2.6. Rest of Europe
-
3. Asia Pacific
- 3.1. China
- 3.2. Japan
- 3.3. India
- 3.4. Australia
- 3.5. South Korea
- 3.6. Rest of Asia Pacific
-
4. Middle East and Africa
- 4.1. GCC
- 4.2. South Africa
- 4.3. Rest of Middle East and Africa
-
5. South America
- 5.1. Brazil
- 5.2. Argentina
- 5.3. Rest of South America
Anticoagulation Therapy Industry REPORT HIGHLIGHTS
| Aspects | Details |
|---|---|
| Study Period | 2019-2033 |
| Base Year | 2024 |
| Estimated Year | 2025 |
| Forecast Period | 2025-2033 |
| Historical Period | 2019-2024 |
| Growth Rate | CAGR of 9.41% from 2019-2033 |
| Segmentation |
|
Table of Contents
- 1. Introduction
- 1.1. Research Scope
- 1.2. Market Segmentation
- 1.3. Research Methodology
- 1.4. Definitions and Assumptions
- 2. Executive Summary
- 2.1. Introduction
- 3. Market Dynamics
- 3.1. Introduction
- 3.2. Market Drivers
- 3.2.1. Increasing Cases of Chronic Diseases; Technological Advancements in Development of Anticoagulant Products; Growing Adoption of Novel Oral Anticoagulants (NOACs)
- 3.3. Market Restrains
- 3.3.1. Stringent Government Regulations; Side Effects Associated with Treatment
- 3.4. Market Trends
- 3.4.1. Novel Oral Anticoagulants (NOACs) Segment is Expected to Hold Significant Market Share in the Anticoagulants Market
- 4. Market Factor Analysis
- 4.1. Porters Five Forces
- 4.2. Supply/Value Chain
- 4.3. PESTEL analysis
- 4.4. Market Entropy
- 4.5. Patent/Trademark Analysis
- 5. Global Anticoagulation Therapy Industry Analysis, Insights and Forecast, 2019-2031
- 5.1. Market Analysis, Insights and Forecast - by Drug Class
- 5.1.1. Novel Oral Anticoagulants (NOACs)
- 5.1.2. Heparin and Low Molecular Weight Heparin (LMWH)
- 5.1.3. Vitamin K Antagonist
- 5.2. Market Analysis, Insights and Forecast - by Application
- 5.2.1. Atrial F
- 5.2.2. Deep Vein Thrombosis (DVT)
- 5.2.3. Pulmonary Embolism
- 5.2.4. Other Applications
- 5.3. Market Analysis, Insights and Forecast - by Region
- 5.3.1. North America
- 5.3.2. Europe
- 5.3.3. Asia Pacific
- 5.3.4. Middle East and Africa
- 5.3.5. South America
- 5.1. Market Analysis, Insights and Forecast - by Drug Class
- 6. North America Anticoagulation Therapy Industry Analysis, Insights and Forecast, 2019-2031
- 6.1. Market Analysis, Insights and Forecast - by Drug Class
- 6.1.1. Novel Oral Anticoagulants (NOACs)
- 6.1.2. Heparin and Low Molecular Weight Heparin (LMWH)
- 6.1.3. Vitamin K Antagonist
- 6.2. Market Analysis, Insights and Forecast - by Application
- 6.2.1. Atrial F
- 6.2.2. Deep Vein Thrombosis (DVT)
- 6.2.3. Pulmonary Embolism
- 6.2.4. Other Applications
- 6.1. Market Analysis, Insights and Forecast - by Drug Class
- 7. Europe Anticoagulation Therapy Industry Analysis, Insights and Forecast, 2019-2031
- 7.1. Market Analysis, Insights and Forecast - by Drug Class
- 7.1.1. Novel Oral Anticoagulants (NOACs)
- 7.1.2. Heparin and Low Molecular Weight Heparin (LMWH)
- 7.1.3. Vitamin K Antagonist
- 7.2. Market Analysis, Insights and Forecast - by Application
- 7.2.1. Atrial F
- 7.2.2. Deep Vein Thrombosis (DVT)
- 7.2.3. Pulmonary Embolism
- 7.2.4. Other Applications
- 7.1. Market Analysis, Insights and Forecast - by Drug Class
- 8. Asia Pacific Anticoagulation Therapy Industry Analysis, Insights and Forecast, 2019-2031
- 8.1. Market Analysis, Insights and Forecast - by Drug Class
- 8.1.1. Novel Oral Anticoagulants (NOACs)
- 8.1.2. Heparin and Low Molecular Weight Heparin (LMWH)
- 8.1.3. Vitamin K Antagonist
- 8.2. Market Analysis, Insights and Forecast - by Application
- 8.2.1. Atrial F
- 8.2.2. Deep Vein Thrombosis (DVT)
- 8.2.3. Pulmonary Embolism
- 8.2.4. Other Applications
- 8.1. Market Analysis, Insights and Forecast - by Drug Class
- 9. Middle East and Africa Anticoagulation Therapy Industry Analysis, Insights and Forecast, 2019-2031
- 9.1. Market Analysis, Insights and Forecast - by Drug Class
- 9.1.1. Novel Oral Anticoagulants (NOACs)
- 9.1.2. Heparin and Low Molecular Weight Heparin (LMWH)
- 9.1.3. Vitamin K Antagonist
- 9.2. Market Analysis, Insights and Forecast - by Application
- 9.2.1. Atrial F
- 9.2.2. Deep Vein Thrombosis (DVT)
- 9.2.3. Pulmonary Embolism
- 9.2.4. Other Applications
- 9.1. Market Analysis, Insights and Forecast - by Drug Class
- 10. South America Anticoagulation Therapy Industry Analysis, Insights and Forecast, 2019-2031
- 10.1. Market Analysis, Insights and Forecast - by Drug Class
- 10.1.1. Novel Oral Anticoagulants (NOACs)
- 10.1.2. Heparin and Low Molecular Weight Heparin (LMWH)
- 10.1.3. Vitamin K Antagonist
- 10.2. Market Analysis, Insights and Forecast - by Application
- 10.2.1. Atrial F
- 10.2.2. Deep Vein Thrombosis (DVT)
- 10.2.3. Pulmonary Embolism
- 10.2.4. Other Applications
- 10.1. Market Analysis, Insights and Forecast - by Drug Class
- 11. North America Anticoagulation Therapy Industry Analysis, Insights and Forecast, 2019-2031
- 11.1. Market Analysis, Insights and Forecast - By Country/Sub-region
- 11.1.1 United States
- 11.1.2 Canada
- 11.1.3 Mexico
- 12. Europe Anticoagulation Therapy Industry Analysis, Insights and Forecast, 2019-2031
- 12.1. Market Analysis, Insights and Forecast - By Country/Sub-region
- 12.1.1 Germany
- 12.1.2 United Kingdom
- 12.1.3 France
- 12.1.4 Italy
- 12.1.5 Spain
- 12.1.6 Rest of Europe
- 13. Asia Pacific Anticoagulation Therapy Industry Analysis, Insights and Forecast, 2019-2031
- 13.1. Market Analysis, Insights and Forecast - By Country/Sub-region
- 13.1.1 China
- 13.1.2 Japan
- 13.1.3 India
- 13.1.4 Australia
- 13.1.5 South Korea
- 13.1.6 Rest of Asia Pacific
- 14. Middle East and Africa Anticoagulation Therapy Industry Analysis, Insights and Forecast, 2019-2031
- 14.1. Market Analysis, Insights and Forecast - By Country/Sub-region
- 14.1.1 GCC
- 14.1.2 South Africa
- 14.1.3 Rest of Middle East and Africa
- 15. South America Anticoagulation Therapy Industry Analysis, Insights and Forecast, 2019-2031
- 15.1. Market Analysis, Insights and Forecast - By Country/Sub-region
- 15.1.1 Brazil
- 15.1.2 Argentina
- 15.1.3 Rest of South America
- 16. Competitive Analysis
- 16.1. Global Market Share Analysis 2024
- 16.2. Company Profiles
- 16.2.1 Boehringer Ingelheim GmbH
- 16.2.1.1. Overview
- 16.2.1.2. Products
- 16.2.1.3. SWOT Analysis
- 16.2.1.4. Recent Developments
- 16.2.1.5. Financials (Based on Availability)
- 16.2.2 Bayer AG
- 16.2.2.1. Overview
- 16.2.2.2. Products
- 16.2.2.3. SWOT Analysis
- 16.2.2.4. Recent Developments
- 16.2.2.5. Financials (Based on Availability)
- 16.2.3 Sanofi
- 16.2.3.1. Overview
- 16.2.3.2. Products
- 16.2.3.3. SWOT Analysis
- 16.2.3.4. Recent Developments
- 16.2.3.5. Financials (Based on Availability)
- 16.2.4 Dr Reddy's Laboratories *List Not Exhaustive
- 16.2.4.1. Overview
- 16.2.4.2. Products
- 16.2.4.3. SWOT Analysis
- 16.2.4.4. Recent Developments
- 16.2.4.5. Financials (Based on Availability)
- 16.2.5 Daiichi Sankyo Company
- 16.2.5.1. Overview
- 16.2.5.2. Products
- 16.2.5.3. SWOT Analysis
- 16.2.5.4. Recent Developments
- 16.2.5.5. Financials (Based on Availability)
- 16.2.6 Leo Pharma AS
- 16.2.6.1. Overview
- 16.2.6.2. Products
- 16.2.6.3. SWOT Analysis
- 16.2.6.4. Recent Developments
- 16.2.6.5. Financials (Based on Availability)
- 16.2.7 Abbott Laboratories
- 16.2.7.1. Overview
- 16.2.7.2. Products
- 16.2.7.3. SWOT Analysis
- 16.2.7.4. Recent Developments
- 16.2.7.5. Financials (Based on Availability)
- 16.2.8 Alexion Pharmaceuticals Inc
- 16.2.8.1. Overview
- 16.2.8.2. Products
- 16.2.8.3. SWOT Analysis
- 16.2.8.4. Recent Developments
- 16.2.8.5. Financials (Based on Availability)
- 16.2.9 Aspen Holdings
- 16.2.9.1. Overview
- 16.2.9.2. Products
- 16.2.9.3. SWOT Analysis
- 16.2.9.4. Recent Developments
- 16.2.9.5. Financials (Based on Availability)
- 16.2.10 Johnson & Johnson
- 16.2.10.1. Overview
- 16.2.10.2. Products
- 16.2.10.3. SWOT Analysis
- 16.2.10.4. Recent Developments
- 16.2.10.5. Financials (Based on Availability)
- 16.2.11 Bristol-Myers Squibb Company
- 16.2.11.1. Overview
- 16.2.11.2. Products
- 16.2.11.3. SWOT Analysis
- 16.2.11.4. Recent Developments
- 16.2.11.5. Financials (Based on Availability)
- 16.2.12 Pfizer Inc
- 16.2.12.1. Overview
- 16.2.12.2. Products
- 16.2.12.3. SWOT Analysis
- 16.2.12.4. Recent Developments
- 16.2.12.5. Financials (Based on Availability)
- 16.2.1 Boehringer Ingelheim GmbH
List of Figures
- Figure 1: Global Anticoagulation Therapy Industry Revenue Breakdown (Million, %) by Region 2024 & 2032
- Figure 2: North America Anticoagulation Therapy Industry Revenue (Million), by Country 2024 & 2032
- Figure 3: North America Anticoagulation Therapy Industry Revenue Share (%), by Country 2024 & 2032
- Figure 4: Europe Anticoagulation Therapy Industry Revenue (Million), by Country 2024 & 2032
- Figure 5: Europe Anticoagulation Therapy Industry Revenue Share (%), by Country 2024 & 2032
- Figure 6: Asia Pacific Anticoagulation Therapy Industry Revenue (Million), by Country 2024 & 2032
- Figure 7: Asia Pacific Anticoagulation Therapy Industry Revenue Share (%), by Country 2024 & 2032
- Figure 8: Middle East and Africa Anticoagulation Therapy Industry Revenue (Million), by Country 2024 & 2032
- Figure 9: Middle East and Africa Anticoagulation Therapy Industry Revenue Share (%), by Country 2024 & 2032
- Figure 10: South America Anticoagulation Therapy Industry Revenue (Million), by Country 2024 & 2032
- Figure 11: South America Anticoagulation Therapy Industry Revenue Share (%), by Country 2024 & 2032
- Figure 12: North America Anticoagulation Therapy Industry Revenue (Million), by Drug Class 2024 & 2032
- Figure 13: North America Anticoagulation Therapy Industry Revenue Share (%), by Drug Class 2024 & 2032
- Figure 14: North America Anticoagulation Therapy Industry Revenue (Million), by Application 2024 & 2032
- Figure 15: North America Anticoagulation Therapy Industry Revenue Share (%), by Application 2024 & 2032
- Figure 16: North America Anticoagulation Therapy Industry Revenue (Million), by Country 2024 & 2032
- Figure 17: North America Anticoagulation Therapy Industry Revenue Share (%), by Country 2024 & 2032
- Figure 18: Europe Anticoagulation Therapy Industry Revenue (Million), by Drug Class 2024 & 2032
- Figure 19: Europe Anticoagulation Therapy Industry Revenue Share (%), by Drug Class 2024 & 2032
- Figure 20: Europe Anticoagulation Therapy Industry Revenue (Million), by Application 2024 & 2032
- Figure 21: Europe Anticoagulation Therapy Industry Revenue Share (%), by Application 2024 & 2032
- Figure 22: Europe Anticoagulation Therapy Industry Revenue (Million), by Country 2024 & 2032
- Figure 23: Europe Anticoagulation Therapy Industry Revenue Share (%), by Country 2024 & 2032
- Figure 24: Asia Pacific Anticoagulation Therapy Industry Revenue (Million), by Drug Class 2024 & 2032
- Figure 25: Asia Pacific Anticoagulation Therapy Industry Revenue Share (%), by Drug Class 2024 & 2032
- Figure 26: Asia Pacific Anticoagulation Therapy Industry Revenue (Million), by Application 2024 & 2032
- Figure 27: Asia Pacific Anticoagulation Therapy Industry Revenue Share (%), by Application 2024 & 2032
- Figure 28: Asia Pacific Anticoagulation Therapy Industry Revenue (Million), by Country 2024 & 2032
- Figure 29: Asia Pacific Anticoagulation Therapy Industry Revenue Share (%), by Country 2024 & 2032
- Figure 30: Middle East and Africa Anticoagulation Therapy Industry Revenue (Million), by Drug Class 2024 & 2032
- Figure 31: Middle East and Africa Anticoagulation Therapy Industry Revenue Share (%), by Drug Class 2024 & 2032
- Figure 32: Middle East and Africa Anticoagulation Therapy Industry Revenue (Million), by Application 2024 & 2032
- Figure 33: Middle East and Africa Anticoagulation Therapy Industry Revenue Share (%), by Application 2024 & 2032
- Figure 34: Middle East and Africa Anticoagulation Therapy Industry Revenue (Million), by Country 2024 & 2032
- Figure 35: Middle East and Africa Anticoagulation Therapy Industry Revenue Share (%), by Country 2024 & 2032
- Figure 36: South America Anticoagulation Therapy Industry Revenue (Million), by Drug Class 2024 & 2032
- Figure 37: South America Anticoagulation Therapy Industry Revenue Share (%), by Drug Class 2024 & 2032
- Figure 38: South America Anticoagulation Therapy Industry Revenue (Million), by Application 2024 & 2032
- Figure 39: South America Anticoagulation Therapy Industry Revenue Share (%), by Application 2024 & 2032
- Figure 40: South America Anticoagulation Therapy Industry Revenue (Million), by Country 2024 & 2032
- Figure 41: South America Anticoagulation Therapy Industry Revenue Share (%), by Country 2024 & 2032
List of Tables
- Table 1: Global Anticoagulation Therapy Industry Revenue Million Forecast, by Region 2019 & 2032
- Table 2: Global Anticoagulation Therapy Industry Revenue Million Forecast, by Drug Class 2019 & 2032
- Table 3: Global Anticoagulation Therapy Industry Revenue Million Forecast, by Application 2019 & 2032
- Table 4: Global Anticoagulation Therapy Industry Revenue Million Forecast, by Region 2019 & 2032
- Table 5: Global Anticoagulation Therapy Industry Revenue Million Forecast, by Country 2019 & 2032
- Table 6: United States Anticoagulation Therapy Industry Revenue (Million) Forecast, by Application 2019 & 2032
- Table 7: Canada Anticoagulation Therapy Industry Revenue (Million) Forecast, by Application 2019 & 2032
- Table 8: Mexico Anticoagulation Therapy Industry Revenue (Million) Forecast, by Application 2019 & 2032
- Table 9: Global Anticoagulation Therapy Industry Revenue Million Forecast, by Country 2019 & 2032
- Table 10: Germany Anticoagulation Therapy Industry Revenue (Million) Forecast, by Application 2019 & 2032
- Table 11: United Kingdom Anticoagulation Therapy Industry Revenue (Million) Forecast, by Application 2019 & 2032
- Table 12: France Anticoagulation Therapy Industry Revenue (Million) Forecast, by Application 2019 & 2032
- Table 13: Italy Anticoagulation Therapy Industry Revenue (Million) Forecast, by Application 2019 & 2032
- Table 14: Spain Anticoagulation Therapy Industry Revenue (Million) Forecast, by Application 2019 & 2032
- Table 15: Rest of Europe Anticoagulation Therapy Industry Revenue (Million) Forecast, by Application 2019 & 2032
- Table 16: Global Anticoagulation Therapy Industry Revenue Million Forecast, by Country 2019 & 2032
- Table 17: China Anticoagulation Therapy Industry Revenue (Million) Forecast, by Application 2019 & 2032
- Table 18: Japan Anticoagulation Therapy Industry Revenue (Million) Forecast, by Application 2019 & 2032
- Table 19: India Anticoagulation Therapy Industry Revenue (Million) Forecast, by Application 2019 & 2032
- Table 20: Australia Anticoagulation Therapy Industry Revenue (Million) Forecast, by Application 2019 & 2032
- Table 21: South Korea Anticoagulation Therapy Industry Revenue (Million) Forecast, by Application 2019 & 2032
- Table 22: Rest of Asia Pacific Anticoagulation Therapy Industry Revenue (Million) Forecast, by Application 2019 & 2032
- Table 23: Global Anticoagulation Therapy Industry Revenue Million Forecast, by Country 2019 & 2032
- Table 24: GCC Anticoagulation Therapy Industry Revenue (Million) Forecast, by Application 2019 & 2032
- Table 25: South Africa Anticoagulation Therapy Industry Revenue (Million) Forecast, by Application 2019 & 2032
- Table 26: Rest of Middle East and Africa Anticoagulation Therapy Industry Revenue (Million) Forecast, by Application 2019 & 2032
- Table 27: Global Anticoagulation Therapy Industry Revenue Million Forecast, by Country 2019 & 2032
- Table 28: Brazil Anticoagulation Therapy Industry Revenue (Million) Forecast, by Application 2019 & 2032
- Table 29: Argentina Anticoagulation Therapy Industry Revenue (Million) Forecast, by Application 2019 & 2032
- Table 30: Rest of South America Anticoagulation Therapy Industry Revenue (Million) Forecast, by Application 2019 & 2032
- Table 31: Global Anticoagulation Therapy Industry Revenue Million Forecast, by Drug Class 2019 & 2032
- Table 32: Global Anticoagulation Therapy Industry Revenue Million Forecast, by Application 2019 & 2032
- Table 33: Global Anticoagulation Therapy Industry Revenue Million Forecast, by Country 2019 & 2032
- Table 34: United States Anticoagulation Therapy Industry Revenue (Million) Forecast, by Application 2019 & 2032
- Table 35: Canada Anticoagulation Therapy Industry Revenue (Million) Forecast, by Application 2019 & 2032
- Table 36: Mexico Anticoagulation Therapy Industry Revenue (Million) Forecast, by Application 2019 & 2032
- Table 37: Global Anticoagulation Therapy Industry Revenue Million Forecast, by Drug Class 2019 & 2032
- Table 38: Global Anticoagulation Therapy Industry Revenue Million Forecast, by Application 2019 & 2032
- Table 39: Global Anticoagulation Therapy Industry Revenue Million Forecast, by Country 2019 & 2032
- Table 40: Germany Anticoagulation Therapy Industry Revenue (Million) Forecast, by Application 2019 & 2032
- Table 41: United Kingdom Anticoagulation Therapy Industry Revenue (Million) Forecast, by Application 2019 & 2032
- Table 42: France Anticoagulation Therapy Industry Revenue (Million) Forecast, by Application 2019 & 2032
- Table 43: Italy Anticoagulation Therapy Industry Revenue (Million) Forecast, by Application 2019 & 2032
- Table 44: Spain Anticoagulation Therapy Industry Revenue (Million) Forecast, by Application 2019 & 2032
- Table 45: Rest of Europe Anticoagulation Therapy Industry Revenue (Million) Forecast, by Application 2019 & 2032
- Table 46: Global Anticoagulation Therapy Industry Revenue Million Forecast, by Drug Class 2019 & 2032
- Table 47: Global Anticoagulation Therapy Industry Revenue Million Forecast, by Application 2019 & 2032
- Table 48: Global Anticoagulation Therapy Industry Revenue Million Forecast, by Country 2019 & 2032
- Table 49: China Anticoagulation Therapy Industry Revenue (Million) Forecast, by Application 2019 & 2032
- Table 50: Japan Anticoagulation Therapy Industry Revenue (Million) Forecast, by Application 2019 & 2032
- Table 51: India Anticoagulation Therapy Industry Revenue (Million) Forecast, by Application 2019 & 2032
- Table 52: Australia Anticoagulation Therapy Industry Revenue (Million) Forecast, by Application 2019 & 2032
- Table 53: South Korea Anticoagulation Therapy Industry Revenue (Million) Forecast, by Application 2019 & 2032
- Table 54: Rest of Asia Pacific Anticoagulation Therapy Industry Revenue (Million) Forecast, by Application 2019 & 2032
- Table 55: Global Anticoagulation Therapy Industry Revenue Million Forecast, by Drug Class 2019 & 2032
- Table 56: Global Anticoagulation Therapy Industry Revenue Million Forecast, by Application 2019 & 2032
- Table 57: Global Anticoagulation Therapy Industry Revenue Million Forecast, by Country 2019 & 2032
- Table 58: GCC Anticoagulation Therapy Industry Revenue (Million) Forecast, by Application 2019 & 2032
- Table 59: South Africa Anticoagulation Therapy Industry Revenue (Million) Forecast, by Application 2019 & 2032
- Table 60: Rest of Middle East and Africa Anticoagulation Therapy Industry Revenue (Million) Forecast, by Application 2019 & 2032
- Table 61: Global Anticoagulation Therapy Industry Revenue Million Forecast, by Drug Class 2019 & 2032
- Table 62: Global Anticoagulation Therapy Industry Revenue Million Forecast, by Application 2019 & 2032
- Table 63: Global Anticoagulation Therapy Industry Revenue Million Forecast, by Country 2019 & 2032
- Table 64: Brazil Anticoagulation Therapy Industry Revenue (Million) Forecast, by Application 2019 & 2032
- Table 65: Argentina Anticoagulation Therapy Industry Revenue (Million) Forecast, by Application 2019 & 2032
- Table 66: Rest of South America Anticoagulation Therapy Industry Revenue (Million) Forecast, by Application 2019 & 2032
Frequently Asked Questions
1. What is the projected Compound Annual Growth Rate (CAGR) of the Anticoagulation Therapy Industry?
The projected CAGR is approximately 9.41%.
2. Which companies are prominent players in the Anticoagulation Therapy Industry?
Key companies in the market include Boehringer Ingelheim GmbH, Bayer AG, Sanofi, Dr Reddy's Laboratories *List Not Exhaustive, Daiichi Sankyo Company, Leo Pharma AS, Abbott Laboratories, Alexion Pharmaceuticals Inc, Aspen Holdings, Johnson & Johnson, Bristol-Myers Squibb Company, Pfizer Inc.
3. What are the main segments of the Anticoagulation Therapy Industry?
The market segments include Drug Class, Application.
4. Can you provide details about the market size?
The market size is estimated to be USD XX Million as of 2022.
5. What are some drivers contributing to market growth?
Increasing Cases of Chronic Diseases; Technological Advancements in Development of Anticoagulant Products; Growing Adoption of Novel Oral Anticoagulants (NOACs).
6. What are the notable trends driving market growth?
Novel Oral Anticoagulants (NOACs) Segment is Expected to Hold Significant Market Share in the Anticoagulants Market.
7. Are there any restraints impacting market growth?
Stringent Government Regulations; Side Effects Associated with Treatment.
8. Can you provide examples of recent developments in the market?
In February 2022, The United States Food and Drug Administration granted fast-track status to Bayer's oral Factor Xia inhibitor Asundexian, which is in phase 2 testing as an anticoagulant that could offer safety advantages over current drugs.
9. What pricing options are available for accessing the report?
Pricing options include single-user, multi-user, and enterprise licenses priced at USD 4750, USD 5250, and USD 8750 respectively.
10. Is the market size provided in terms of value or volume?
The market size is provided in terms of value, measured in Million.
11. Are there any specific market keywords associated with the report?
Yes, the market keyword associated with the report is "Anticoagulation Therapy Industry," which aids in identifying and referencing the specific market segment covered.
12. How do I determine which pricing option suits my needs best?
The pricing options vary based on user requirements and access needs. Individual users may opt for single-user licenses, while businesses requiring broader access may choose multi-user or enterprise licenses for cost-effective access to the report.
13. Are there any additional resources or data provided in the Anticoagulation Therapy Industry report?
While the report offers comprehensive insights, it's advisable to review the specific contents or supplementary materials provided to ascertain if additional resources or data are available.
14. How can I stay updated on further developments or reports in the Anticoagulation Therapy Industry?
To stay informed about further developments, trends, and reports in the Anticoagulation Therapy Industry, consider subscribing to industry newsletters, following relevant companies and organizations, or regularly checking reputable industry news sources and publications.
Methodology
Step 1 - Identification of Relevant Samples Size from Population Database


Step 2 - Approaches for Defining Global Market Size (Value, Volume* & Price*)

Note*: In applicable scenarios
Step 3 - Data Sources
Primary Research
- Web Analytics
- Survey Reports
- Research Institute
- Latest Research Reports
- Opinion Leaders
Secondary Research
- Annual Reports
- White Paper
- Latest Press Release
- Industry Association
- Paid Database
- Investor Presentations

Step 4 - Data Triangulation
Involves using different sources of information in order to increase the validity of a study
These sources are likely to be stakeholders in a program - participants, other researchers, program staff, other community members, and so on.
Then we put all data in single framework & apply various statistical tools to find out the dynamic on the market.
During the analysis stage, feedback from the stakeholder groups would be compared to determine areas of agreement as well as areas of divergence


