
Key Insights
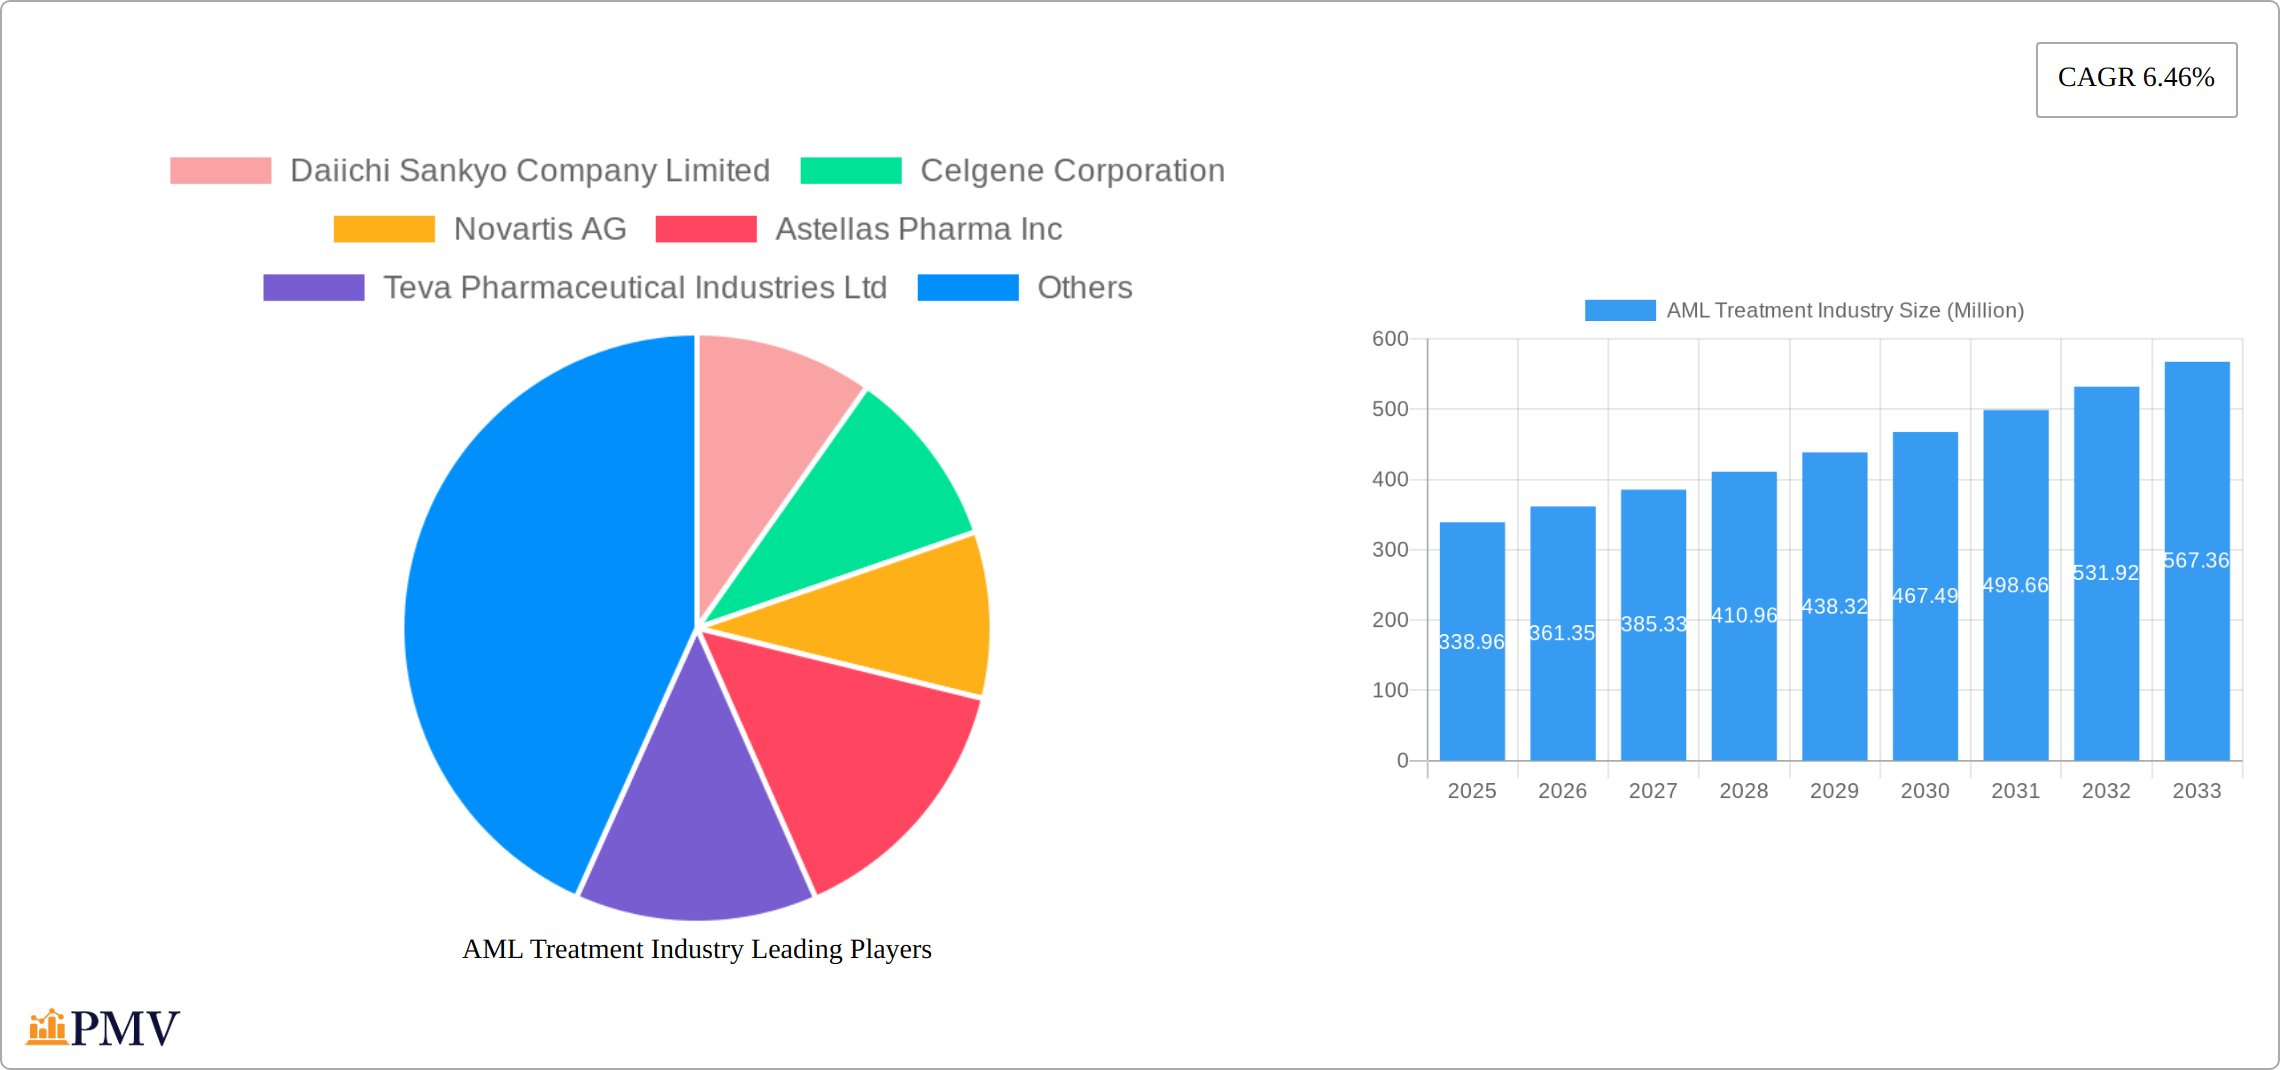
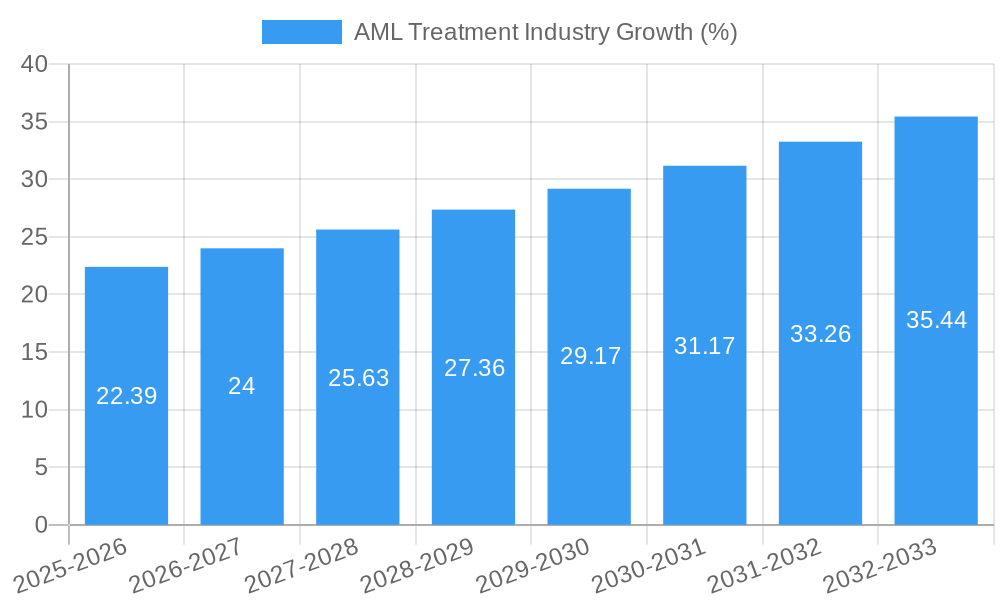
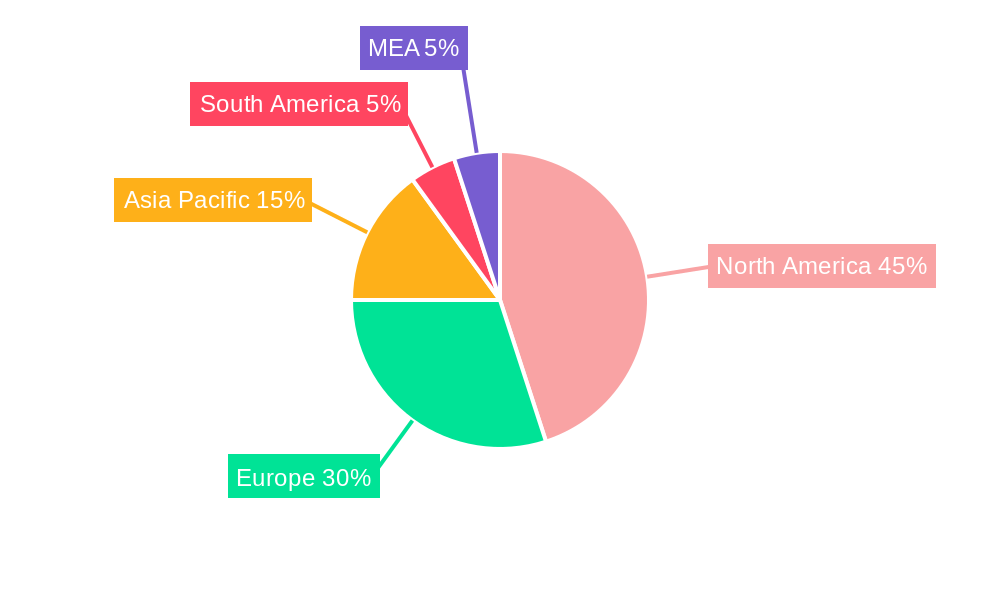
The Acute Myeloid Leukemia (AML) treatment market, valued at $338.96 million in 2025, is projected to experience robust growth, driven by a rising elderly population (increasing susceptibility to AML), advancements in targeted therapies, and the emergence of innovative treatment approaches like CAR T-cell therapy and bispecific antibodies. The market's Compound Annual Growth Rate (CAGR) of 6.46% from 2025 to 2033 indicates significant expansion potential. Key therapeutic segments include chemotherapy, targeted therapy, stem cell transplantation, and other therapies. Chemotherapy currently dominates, but targeted therapies are gaining traction due to their improved efficacy and reduced side effects. The increasing prevalence of AML, coupled with growing healthcare expenditure globally, further fuels market growth. However, challenges remain, including high treatment costs, potential side effects associated with certain therapies, and the need for personalized treatment strategies to optimize outcomes. Geographical variations in healthcare infrastructure and access to advanced therapies also contribute to market disparities. North America and Europe are currently the largest markets due to higher healthcare expenditure and advanced medical infrastructure, while the Asia-Pacific region is expected to exhibit significant growth potential in the forecast period owing to increasing awareness, improving healthcare infrastructure and growing disposable incomes.
The competitive landscape is characterized by several prominent pharmaceutical companies, including Daiichi Sankyo, Celgene, Novartis, Astellas Pharma, Teva Pharmaceutical Industries, AbbVie, Sun Pharmaceutical Industries, Fresenius SE & Co. KGaA, Viatris, and Pfizer. These companies are actively involved in R&D, clinical trials, and strategic partnerships to develop novel AML therapies and expand their market share. The future of the AML treatment market is likely to be shaped by the ongoing development of more effective and less toxic therapies, increased focus on personalized medicine, and the growing adoption of innovative treatment modalities. Market expansion will depend on the success of ongoing clinical trials, regulatory approvals, and the successful commercialization of new therapies. The continuing focus on improving patient outcomes and reducing treatment-related toxicity will drive innovation and shape the competitive dynamics in this crucial area of oncology.
AML Treatment Industry: Market Analysis & Forecast 2019-2033
This comprehensive report provides a detailed analysis of the AML (Acute Myeloid Leukemia) treatment industry, offering invaluable insights for stakeholders across the pharmaceutical landscape. The study period covers 2019-2033, with 2025 serving as the base and estimated year. The report analyzes a market valued at xx Million in 2025, projecting significant growth through 2033. Key players such as Daiichi Sankyo Company Limited, Celgene Corporation, Novartis AG, Astellas Pharma Inc, Teva Pharmaceutical Industries Ltd, AbbVie Inc, Sun Pharmaceutical Industries Ltd, Fresenius SE & Co KGaA, Viatris (Mylan NV), and Pfizer Inc. are thoroughly examined. The report segments the market by therapy type (Chemotherapy, Targeted Therapy, Stem Cell Transplant, and Other Therapies), providing granular market size estimations and growth forecasts for each segment.
AML Treatment Industry Market Structure & Competitive Dynamics
The AML treatment market exhibits a moderately concentrated structure, with a few multinational pharmaceutical companies holding significant market share. The industry is characterized by a dynamic innovation ecosystem fueled by continuous research and development efforts focused on novel therapies and targeted treatments. Stringent regulatory frameworks, including those governing drug approvals and clinical trials, significantly impact market dynamics. The presence of established therapies and the emergence of novel treatment options create a competitive landscape. The industry has witnessed several M&A activities in recent years, with deals valued at xx Million driving consolidation and expansion.
- Market Concentration: The top five players account for approximately xx% of the global market share in 2025.
- Innovation Ecosystem: Significant investment in R&D leads to frequent introduction of new therapies, driving market growth.
- Regulatory Framework: Stringent regulatory processes influence the speed of drug approvals and market entry.
- Product Substitutes: While limited, alternative treatments exist and exert competitive pressure.
- End-User Trends: Increasing awareness and demand for targeted and less toxic therapies are shaping the market.
- M&A Activities: Consolidation through mergers and acquisitions is reshaping the industry landscape, with deals totaling xx Million observed in the past five years.
AML Treatment Industry Industry Trends & Insights
The AML treatment market is experiencing robust growth, driven by factors such as rising prevalence of AML, increasing geriatric population, and advancements in targeted therapies. The market is witnessing a shift towards personalized medicine, where treatments are tailored to individual patient genetic profiles. Technological advancements, including advancements in immunotherapy and gene therapy, are revolutionizing treatment approaches. Consumer preference is increasingly shifting toward minimally invasive therapies with fewer side effects. The market’s CAGR from 2025 to 2033 is projected to be xx%, with market penetration of xx% by 2033 in developed economies. Competitive dynamics are further intensified by the ongoing development and approval of novel therapies and the increasing focus on improving patient outcomes. The introduction of new drugs and therapies is leading to significant competitive pressure on existing players. These developments are simultaneously driving innovation and expanding market potential.
Dominant Markets & Segments in AML Treatment Industry
The North American region dominates the global AML treatment market, primarily driven by high healthcare expenditure, strong regulatory support for new drug approvals, and advanced healthcare infrastructure. This region exhibits a high prevalence of AML and a robust pharmaceutical industry actively involved in R&D efforts.
- Key Drivers for North America Dominance:
- High healthcare expenditure.
- Advanced healthcare infrastructure and readily available treatment facilities.
- Strong regulatory support for new drug approvals, expediting market entry for innovative therapies.
- High prevalence of AML in the older population.
- Significant R&D investments by pharmaceutical companies.
Segment Analysis:
Chemotherapy remains the dominant segment, largely due to its established efficacy and widespread availability. However, targeted therapies are rapidly gaining traction, owing to their improved selectivity and reduced side effects. Stem cell transplants are seeing growth, driven by increased success rates and the expanded application of less toxic conditioning regimens. The "Other Therapies" segment encompasses emerging treatments, with the potential for significant future growth.
AML Treatment Industry Product Innovations
Recent years have witnessed significant innovation in AML treatment, with a focus on targeted therapies and immunotherapies designed to improve treatment efficacy and reduce side effects. Advances in gene editing technologies hold promise for more precise and effective treatments. The market is seeing a gradual shift away from conventional chemotherapy towards newer modalities that target specific molecular pathways involved in AML development. These innovations enhance treatment outcomes and patient quality of life, pushing the boundaries of AML management. The technological shift toward personalized medicine is creating a substantial demand for novel and targeted therapies.
Report Segmentation & Scope
The report segments the AML treatment market primarily by therapy type:
- Chemotherapy: This segment includes conventional chemotherapy regimens, and is projected to witness a CAGR of xx% from 2025-2033. Competitive dynamics are characterized by a mix of established and newer agents.
- Targeted Therapy: This rapidly growing segment, with a projected CAGR of xx% from 2025-2033, involves therapies targeting specific molecular pathways and mutations. The competitive landscape is dynamic, with multiple emerging therapies.
- Stem Cell Transplant: This segment is expected to exhibit a CAGR of xx% from 2025-2033. Competitive pressures stem from the need for specialized facilities and expertise.
- Other Therapies: This segment encompasses immunotherapy, gene therapy, and other innovative approaches. It holds substantial potential for future growth, with a projected CAGR of xx% from 2025-2033.
Key Drivers of AML Treatment Industry Growth
The AML treatment market is fueled by several key factors: The increasing prevalence of AML, particularly among the elderly, is a significant driver. Advancements in targeted therapies, offering improved efficacy and reduced side effects, are increasing market demand. Rising healthcare expenditure, coupled with improved reimbursement policies, expands access to advanced treatments. Favorable regulatory environments, facilitating the approval of innovative therapies, further accelerate market growth.
Challenges in the AML Treatment Industry Sector
Despite the significant growth potential, the AML treatment industry faces hurdles. High drug development costs coupled with stringent regulatory requirements create substantial financial barriers to entry for smaller companies. Supply chain disruptions can impact the availability of essential treatment components. The intense competition among established players, who are actively investing in R&D, makes it challenging for new entrants to gain significant market share. These factors collectively impact the overall market growth trajectory.
Leading Players in the AML Treatment Industry Market
- Daiichi Sankyo Company Limited
- Celgene Corporation
- Novartis AG
- Astellas Pharma Inc
- Teva Pharmaceutical Industries Ltd
- AbbVie Inc
- Sun Pharmaceutical Industries Ltd
- Fresenius SE & Co KGaA
- Viatris (Mylan NV)
- Pfizer Inc
Key Developments in AML Treatment Industry Sector
- May 2024: Nippon Shinyaku Co., Ltd. introduced Vyxeos Combination, an I.V. injection targeting high-risk AML patients in Japan. This launch expands treatment options for a challenging patient population.
- March 2024: Novartis India secured a distribution partner for Asciminib, designed to combat CML, broadening market access for this targeted therapy in India. This strategic partnership accelerates market penetration for a novel therapy.
Strategic AML Treatment Industry Market Outlook
The AML treatment market presents significant long-term growth potential driven by continuous innovation in targeted therapies, immunotherapy, and gene editing technologies. The development of personalized medicine approaches and increased focus on improving patient outcomes create substantial strategic opportunities for both established and emerging players. Further market expansion is projected due to increased investment in R&D and growing awareness among healthcare professionals and patients regarding the benefits of advanced treatments.
AML Treatment Industry Segmentation
-
1. Therapy
-
1.1. Chemotherapy
- 1.1.1. Anthracycline Drugs
- 1.1.2. Alkylating Agents
- 1.1.3. Anti-metabolites
- 1.1.4. Other Chemotherapies
- 1.2. Targeted Therapy
- 1.3. Stem Cell Transplant
- 1.4. Other Therapies
-
1.1. Chemotherapy
-
2. Geography
- 2.1. China
- 2.2. Japan
- 2.3. India
- 2.4. Australia
- 2.5. South Korea
- 2.6. Rest of Asia-Pacific
AML Treatment Industry Segmentation By Geography
- 1. China
- 2. Japan
- 3. India
- 4. Australia
- 5. South Korea
- 6. Rest of Asia Pacific
AML Treatment Industry REPORT HIGHLIGHTS
| Aspects | Details |
|---|---|
| Study Period | 2019-2033 |
| Base Year | 2024 |
| Estimated Year | 2025 |
| Forecast Period | 2025-2033 |
| Historical Period | 2019-2024 |
| Growth Rate | CAGR of 6.46% from 2019-2033 |
| Segmentation |
|
Table of Contents
- 1. Introduction
- 1.1. Research Scope
- 1.2. Market Segmentation
- 1.3. Research Methodology
- 1.4. Definitions and Assumptions
- 2. Executive Summary
- 2.1. Introduction
- 3. Market Dynamics
- 3.1. Introduction
- 3.2. Market Drivers
- 3.2.1. High Incidence and Prevalence of Acute Myeloid Leukemia; Advancement in Pharmacology and Molecular Biology to Promote Drug Development
- 3.3. Market Restrains
- 3.3.1. Complications Related to Chemotherapy
- 3.4. Market Trends
- 3.4.1. The Chemotherapy Segment is Anticipated to Witness a Growth Over the Forecast Period
- 4. Market Factor Analysis
- 4.1. Porters Five Forces
- 4.2. Supply/Value Chain
- 4.3. PESTEL analysis
- 4.4. Market Entropy
- 4.5. Patent/Trademark Analysis
- 5. Global AML Treatment Industry Analysis, Insights and Forecast, 2019-2031
- 5.1. Market Analysis, Insights and Forecast - by Therapy
- 5.1.1. Chemotherapy
- 5.1.1.1. Anthracycline Drugs
- 5.1.1.2. Alkylating Agents
- 5.1.1.3. Anti-metabolites
- 5.1.1.4. Other Chemotherapies
- 5.1.2. Targeted Therapy
- 5.1.3. Stem Cell Transplant
- 5.1.4. Other Therapies
- 5.1.1. Chemotherapy
- 5.2. Market Analysis, Insights and Forecast - by Geography
- 5.2.1. China
- 5.2.2. Japan
- 5.2.3. India
- 5.2.4. Australia
- 5.2.5. South Korea
- 5.2.6. Rest of Asia-Pacific
- 5.3. Market Analysis, Insights and Forecast - by Region
- 5.3.1. China
- 5.3.2. Japan
- 5.3.3. India
- 5.3.4. Australia
- 5.3.5. South Korea
- 5.3.6. Rest of Asia Pacific
- 5.1. Market Analysis, Insights and Forecast - by Therapy
- 6. China AML Treatment Industry Analysis, Insights and Forecast, 2019-2031
- 6.1. Market Analysis, Insights and Forecast - by Therapy
- 6.1.1. Chemotherapy
- 6.1.1.1. Anthracycline Drugs
- 6.1.1.2. Alkylating Agents
- 6.1.1.3. Anti-metabolites
- 6.1.1.4. Other Chemotherapies
- 6.1.2. Targeted Therapy
- 6.1.3. Stem Cell Transplant
- 6.1.4. Other Therapies
- 6.1.1. Chemotherapy
- 6.2. Market Analysis, Insights and Forecast - by Geography
- 6.2.1. China
- 6.2.2. Japan
- 6.2.3. India
- 6.2.4. Australia
- 6.2.5. South Korea
- 6.2.6. Rest of Asia-Pacific
- 6.1. Market Analysis, Insights and Forecast - by Therapy
- 7. Japan AML Treatment Industry Analysis, Insights and Forecast, 2019-2031
- 7.1. Market Analysis, Insights and Forecast - by Therapy
- 7.1.1. Chemotherapy
- 7.1.1.1. Anthracycline Drugs
- 7.1.1.2. Alkylating Agents
- 7.1.1.3. Anti-metabolites
- 7.1.1.4. Other Chemotherapies
- 7.1.2. Targeted Therapy
- 7.1.3. Stem Cell Transplant
- 7.1.4. Other Therapies
- 7.1.1. Chemotherapy
- 7.2. Market Analysis, Insights and Forecast - by Geography
- 7.2.1. China
- 7.2.2. Japan
- 7.2.3. India
- 7.2.4. Australia
- 7.2.5. South Korea
- 7.2.6. Rest of Asia-Pacific
- 7.1. Market Analysis, Insights and Forecast - by Therapy
- 8. India AML Treatment Industry Analysis, Insights and Forecast, 2019-2031
- 8.1. Market Analysis, Insights and Forecast - by Therapy
- 8.1.1. Chemotherapy
- 8.1.1.1. Anthracycline Drugs
- 8.1.1.2. Alkylating Agents
- 8.1.1.3. Anti-metabolites
- 8.1.1.4. Other Chemotherapies
- 8.1.2. Targeted Therapy
- 8.1.3. Stem Cell Transplant
- 8.1.4. Other Therapies
- 8.1.1. Chemotherapy
- 8.2. Market Analysis, Insights and Forecast - by Geography
- 8.2.1. China
- 8.2.2. Japan
- 8.2.3. India
- 8.2.4. Australia
- 8.2.5. South Korea
- 8.2.6. Rest of Asia-Pacific
- 8.1. Market Analysis, Insights and Forecast - by Therapy
- 9. Australia AML Treatment Industry Analysis, Insights and Forecast, 2019-2031
- 9.1. Market Analysis, Insights and Forecast - by Therapy
- 9.1.1. Chemotherapy
- 9.1.1.1. Anthracycline Drugs
- 9.1.1.2. Alkylating Agents
- 9.1.1.3. Anti-metabolites
- 9.1.1.4. Other Chemotherapies
- 9.1.2. Targeted Therapy
- 9.1.3. Stem Cell Transplant
- 9.1.4. Other Therapies
- 9.1.1. Chemotherapy
- 9.2. Market Analysis, Insights and Forecast - by Geography
- 9.2.1. China
- 9.2.2. Japan
- 9.2.3. India
- 9.2.4. Australia
- 9.2.5. South Korea
- 9.2.6. Rest of Asia-Pacific
- 9.1. Market Analysis, Insights and Forecast - by Therapy
- 10. South Korea AML Treatment Industry Analysis, Insights and Forecast, 2019-2031
- 10.1. Market Analysis, Insights and Forecast - by Therapy
- 10.1.1. Chemotherapy
- 10.1.1.1. Anthracycline Drugs
- 10.1.1.2. Alkylating Agents
- 10.1.1.3. Anti-metabolites
- 10.1.1.4. Other Chemotherapies
- 10.1.2. Targeted Therapy
- 10.1.3. Stem Cell Transplant
- 10.1.4. Other Therapies
- 10.1.1. Chemotherapy
- 10.2. Market Analysis, Insights and Forecast - by Geography
- 10.2.1. China
- 10.2.2. Japan
- 10.2.3. India
- 10.2.4. Australia
- 10.2.5. South Korea
- 10.2.6. Rest of Asia-Pacific
- 10.1. Market Analysis, Insights and Forecast - by Therapy
- 11. Rest of Asia Pacific AML Treatment Industry Analysis, Insights and Forecast, 2019-2031
- 11.1. Market Analysis, Insights and Forecast - by Therapy
- 11.1.1. Chemotherapy
- 11.1.1.1. Anthracycline Drugs
- 11.1.1.2. Alkylating Agents
- 11.1.1.3. Anti-metabolites
- 11.1.1.4. Other Chemotherapies
- 11.1.2. Targeted Therapy
- 11.1.3. Stem Cell Transplant
- 11.1.4. Other Therapies
- 11.1.1. Chemotherapy
- 11.2. Market Analysis, Insights and Forecast - by Geography
- 11.2.1. China
- 11.2.2. Japan
- 11.2.3. India
- 11.2.4. Australia
- 11.2.5. South Korea
- 11.2.6. Rest of Asia-Pacific
- 11.1. Market Analysis, Insights and Forecast - by Therapy
- 12. North America AML Treatment Industry Analysis, Insights and Forecast, 2019-2031
- 12.1. Market Analysis, Insights and Forecast - By Country/Sub-region
- 12.1.1. undefined
- 13. Europe AML Treatment Industry Analysis, Insights and Forecast, 2019-2031
- 13.1. Market Analysis, Insights and Forecast - By Country/Sub-region
- 13.1.1. undefined
- 14. Asia Pacific AML Treatment Industry Analysis, Insights and Forecast, 2019-2031
- 14.1. Market Analysis, Insights and Forecast - By Country/Sub-region
- 14.1.1. undefined
- 15. South America AML Treatment Industry Analysis, Insights and Forecast, 2019-2031
- 15.1. Market Analysis, Insights and Forecast - By Country/Sub-region
- 15.1.1. undefined
- 16. North America AML Treatment Industry Analysis, Insights and Forecast, 2019-2031
- 16.1. Market Analysis, Insights and Forecast - By Country/Sub-region
- 16.1.1. undefined
- 17. MEA AML Treatment Industry Analysis, Insights and Forecast, 2019-2031
- 17.1. Market Analysis, Insights and Forecast - By Country/Sub-region
- 17.1.1. undefined
- 18. Competitive Analysis
- 18.1. Global Market Share Analysis 2024
- 18.2. Company Profiles
- 18.2.1 Daiichi Sankyo Company Limited
- 18.2.1.1. Overview
- 18.2.1.2. Products
- 18.2.1.3. SWOT Analysis
- 18.2.1.4. Recent Developments
- 18.2.1.5. Financials (Based on Availability)
- 18.2.2 Celgene Corporation
- 18.2.2.1. Overview
- 18.2.2.2. Products
- 18.2.2.3. SWOT Analysis
- 18.2.2.4. Recent Developments
- 18.2.2.5. Financials (Based on Availability)
- 18.2.3 Novartis AG
- 18.2.3.1. Overview
- 18.2.3.2. Products
- 18.2.3.3. SWOT Analysis
- 18.2.3.4. Recent Developments
- 18.2.3.5. Financials (Based on Availability)
- 18.2.4 Astellas Pharma Inc
- 18.2.4.1. Overview
- 18.2.4.2. Products
- 18.2.4.3. SWOT Analysis
- 18.2.4.4. Recent Developments
- 18.2.4.5. Financials (Based on Availability)
- 18.2.5 Teva Pharmaceutical Industries Ltd
- 18.2.5.1. Overview
- 18.2.5.2. Products
- 18.2.5.3. SWOT Analysis
- 18.2.5.4. Recent Developments
- 18.2.5.5. Financials (Based on Availability)
- 18.2.6 AbbVie Inc
- 18.2.6.1. Overview
- 18.2.6.2. Products
- 18.2.6.3. SWOT Analysis
- 18.2.6.4. Recent Developments
- 18.2.6.5. Financials (Based on Availability)
- 18.2.7 Sun Pharmaceutical Industries Ltd
- 18.2.7.1. Overview
- 18.2.7.2. Products
- 18.2.7.3. SWOT Analysis
- 18.2.7.4. Recent Developments
- 18.2.7.5. Financials (Based on Availability)
- 18.2.8 Fresenius SE & Co KGaA
- 18.2.8.1. Overview
- 18.2.8.2. Products
- 18.2.8.3. SWOT Analysis
- 18.2.8.4. Recent Developments
- 18.2.8.5. Financials (Based on Availability)
- 18.2.9 Viatris (Mylan NV)
- 18.2.9.1. Overview
- 18.2.9.2. Products
- 18.2.9.3. SWOT Analysis
- 18.2.9.4. Recent Developments
- 18.2.9.5. Financials (Based on Availability)
- 18.2.10 Pfizer Inc
- 18.2.10.1. Overview
- 18.2.10.2. Products
- 18.2.10.3. SWOT Analysis
- 18.2.10.4. Recent Developments
- 18.2.10.5. Financials (Based on Availability)
- 18.2.1 Daiichi Sankyo Company Limited
List of Figures
- Figure 1: Global AML Treatment Industry Revenue Breakdown (Million, %) by Region 2024 & 2032
- Figure 2: Global AML Treatment Industry Volume Breakdown (K Unit, %) by Region 2024 & 2032
- Figure 3: North America AML Treatment Industry Revenue (Million), by Country 2024 & 2032
- Figure 4: North America AML Treatment Industry Volume (K Unit), by Country 2024 & 2032
- Figure 5: North America AML Treatment Industry Revenue Share (%), by Country 2024 & 2032
- Figure 6: North America AML Treatment Industry Volume Share (%), by Country 2024 & 2032
- Figure 7: Europe AML Treatment Industry Revenue (Million), by Country 2024 & 2032
- Figure 8: Europe AML Treatment Industry Volume (K Unit), by Country 2024 & 2032
- Figure 9: Europe AML Treatment Industry Revenue Share (%), by Country 2024 & 2032
- Figure 10: Europe AML Treatment Industry Volume Share (%), by Country 2024 & 2032
- Figure 11: Asia Pacific AML Treatment Industry Revenue (Million), by Country 2024 & 2032
- Figure 12: Asia Pacific AML Treatment Industry Volume (K Unit), by Country 2024 & 2032
- Figure 13: Asia Pacific AML Treatment Industry Revenue Share (%), by Country 2024 & 2032
- Figure 14: Asia Pacific AML Treatment Industry Volume Share (%), by Country 2024 & 2032
- Figure 15: South America AML Treatment Industry Revenue (Million), by Country 2024 & 2032
- Figure 16: South America AML Treatment Industry Volume (K Unit), by Country 2024 & 2032
- Figure 17: South America AML Treatment Industry Revenue Share (%), by Country 2024 & 2032
- Figure 18: South America AML Treatment Industry Volume Share (%), by Country 2024 & 2032
- Figure 19: North America AML Treatment Industry Revenue (Million), by Country 2024 & 2032
- Figure 20: North America AML Treatment Industry Volume (K Unit), by Country 2024 & 2032
- Figure 21: North America AML Treatment Industry Revenue Share (%), by Country 2024 & 2032
- Figure 22: North America AML Treatment Industry Volume Share (%), by Country 2024 & 2032
- Figure 23: MEA AML Treatment Industry Revenue (Million), by Country 2024 & 2032
- Figure 24: MEA AML Treatment Industry Volume (K Unit), by Country 2024 & 2032
- Figure 25: MEA AML Treatment Industry Revenue Share (%), by Country 2024 & 2032
- Figure 26: MEA AML Treatment Industry Volume Share (%), by Country 2024 & 2032
- Figure 27: China AML Treatment Industry Revenue (Million), by Therapy 2024 & 2032
- Figure 28: China AML Treatment Industry Volume (K Unit), by Therapy 2024 & 2032
- Figure 29: China AML Treatment Industry Revenue Share (%), by Therapy 2024 & 2032
- Figure 30: China AML Treatment Industry Volume Share (%), by Therapy 2024 & 2032
- Figure 31: China AML Treatment Industry Revenue (Million), by Geography 2024 & 2032
- Figure 32: China AML Treatment Industry Volume (K Unit), by Geography 2024 & 2032
- Figure 33: China AML Treatment Industry Revenue Share (%), by Geography 2024 & 2032
- Figure 34: China AML Treatment Industry Volume Share (%), by Geography 2024 & 2032
- Figure 35: China AML Treatment Industry Revenue (Million), by Country 2024 & 2032
- Figure 36: China AML Treatment Industry Volume (K Unit), by Country 2024 & 2032
- Figure 37: China AML Treatment Industry Revenue Share (%), by Country 2024 & 2032
- Figure 38: China AML Treatment Industry Volume Share (%), by Country 2024 & 2032
- Figure 39: Japan AML Treatment Industry Revenue (Million), by Therapy 2024 & 2032
- Figure 40: Japan AML Treatment Industry Volume (K Unit), by Therapy 2024 & 2032
- Figure 41: Japan AML Treatment Industry Revenue Share (%), by Therapy 2024 & 2032
- Figure 42: Japan AML Treatment Industry Volume Share (%), by Therapy 2024 & 2032
- Figure 43: Japan AML Treatment Industry Revenue (Million), by Geography 2024 & 2032
- Figure 44: Japan AML Treatment Industry Volume (K Unit), by Geography 2024 & 2032
- Figure 45: Japan AML Treatment Industry Revenue Share (%), by Geography 2024 & 2032
- Figure 46: Japan AML Treatment Industry Volume Share (%), by Geography 2024 & 2032
- Figure 47: Japan AML Treatment Industry Revenue (Million), by Country 2024 & 2032
- Figure 48: Japan AML Treatment Industry Volume (K Unit), by Country 2024 & 2032
- Figure 49: Japan AML Treatment Industry Revenue Share (%), by Country 2024 & 2032
- Figure 50: Japan AML Treatment Industry Volume Share (%), by Country 2024 & 2032
- Figure 51: India AML Treatment Industry Revenue (Million), by Therapy 2024 & 2032
- Figure 52: India AML Treatment Industry Volume (K Unit), by Therapy 2024 & 2032
- Figure 53: India AML Treatment Industry Revenue Share (%), by Therapy 2024 & 2032
- Figure 54: India AML Treatment Industry Volume Share (%), by Therapy 2024 & 2032
- Figure 55: India AML Treatment Industry Revenue (Million), by Geography 2024 & 2032
- Figure 56: India AML Treatment Industry Volume (K Unit), by Geography 2024 & 2032
- Figure 57: India AML Treatment Industry Revenue Share (%), by Geography 2024 & 2032
- Figure 58: India AML Treatment Industry Volume Share (%), by Geography 2024 & 2032
- Figure 59: India AML Treatment Industry Revenue (Million), by Country 2024 & 2032
- Figure 60: India AML Treatment Industry Volume (K Unit), by Country 2024 & 2032
- Figure 61: India AML Treatment Industry Revenue Share (%), by Country 2024 & 2032
- Figure 62: India AML Treatment Industry Volume Share (%), by Country 2024 & 2032
- Figure 63: Australia AML Treatment Industry Revenue (Million), by Therapy 2024 & 2032
- Figure 64: Australia AML Treatment Industry Volume (K Unit), by Therapy 2024 & 2032
- Figure 65: Australia AML Treatment Industry Revenue Share (%), by Therapy 2024 & 2032
- Figure 66: Australia AML Treatment Industry Volume Share (%), by Therapy 2024 & 2032
- Figure 67: Australia AML Treatment Industry Revenue (Million), by Geography 2024 & 2032
- Figure 68: Australia AML Treatment Industry Volume (K Unit), by Geography 2024 & 2032
- Figure 69: Australia AML Treatment Industry Revenue Share (%), by Geography 2024 & 2032
- Figure 70: Australia AML Treatment Industry Volume Share (%), by Geography 2024 & 2032
- Figure 71: Australia AML Treatment Industry Revenue (Million), by Country 2024 & 2032
- Figure 72: Australia AML Treatment Industry Volume (K Unit), by Country 2024 & 2032
- Figure 73: Australia AML Treatment Industry Revenue Share (%), by Country 2024 & 2032
- Figure 74: Australia AML Treatment Industry Volume Share (%), by Country 2024 & 2032
- Figure 75: South Korea AML Treatment Industry Revenue (Million), by Therapy 2024 & 2032
- Figure 76: South Korea AML Treatment Industry Volume (K Unit), by Therapy 2024 & 2032
- Figure 77: South Korea AML Treatment Industry Revenue Share (%), by Therapy 2024 & 2032
- Figure 78: South Korea AML Treatment Industry Volume Share (%), by Therapy 2024 & 2032
- Figure 79: South Korea AML Treatment Industry Revenue (Million), by Geography 2024 & 2032
- Figure 80: South Korea AML Treatment Industry Volume (K Unit), by Geography 2024 & 2032
- Figure 81: South Korea AML Treatment Industry Revenue Share (%), by Geography 2024 & 2032
- Figure 82: South Korea AML Treatment Industry Volume Share (%), by Geography 2024 & 2032
- Figure 83: South Korea AML Treatment Industry Revenue (Million), by Country 2024 & 2032
- Figure 84: South Korea AML Treatment Industry Volume (K Unit), by Country 2024 & 2032
- Figure 85: South Korea AML Treatment Industry Revenue Share (%), by Country 2024 & 2032
- Figure 86: South Korea AML Treatment Industry Volume Share (%), by Country 2024 & 2032
- Figure 87: Rest of Asia Pacific AML Treatment Industry Revenue (Million), by Therapy 2024 & 2032
- Figure 88: Rest of Asia Pacific AML Treatment Industry Volume (K Unit), by Therapy 2024 & 2032
- Figure 89: Rest of Asia Pacific AML Treatment Industry Revenue Share (%), by Therapy 2024 & 2032
- Figure 90: Rest of Asia Pacific AML Treatment Industry Volume Share (%), by Therapy 2024 & 2032
- Figure 91: Rest of Asia Pacific AML Treatment Industry Revenue (Million), by Geography 2024 & 2032
- Figure 92: Rest of Asia Pacific AML Treatment Industry Volume (K Unit), by Geography 2024 & 2032
- Figure 93: Rest of Asia Pacific AML Treatment Industry Revenue Share (%), by Geography 2024 & 2032
- Figure 94: Rest of Asia Pacific AML Treatment Industry Volume Share (%), by Geography 2024 & 2032
- Figure 95: Rest of Asia Pacific AML Treatment Industry Revenue (Million), by Country 2024 & 2032
- Figure 96: Rest of Asia Pacific AML Treatment Industry Volume (K Unit), by Country 2024 & 2032
- Figure 97: Rest of Asia Pacific AML Treatment Industry Revenue Share (%), by Country 2024 & 2032
- Figure 98: Rest of Asia Pacific AML Treatment Industry Volume Share (%), by Country 2024 & 2032
List of Tables
- Table 1: Global AML Treatment Industry Revenue Million Forecast, by Region 2019 & 2032
- Table 2: Global AML Treatment Industry Volume K Unit Forecast, by Region 2019 & 2032
- Table 3: Global AML Treatment Industry Revenue Million Forecast, by Therapy 2019 & 2032
- Table 4: Global AML Treatment Industry Volume K Unit Forecast, by Therapy 2019 & 2032
- Table 5: Global AML Treatment Industry Revenue Million Forecast, by Geography 2019 & 2032
- Table 6: Global AML Treatment Industry Volume K Unit Forecast, by Geography 2019 & 2032
- Table 7: Global AML Treatment Industry Revenue Million Forecast, by Region 2019 & 2032
- Table 8: Global AML Treatment Industry Volume K Unit Forecast, by Region 2019 & 2032
- Table 9: Global AML Treatment Industry Revenue Million Forecast, by Country 2019 & 2032
- Table 10: Global AML Treatment Industry Volume K Unit Forecast, by Country 2019 & 2032
- Table 11: Global AML Treatment Industry Revenue Million Forecast, by Country 2019 & 2032
- Table 12: Global AML Treatment Industry Volume K Unit Forecast, by Country 2019 & 2032
- Table 13: Global AML Treatment Industry Revenue Million Forecast, by Country 2019 & 2032
- Table 14: Global AML Treatment Industry Volume K Unit Forecast, by Country 2019 & 2032
- Table 15: Global AML Treatment Industry Revenue Million Forecast, by Country 2019 & 2032
- Table 16: Global AML Treatment Industry Volume K Unit Forecast, by Country 2019 & 2032
- Table 17: Global AML Treatment Industry Revenue Million Forecast, by Country 2019 & 2032
- Table 18: Global AML Treatment Industry Volume K Unit Forecast, by Country 2019 & 2032
- Table 19: Global AML Treatment Industry Revenue Million Forecast, by Country 2019 & 2032
- Table 20: Global AML Treatment Industry Volume K Unit Forecast, by Country 2019 & 2032
- Table 21: Global AML Treatment Industry Revenue Million Forecast, by Therapy 2019 & 2032
- Table 22: Global AML Treatment Industry Volume K Unit Forecast, by Therapy 2019 & 2032
- Table 23: Global AML Treatment Industry Revenue Million Forecast, by Geography 2019 & 2032
- Table 24: Global AML Treatment Industry Volume K Unit Forecast, by Geography 2019 & 2032
- Table 25: Global AML Treatment Industry Revenue Million Forecast, by Country 2019 & 2032
- Table 26: Global AML Treatment Industry Volume K Unit Forecast, by Country 2019 & 2032
- Table 27: Global AML Treatment Industry Revenue Million Forecast, by Therapy 2019 & 2032
- Table 28: Global AML Treatment Industry Volume K Unit Forecast, by Therapy 2019 & 2032
- Table 29: Global AML Treatment Industry Revenue Million Forecast, by Geography 2019 & 2032
- Table 30: Global AML Treatment Industry Volume K Unit Forecast, by Geography 2019 & 2032
- Table 31: Global AML Treatment Industry Revenue Million Forecast, by Country 2019 & 2032
- Table 32: Global AML Treatment Industry Volume K Unit Forecast, by Country 2019 & 2032
- Table 33: Global AML Treatment Industry Revenue Million Forecast, by Therapy 2019 & 2032
- Table 34: Global AML Treatment Industry Volume K Unit Forecast, by Therapy 2019 & 2032
- Table 35: Global AML Treatment Industry Revenue Million Forecast, by Geography 2019 & 2032
- Table 36: Global AML Treatment Industry Volume K Unit Forecast, by Geography 2019 & 2032
- Table 37: Global AML Treatment Industry Revenue Million Forecast, by Country 2019 & 2032
- Table 38: Global AML Treatment Industry Volume K Unit Forecast, by Country 2019 & 2032
- Table 39: Global AML Treatment Industry Revenue Million Forecast, by Therapy 2019 & 2032
- Table 40: Global AML Treatment Industry Volume K Unit Forecast, by Therapy 2019 & 2032
- Table 41: Global AML Treatment Industry Revenue Million Forecast, by Geography 2019 & 2032
- Table 42: Global AML Treatment Industry Volume K Unit Forecast, by Geography 2019 & 2032
- Table 43: Global AML Treatment Industry Revenue Million Forecast, by Country 2019 & 2032
- Table 44: Global AML Treatment Industry Volume K Unit Forecast, by Country 2019 & 2032
- Table 45: Global AML Treatment Industry Revenue Million Forecast, by Therapy 2019 & 2032
- Table 46: Global AML Treatment Industry Volume K Unit Forecast, by Therapy 2019 & 2032
- Table 47: Global AML Treatment Industry Revenue Million Forecast, by Geography 2019 & 2032
- Table 48: Global AML Treatment Industry Volume K Unit Forecast, by Geography 2019 & 2032
- Table 49: Global AML Treatment Industry Revenue Million Forecast, by Country 2019 & 2032
- Table 50: Global AML Treatment Industry Volume K Unit Forecast, by Country 2019 & 2032
- Table 51: Global AML Treatment Industry Revenue Million Forecast, by Therapy 2019 & 2032
- Table 52: Global AML Treatment Industry Volume K Unit Forecast, by Therapy 2019 & 2032
- Table 53: Global AML Treatment Industry Revenue Million Forecast, by Geography 2019 & 2032
- Table 54: Global AML Treatment Industry Volume K Unit Forecast, by Geography 2019 & 2032
- Table 55: Global AML Treatment Industry Revenue Million Forecast, by Country 2019 & 2032
- Table 56: Global AML Treatment Industry Volume K Unit Forecast, by Country 2019 & 2032
Frequently Asked Questions
1. What is the projected Compound Annual Growth Rate (CAGR) of the AML Treatment Industry?
The projected CAGR is approximately 6.46%.
2. Which companies are prominent players in the AML Treatment Industry?
Key companies in the market include Daiichi Sankyo Company Limited, Celgene Corporation, Novartis AG, Astellas Pharma Inc, Teva Pharmaceutical Industries Ltd, AbbVie Inc, Sun Pharmaceutical Industries Ltd, Fresenius SE & Co KGaA, Viatris (Mylan NV), Pfizer Inc.
3. What are the main segments of the AML Treatment Industry?
The market segments include Therapy, Geography.
4. Can you provide details about the market size?
The market size is estimated to be USD 338.96 Million as of 2022.
5. What are some drivers contributing to market growth?
High Incidence and Prevalence of Acute Myeloid Leukemia; Advancement in Pharmacology and Molecular Biology to Promote Drug Development.
6. What are the notable trends driving market growth?
The Chemotherapy Segment is Anticipated to Witness a Growth Over the Forecast Period.
7. Are there any restraints impacting market growth?
Complications Related to Chemotherapy.
8. Can you provide examples of recent developments in the market?
May 2024 : Nippon Shinyaku Co., Ltd. introduced Vyxeos Combination, an I.V. injection (comprising Daunorubicin hydrochloride and cytarabine in a liposomal formulation), specifically targeting high-risk acute myeloid leukemia (AML) patients in Japan.
9. What pricing options are available for accessing the report?
Pricing options include single-user, multi-user, and enterprise licenses priced at USD 4750, USD 5250, and USD 8750 respectively.
10. Is the market size provided in terms of value or volume?
The market size is provided in terms of value, measured in Million and volume, measured in K Unit.
11. Are there any specific market keywords associated with the report?
Yes, the market keyword associated with the report is "AML Treatment Industry," which aids in identifying and referencing the specific market segment covered.
12. How do I determine which pricing option suits my needs best?
The pricing options vary based on user requirements and access needs. Individual users may opt for single-user licenses, while businesses requiring broader access may choose multi-user or enterprise licenses for cost-effective access to the report.
13. Are there any additional resources or data provided in the AML Treatment Industry report?
While the report offers comprehensive insights, it's advisable to review the specific contents or supplementary materials provided to ascertain if additional resources or data are available.
14. How can I stay updated on further developments or reports in the AML Treatment Industry?
To stay informed about further developments, trends, and reports in the AML Treatment Industry, consider subscribing to industry newsletters, following relevant companies and organizations, or regularly checking reputable industry news sources and publications.
Methodology
Step 1 - Identification of Relevant Samples Size from Population Database


Step 2 - Approaches for Defining Global Market Size (Value, Volume* & Price*)

Note*: In applicable scenarios
Step 3 - Data Sources
Primary Research
- Web Analytics
- Survey Reports
- Research Institute
- Latest Research Reports
- Opinion Leaders
Secondary Research
- Annual Reports
- White Paper
- Latest Press Release
- Industry Association
- Paid Database
- Investor Presentations

Step 4 - Data Triangulation
Involves using different sources of information in order to increase the validity of a study
These sources are likely to be stakeholders in a program - participants, other researchers, program staff, other community members, and so on.
Then we put all data in single framework & apply various statistical tools to find out the dynamic on the market.
During the analysis stage, feedback from the stakeholder groups would be compared to determine areas of agreement as well as areas of divergence


