
Key Insights
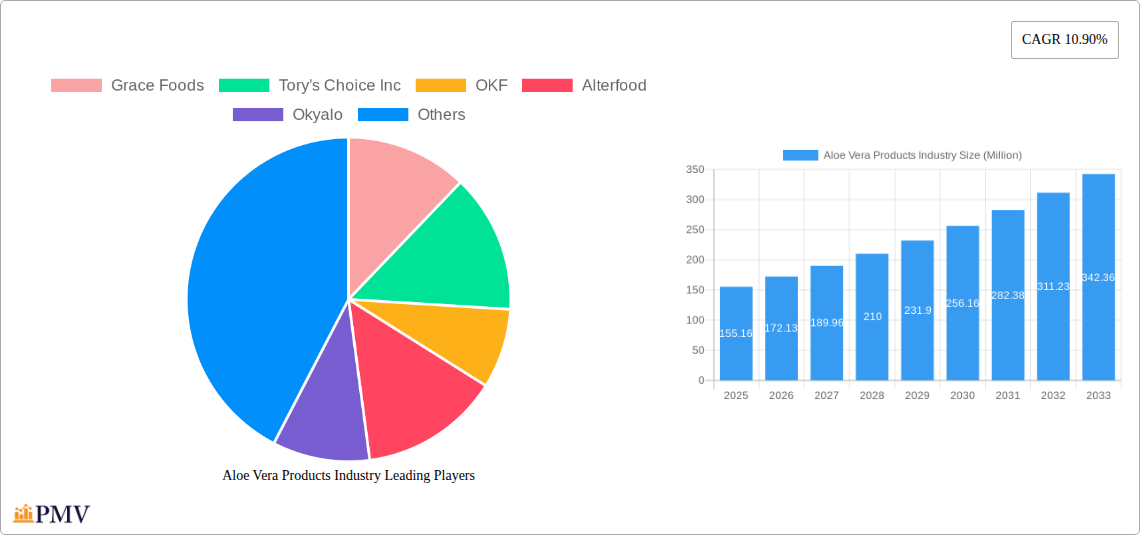
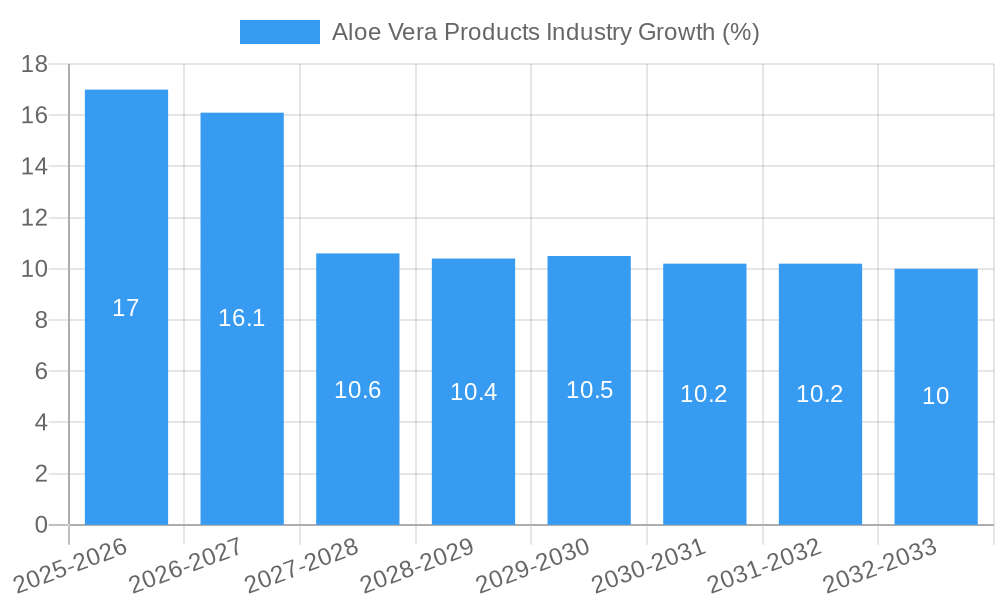
The global aloe vera products market, valued at $155.16 million in 2025, is projected to experience robust growth, exhibiting a Compound Annual Growth Rate (CAGR) of 10.90% from 2025 to 2033. This expansion is fueled by several key factors. Increasing consumer awareness of aloe vera's health benefits, particularly its soothing and healing properties for skin and digestive issues, is a primary driver. The rising popularity of natural and organic products, coupled with a growing preference for functional beverages, further propels market growth. The diverse product portfolio, encompassing hot and bottled drinks, juice concentrates, and aloe vera water, caters to a broad consumer base, expanding market penetration. Distribution channels are also diversifying, with online retail stores witnessing significant growth alongside traditional supermarkets and convenience stores, enhancing accessibility for consumers. While challenges like potential price fluctuations in raw materials and maintaining consistent product quality exist, the overall market outlook remains positive, driven by strong consumer demand and product innovation.
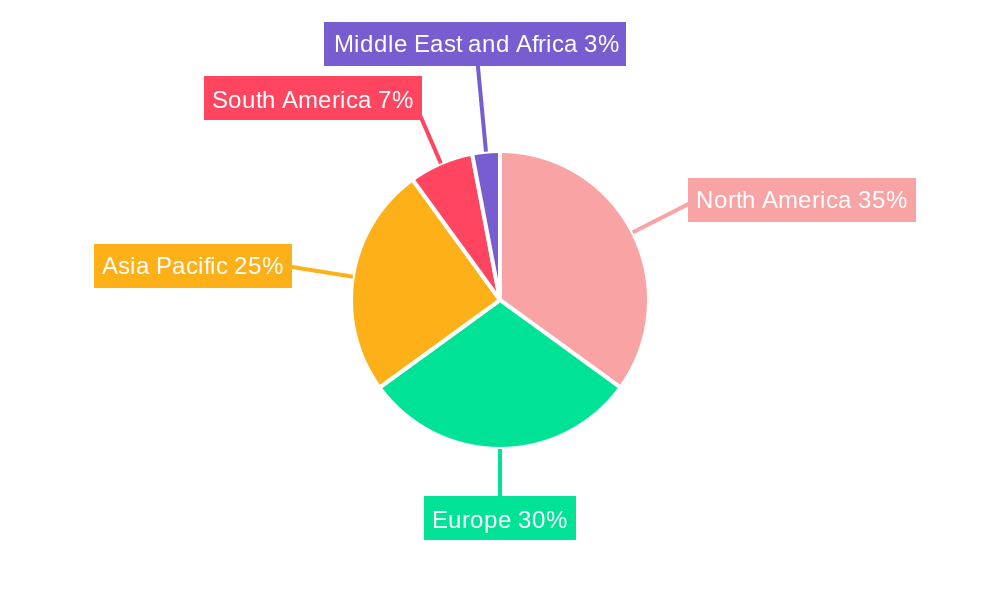
The market segmentation reveals valuable insights into consumer preferences. Bottled drinks and juice concentrates likely constitute the largest segments, benefiting from their convenience and versatility. The North American and European markets currently hold significant shares, reflecting high consumer awareness and purchasing power in these regions. However, the Asia-Pacific region presents a promising growth opportunity due to its expanding middle class and increasing health consciousness. Strategic partnerships with retailers, product diversification to include novel aloe vera-infused products, and focused marketing campaigns targeting specific health-conscious demographics will be crucial for companies seeking success in this burgeoning market. Further research into the efficacy of aloe vera in various applications and the development of sustainable sourcing practices will also play a critical role in shaping the long-term trajectory of this market.
Aloe Vera Products Industry: A Comprehensive Market Report (2019-2033)
This in-depth report provides a comprehensive analysis of the global Aloe Vera Products industry, offering valuable insights for businesses, investors, and stakeholders seeking to understand this dynamic market. With a study period spanning 2019-2033, a base year of 2025, and a forecast period of 2025-2033, this report delivers actionable intelligence on market size, segmentation, growth drivers, challenges, and key players. The estimated market size in 2025 is projected at xx Million.
Aloe Vera Products Industry Market Structure & Competitive Dynamics
The global aloe vera products market exhibits a moderately fragmented structure, with several key players vying for market share. Market concentration is relatively low, allowing for both established players and emerging brands to compete. The industry's innovation ecosystem is dynamic, with ongoing research and development focused on enhancing product quality, expanding product offerings (such as aloe vera water, juice concentrates and bottled drinks), and improving processing techniques. Regulatory frameworks vary across regions, impacting product labeling, ingredient sourcing, and overall production costs. The primary product substitutes include other functional beverages and health supplements. End-user trends highlight a growing preference for natural, organic, and health-conscious products, driving demand for aloe vera-based solutions. M&A activity in the sector has been relatively moderate in recent years, with deal values ranging from xx Million to xx Million. Key metrics like market share are analyzed for major players including Grace Foods, Tory's Choice Inc, OKF, Alterfood, Okyalo, Houssy Global, Veganic, Forever Living Products, and Simplee Aloe. Further analysis examines the impact of these factors on market dynamics and future projections.
- Market Concentration: Low to moderate
- Innovation: Ongoing R&D in product quality and processing
- Regulatory Landscape: Varies regionally, affecting production costs
- Product Substitutes: Functional beverages, health supplements
- M&A Activity: Moderate, with deal values ranging from xx Million to xx Million.
Aloe Vera Products Industry Industry Trends & Insights
The aloe vera products market is experiencing robust growth, driven by increasing consumer awareness of its health benefits and versatility. The market is witnessing a significant shift towards organic and natural products, impacting consumer preferences. Technological advancements in processing and packaging are improving product shelf life and overall quality. The competitive landscape remains dynamic, with both established players and new entrants introducing innovative products and expanding distribution channels. This market is experiencing a compound annual growth rate (CAGR) of xx% during the forecast period (2025-2033), with market penetration steadily increasing across various segments. Further detailed analysis of these trends reveals growth potential within specific regions and product categories. The global aloe vera products market is predicted to reach xx Million by 2033.
Dominant Markets & Segments in Aloe Vera Products Industry
The Asia-Pacific region currently dominates the global aloe vera products market, fueled by strong demand from countries like China and India. Within product types, bottled drinks hold the largest market share, followed closely by aloe vera water. Supermarkets/hypermarkets represent the leading distribution channel due to wide reach and consumer convenience.
Key Drivers:
- Asia-Pacific: High population density, rising disposable incomes, and increased health awareness.
- Bottled Drinks: Convenience, wide availability, and established consumer preference.
- Supermarkets/Hypermarkets: Extensive reach, established infrastructure, and consumer preference for convenient shopping.
Dominance Analysis: The dominance of the Asia-Pacific region and bottled drinks is largely attributed to factors such as increasing health consciousness, rising disposable incomes, and the preference for convenient, ready-to-consume beverages. Similarly, the significant role of supermarkets/hypermarkets in distribution reflects consumer preference for established retail channels and ease of accessibility.
Aloe Vera Products Industry Product Innovations
Recent product innovations in the aloe vera industry focus on enhancing flavor profiles, incorporating functional ingredients, and improving packaging for extended shelf life. Technological advancements in extraction methods and processing techniques are improving the overall quality and consistency of aloe vera products. These innovations are enhancing market fit by catering to evolving consumer preferences for natural, healthy, and convenient options. Emphasis is also placed on organic and sustainably-sourced aloe vera, enhancing the products' appeal to environmentally conscious consumers.
Report Segmentation & Scope
The report segments the aloe vera products market by product type (hot drinks, bottled drinks, juice concentrates, aloe vera water) and distribution channel (supermarkets/hypermarkets, convenience/grocery stores, specialty stores, online retail stores, other distribution channels). Each segment's growth projections, market size, and competitive dynamics are thoroughly analyzed. Growth projections vary significantly across segments based on factors such as evolving consumer preferences and regional market conditions. Competitive dynamics within each segment are shaped by brand positioning, pricing strategies, and distribution networks.
Key Drivers of Aloe Vera Products Industry Growth
Several factors contribute to the growth of the aloe vera products industry. Increasing consumer awareness of aloe vera’s health benefits (skin, digestive health, etc.) is a major driver. The rising demand for natural and organic products further fuels market expansion. Technological advancements in cultivation, extraction, and processing methods are enhancing product quality and efficiency, contributing to overall growth. Favorable government regulations and policies supporting the health and wellness sector also support market expansion.
Challenges in the Aloe Vera Products Industry Sector
The aloe vera products industry faces challenges including the fluctuating prices of raw materials and concerns over the sustainability of aloe vera farming practices. Maintaining product quality and consistency across diverse production settings also presents a challenge. Strict regulatory requirements and stringent quality control standards create additional pressures for businesses in this sector. These factors combined impact market growth and profitability.
Leading Players in the Aloe Vera Products Industry Market
- Grace Foods
- Tory's Choice Inc
- OKF
- Alterfood
- Okyalo
- Houssy Global
- Veganic
- Forever Living Products
- Simplee Aloe
Key Developments in Aloe Vera Products Industry Sector
- September 2022: 1NE Beverages launched aloe vera juices in India, highlighting health benefits.
- October 2021: Sappe launched new aloe vera drinks in Thailand with unique flavor profiles.
- April 2021: Veganic launched 100% organic aloe vera fruit juices in the United States.
Strategic Aloe Vera Products Industry Market Outlook
The aloe vera products market presents significant growth potential driven by continued consumer demand for health and wellness products. Strategic opportunities lie in product diversification, focusing on premium and specialized aloe vera products, and expanding distribution networks into emerging markets. Investing in sustainable and ethical sourcing practices will also be crucial for long-term success. The market's positive outlook is supported by consistent growth projections and evolving consumer preferences towards natural and health-conscious options.
Aloe Vera Products Industry Segmentation
-
1. Product Type
- 1.1. Hot drinks
- 1.2. Bottled drinks
- 1.3. Juice Concentrates
- 1.4. Aloe Vera water
-
2. Distribution Channel
- 2.1. Supermarkets/Hypermarkets
- 2.2. Convenience/Grocery Stores
- 2.3. Specialty Stores
- 2.4. Online Retail Stores
- 2.5. Other Distribution Channels
Aloe Vera Products Industry Segmentation By Geography
-
1. North America
- 1.1. United States
- 1.2. Canada
- 1.3. Mexico
- 1.4. Rest of North America
-
2. Europe
- 2.1. Spain
- 2.2. United Kingdom
- 2.3. Germany
- 2.4. France
- 2.5. Italy
- 2.6. Russia
- 2.7. Rest of Europe
-
3. Asia Pacific
- 3.1. China
- 3.2. Japan
- 3.3. India
- 3.4. Australia
- 3.5. Rest of Asia Pacific
-
4. South America
- 4.1. Brazil
- 4.2. Argentina
- 4.3. Rest of South America
-
5. Middle East and Africa
- 5.1. South Africa
- 5.2. Saudi Arabia
- 5.3. Rest of Middle East and Africa
Aloe Vera Products Industry REPORT HIGHLIGHTS
| Aspects | Details |
|---|---|
| Study Period | 2019-2033 |
| Base Year | 2024 |
| Estimated Year | 2025 |
| Forecast Period | 2025-2033 |
| Historical Period | 2019-2024 |
| Growth Rate | CAGR of 10.90% from 2019-2033 |
| Segmentation |
|
Table of Contents
- 1. Introduction
- 1.1. Research Scope
- 1.2. Market Segmentation
- 1.3. Research Methodology
- 1.4. Definitions and Assumptions
- 2. Executive Summary
- 2.1. Introduction
- 3. Market Dynamics
- 3.1. Introduction
- 3.2. Market Drivers
- 3.2.1. Increasing Consumer Awareness Regarding Natural Products; Growing Demand for Anthocyanin in Pharmaceutical Industry
- 3.3. Market Restrains
- 3.3.1. Easy Availability of Synthetic Food Colorant
- 3.4. Market Trends
- 3.4.1. Aloe Vera based Juices to Witness Higher Growth
- 4. Market Factor Analysis
- 4.1. Porters Five Forces
- 4.2. Supply/Value Chain
- 4.3. PESTEL analysis
- 4.4. Market Entropy
- 4.5. Patent/Trademark Analysis
- 5. Global Aloe Vera Products Industry Analysis, Insights and Forecast, 2019-2031
- 5.1. Market Analysis, Insights and Forecast - by Product Type
- 5.1.1. Hot drinks
- 5.1.2. Bottled drinks
- 5.1.3. Juice Concentrates
- 5.1.4. Aloe Vera water
- 5.2. Market Analysis, Insights and Forecast - by Distribution Channel
- 5.2.1. Supermarkets/Hypermarkets
- 5.2.2. Convenience/Grocery Stores
- 5.2.3. Specialty Stores
- 5.2.4. Online Retail Stores
- 5.2.5. Other Distribution Channels
- 5.3. Market Analysis, Insights and Forecast - by Region
- 5.3.1. North America
- 5.3.2. Europe
- 5.3.3. Asia Pacific
- 5.3.4. South America
- 5.3.5. Middle East and Africa
- 5.1. Market Analysis, Insights and Forecast - by Product Type
- 6. North America Aloe Vera Products Industry Analysis, Insights and Forecast, 2019-2031
- 6.1. Market Analysis, Insights and Forecast - by Product Type
- 6.1.1. Hot drinks
- 6.1.2. Bottled drinks
- 6.1.3. Juice Concentrates
- 6.1.4. Aloe Vera water
- 6.2. Market Analysis, Insights and Forecast - by Distribution Channel
- 6.2.1. Supermarkets/Hypermarkets
- 6.2.2. Convenience/Grocery Stores
- 6.2.3. Specialty Stores
- 6.2.4. Online Retail Stores
- 6.2.5. Other Distribution Channels
- 6.1. Market Analysis, Insights and Forecast - by Product Type
- 7. Europe Aloe Vera Products Industry Analysis, Insights and Forecast, 2019-2031
- 7.1. Market Analysis, Insights and Forecast - by Product Type
- 7.1.1. Hot drinks
- 7.1.2. Bottled drinks
- 7.1.3. Juice Concentrates
- 7.1.4. Aloe Vera water
- 7.2. Market Analysis, Insights and Forecast - by Distribution Channel
- 7.2.1. Supermarkets/Hypermarkets
- 7.2.2. Convenience/Grocery Stores
- 7.2.3. Specialty Stores
- 7.2.4. Online Retail Stores
- 7.2.5. Other Distribution Channels
- 7.1. Market Analysis, Insights and Forecast - by Product Type
- 8. Asia Pacific Aloe Vera Products Industry Analysis, Insights and Forecast, 2019-2031
- 8.1. Market Analysis, Insights and Forecast - by Product Type
- 8.1.1. Hot drinks
- 8.1.2. Bottled drinks
- 8.1.3. Juice Concentrates
- 8.1.4. Aloe Vera water
- 8.2. Market Analysis, Insights and Forecast - by Distribution Channel
- 8.2.1. Supermarkets/Hypermarkets
- 8.2.2. Convenience/Grocery Stores
- 8.2.3. Specialty Stores
- 8.2.4. Online Retail Stores
- 8.2.5. Other Distribution Channels
- 8.1. Market Analysis, Insights and Forecast - by Product Type
- 9. South America Aloe Vera Products Industry Analysis, Insights and Forecast, 2019-2031
- 9.1. Market Analysis, Insights and Forecast - by Product Type
- 9.1.1. Hot drinks
- 9.1.2. Bottled drinks
- 9.1.3. Juice Concentrates
- 9.1.4. Aloe Vera water
- 9.2. Market Analysis, Insights and Forecast - by Distribution Channel
- 9.2.1. Supermarkets/Hypermarkets
- 9.2.2. Convenience/Grocery Stores
- 9.2.3. Specialty Stores
- 9.2.4. Online Retail Stores
- 9.2.5. Other Distribution Channels
- 9.1. Market Analysis, Insights and Forecast - by Product Type
- 10. Middle East and Africa Aloe Vera Products Industry Analysis, Insights and Forecast, 2019-2031
- 10.1. Market Analysis, Insights and Forecast - by Product Type
- 10.1.1. Hot drinks
- 10.1.2. Bottled drinks
- 10.1.3. Juice Concentrates
- 10.1.4. Aloe Vera water
- 10.2. Market Analysis, Insights and Forecast - by Distribution Channel
- 10.2.1. Supermarkets/Hypermarkets
- 10.2.2. Convenience/Grocery Stores
- 10.2.3. Specialty Stores
- 10.2.4. Online Retail Stores
- 10.2.5. Other Distribution Channels
- 10.1. Market Analysis, Insights and Forecast - by Product Type
- 11. North America Aloe Vera Products Industry Analysis, Insights and Forecast, 2019-2031
- 11.1. Market Analysis, Insights and Forecast - By Country/Sub-region
- 11.1.1 United States
- 11.1.2 Canada
- 11.1.3 Mexico
- 11.1.4 Rest of North America
- 12. Europe Aloe Vera Products Industry Analysis, Insights and Forecast, 2019-2031
- 12.1. Market Analysis, Insights and Forecast - By Country/Sub-region
- 12.1.1 Spain
- 12.1.2 United Kingdom
- 12.1.3 Germany
- 12.1.4 France
- 12.1.5 Italy
- 12.1.6 Russia
- 12.1.7 Rest of Europe
- 13. Asia Pacific Aloe Vera Products Industry Analysis, Insights and Forecast, 2019-2031
- 13.1. Market Analysis, Insights and Forecast - By Country/Sub-region
- 13.1.1 China
- 13.1.2 Japan
- 13.1.3 India
- 13.1.4 Australia
- 13.1.5 Rest of Asia Pacific
- 14. South America Aloe Vera Products Industry Analysis, Insights and Forecast, 2019-2031
- 14.1. Market Analysis, Insights and Forecast - By Country/Sub-region
- 14.1.1 Brazil
- 14.1.2 Argentina
- 14.1.3 Rest of South America
- 15. Middle East and Africa Aloe Vera Products Industry Analysis, Insights and Forecast, 2019-2031
- 15.1. Market Analysis, Insights and Forecast - By Country/Sub-region
- 15.1.1 South Africa
- 15.1.2 Saudi Arabia
- 15.1.3 Rest of Middle East and Africa
- 16. Competitive Analysis
- 16.1. Global Market Share Analysis 2024
- 16.2. Company Profiles
- 16.2.1 Grace Foods
- 16.2.1.1. Overview
- 16.2.1.2. Products
- 16.2.1.3. SWOT Analysis
- 16.2.1.4. Recent Developments
- 16.2.1.5. Financials (Based on Availability)
- 16.2.2 Tory's Choice Inc
- 16.2.2.1. Overview
- 16.2.2.2. Products
- 16.2.2.3. SWOT Analysis
- 16.2.2.4. Recent Developments
- 16.2.2.5. Financials (Based on Availability)
- 16.2.3 OKF
- 16.2.3.1. Overview
- 16.2.3.2. Products
- 16.2.3.3. SWOT Analysis
- 16.2.3.4. Recent Developments
- 16.2.3.5. Financials (Based on Availability)
- 16.2.4 Alterfood
- 16.2.4.1. Overview
- 16.2.4.2. Products
- 16.2.4.3. SWOT Analysis
- 16.2.4.4. Recent Developments
- 16.2.4.5. Financials (Based on Availability)
- 16.2.5 Okyalo
- 16.2.5.1. Overview
- 16.2.5.2. Products
- 16.2.5.3. SWOT Analysis
- 16.2.5.4. Recent Developments
- 16.2.5.5. Financials (Based on Availability)
- 16.2.6 Houssy Global
- 16.2.6.1. Overview
- 16.2.6.2. Products
- 16.2.6.3. SWOT Analysis
- 16.2.6.4. Recent Developments
- 16.2.6.5. Financials (Based on Availability)
- 16.2.7 Veganic*List Not Exhaustive
- 16.2.7.1. Overview
- 16.2.7.2. Products
- 16.2.7.3. SWOT Analysis
- 16.2.7.4. Recent Developments
- 16.2.7.5. Financials (Based on Availability)
- 16.2.8 Forever Living Products
- 16.2.8.1. Overview
- 16.2.8.2. Products
- 16.2.8.3. SWOT Analysis
- 16.2.8.4. Recent Developments
- 16.2.8.5. Financials (Based on Availability)
- 16.2.9 Simplee Aloe
- 16.2.9.1. Overview
- 16.2.9.2. Products
- 16.2.9.3. SWOT Analysis
- 16.2.9.4. Recent Developments
- 16.2.9.5. Financials (Based on Availability)
- 16.2.1 Grace Foods
List of Figures
- Figure 1: Global Aloe Vera Products Industry Revenue Breakdown (Million, %) by Region 2024 & 2032
- Figure 2: North America Aloe Vera Products Industry Revenue (Million), by Country 2024 & 2032
- Figure 3: North America Aloe Vera Products Industry Revenue Share (%), by Country 2024 & 2032
- Figure 4: Europe Aloe Vera Products Industry Revenue (Million), by Country 2024 & 2032
- Figure 5: Europe Aloe Vera Products Industry Revenue Share (%), by Country 2024 & 2032
- Figure 6: Asia Pacific Aloe Vera Products Industry Revenue (Million), by Country 2024 & 2032
- Figure 7: Asia Pacific Aloe Vera Products Industry Revenue Share (%), by Country 2024 & 2032
- Figure 8: South America Aloe Vera Products Industry Revenue (Million), by Country 2024 & 2032
- Figure 9: South America Aloe Vera Products Industry Revenue Share (%), by Country 2024 & 2032
- Figure 10: Middle East and Africa Aloe Vera Products Industry Revenue (Million), by Country 2024 & 2032
- Figure 11: Middle East and Africa Aloe Vera Products Industry Revenue Share (%), by Country 2024 & 2032
- Figure 12: North America Aloe Vera Products Industry Revenue (Million), by Product Type 2024 & 2032
- Figure 13: North America Aloe Vera Products Industry Revenue Share (%), by Product Type 2024 & 2032
- Figure 14: North America Aloe Vera Products Industry Revenue (Million), by Distribution Channel 2024 & 2032
- Figure 15: North America Aloe Vera Products Industry Revenue Share (%), by Distribution Channel 2024 & 2032
- Figure 16: North America Aloe Vera Products Industry Revenue (Million), by Country 2024 & 2032
- Figure 17: North America Aloe Vera Products Industry Revenue Share (%), by Country 2024 & 2032
- Figure 18: Europe Aloe Vera Products Industry Revenue (Million), by Product Type 2024 & 2032
- Figure 19: Europe Aloe Vera Products Industry Revenue Share (%), by Product Type 2024 & 2032
- Figure 20: Europe Aloe Vera Products Industry Revenue (Million), by Distribution Channel 2024 & 2032
- Figure 21: Europe Aloe Vera Products Industry Revenue Share (%), by Distribution Channel 2024 & 2032
- Figure 22: Europe Aloe Vera Products Industry Revenue (Million), by Country 2024 & 2032
- Figure 23: Europe Aloe Vera Products Industry Revenue Share (%), by Country 2024 & 2032
- Figure 24: Asia Pacific Aloe Vera Products Industry Revenue (Million), by Product Type 2024 & 2032
- Figure 25: Asia Pacific Aloe Vera Products Industry Revenue Share (%), by Product Type 2024 & 2032
- Figure 26: Asia Pacific Aloe Vera Products Industry Revenue (Million), by Distribution Channel 2024 & 2032
- Figure 27: Asia Pacific Aloe Vera Products Industry Revenue Share (%), by Distribution Channel 2024 & 2032
- Figure 28: Asia Pacific Aloe Vera Products Industry Revenue (Million), by Country 2024 & 2032
- Figure 29: Asia Pacific Aloe Vera Products Industry Revenue Share (%), by Country 2024 & 2032
- Figure 30: South America Aloe Vera Products Industry Revenue (Million), by Product Type 2024 & 2032
- Figure 31: South America Aloe Vera Products Industry Revenue Share (%), by Product Type 2024 & 2032
- Figure 32: South America Aloe Vera Products Industry Revenue (Million), by Distribution Channel 2024 & 2032
- Figure 33: South America Aloe Vera Products Industry Revenue Share (%), by Distribution Channel 2024 & 2032
- Figure 34: South America Aloe Vera Products Industry Revenue (Million), by Country 2024 & 2032
- Figure 35: South America Aloe Vera Products Industry Revenue Share (%), by Country 2024 & 2032
- Figure 36: Middle East and Africa Aloe Vera Products Industry Revenue (Million), by Product Type 2024 & 2032
- Figure 37: Middle East and Africa Aloe Vera Products Industry Revenue Share (%), by Product Type 2024 & 2032
- Figure 38: Middle East and Africa Aloe Vera Products Industry Revenue (Million), by Distribution Channel 2024 & 2032
- Figure 39: Middle East and Africa Aloe Vera Products Industry Revenue Share (%), by Distribution Channel 2024 & 2032
- Figure 40: Middle East and Africa Aloe Vera Products Industry Revenue (Million), by Country 2024 & 2032
- Figure 41: Middle East and Africa Aloe Vera Products Industry Revenue Share (%), by Country 2024 & 2032
List of Tables
- Table 1: Global Aloe Vera Products Industry Revenue Million Forecast, by Region 2019 & 2032
- Table 2: Global Aloe Vera Products Industry Revenue Million Forecast, by Product Type 2019 & 2032
- Table 3: Global Aloe Vera Products Industry Revenue Million Forecast, by Distribution Channel 2019 & 2032
- Table 4: Global Aloe Vera Products Industry Revenue Million Forecast, by Region 2019 & 2032
- Table 5: Global Aloe Vera Products Industry Revenue Million Forecast, by Country 2019 & 2032
- Table 6: United States Aloe Vera Products Industry Revenue (Million) Forecast, by Application 2019 & 2032
- Table 7: Canada Aloe Vera Products Industry Revenue (Million) Forecast, by Application 2019 & 2032
- Table 8: Mexico Aloe Vera Products Industry Revenue (Million) Forecast, by Application 2019 & 2032
- Table 9: Rest of North America Aloe Vera Products Industry Revenue (Million) Forecast, by Application 2019 & 2032
- Table 10: Global Aloe Vera Products Industry Revenue Million Forecast, by Country 2019 & 2032
- Table 11: Spain Aloe Vera Products Industry Revenue (Million) Forecast, by Application 2019 & 2032
- Table 12: United Kingdom Aloe Vera Products Industry Revenue (Million) Forecast, by Application 2019 & 2032
- Table 13: Germany Aloe Vera Products Industry Revenue (Million) Forecast, by Application 2019 & 2032
- Table 14: France Aloe Vera Products Industry Revenue (Million) Forecast, by Application 2019 & 2032
- Table 15: Italy Aloe Vera Products Industry Revenue (Million) Forecast, by Application 2019 & 2032
- Table 16: Russia Aloe Vera Products Industry Revenue (Million) Forecast, by Application 2019 & 2032
- Table 17: Rest of Europe Aloe Vera Products Industry Revenue (Million) Forecast, by Application 2019 & 2032
- Table 18: Global Aloe Vera Products Industry Revenue Million Forecast, by Country 2019 & 2032
- Table 19: China Aloe Vera Products Industry Revenue (Million) Forecast, by Application 2019 & 2032
- Table 20: Japan Aloe Vera Products Industry Revenue (Million) Forecast, by Application 2019 & 2032
- Table 21: India Aloe Vera Products Industry Revenue (Million) Forecast, by Application 2019 & 2032
- Table 22: Australia Aloe Vera Products Industry Revenue (Million) Forecast, by Application 2019 & 2032
- Table 23: Rest of Asia Pacific Aloe Vera Products Industry Revenue (Million) Forecast, by Application 2019 & 2032
- Table 24: Global Aloe Vera Products Industry Revenue Million Forecast, by Country 2019 & 2032
- Table 25: Brazil Aloe Vera Products Industry Revenue (Million) Forecast, by Application 2019 & 2032
- Table 26: Argentina Aloe Vera Products Industry Revenue (Million) Forecast, by Application 2019 & 2032
- Table 27: Rest of South America Aloe Vera Products Industry Revenue (Million) Forecast, by Application 2019 & 2032
- Table 28: Global Aloe Vera Products Industry Revenue Million Forecast, by Country 2019 & 2032
- Table 29: South Africa Aloe Vera Products Industry Revenue (Million) Forecast, by Application 2019 & 2032
- Table 30: Saudi Arabia Aloe Vera Products Industry Revenue (Million) Forecast, by Application 2019 & 2032
- Table 31: Rest of Middle East and Africa Aloe Vera Products Industry Revenue (Million) Forecast, by Application 2019 & 2032
- Table 32: Global Aloe Vera Products Industry Revenue Million Forecast, by Product Type 2019 & 2032
- Table 33: Global Aloe Vera Products Industry Revenue Million Forecast, by Distribution Channel 2019 & 2032
- Table 34: Global Aloe Vera Products Industry Revenue Million Forecast, by Country 2019 & 2032
- Table 35: United States Aloe Vera Products Industry Revenue (Million) Forecast, by Application 2019 & 2032
- Table 36: Canada Aloe Vera Products Industry Revenue (Million) Forecast, by Application 2019 & 2032
- Table 37: Mexico Aloe Vera Products Industry Revenue (Million) Forecast, by Application 2019 & 2032
- Table 38: Rest of North America Aloe Vera Products Industry Revenue (Million) Forecast, by Application 2019 & 2032
- Table 39: Global Aloe Vera Products Industry Revenue Million Forecast, by Product Type 2019 & 2032
- Table 40: Global Aloe Vera Products Industry Revenue Million Forecast, by Distribution Channel 2019 & 2032
- Table 41: Global Aloe Vera Products Industry Revenue Million Forecast, by Country 2019 & 2032
- Table 42: Spain Aloe Vera Products Industry Revenue (Million) Forecast, by Application 2019 & 2032
- Table 43: United Kingdom Aloe Vera Products Industry Revenue (Million) Forecast, by Application 2019 & 2032
- Table 44: Germany Aloe Vera Products Industry Revenue (Million) Forecast, by Application 2019 & 2032
- Table 45: France Aloe Vera Products Industry Revenue (Million) Forecast, by Application 2019 & 2032
- Table 46: Italy Aloe Vera Products Industry Revenue (Million) Forecast, by Application 2019 & 2032
- Table 47: Russia Aloe Vera Products Industry Revenue (Million) Forecast, by Application 2019 & 2032
- Table 48: Rest of Europe Aloe Vera Products Industry Revenue (Million) Forecast, by Application 2019 & 2032
- Table 49: Global Aloe Vera Products Industry Revenue Million Forecast, by Product Type 2019 & 2032
- Table 50: Global Aloe Vera Products Industry Revenue Million Forecast, by Distribution Channel 2019 & 2032
- Table 51: Global Aloe Vera Products Industry Revenue Million Forecast, by Country 2019 & 2032
- Table 52: China Aloe Vera Products Industry Revenue (Million) Forecast, by Application 2019 & 2032
- Table 53: Japan Aloe Vera Products Industry Revenue (Million) Forecast, by Application 2019 & 2032
- Table 54: India Aloe Vera Products Industry Revenue (Million) Forecast, by Application 2019 & 2032
- Table 55: Australia Aloe Vera Products Industry Revenue (Million) Forecast, by Application 2019 & 2032
- Table 56: Rest of Asia Pacific Aloe Vera Products Industry Revenue (Million) Forecast, by Application 2019 & 2032
- Table 57: Global Aloe Vera Products Industry Revenue Million Forecast, by Product Type 2019 & 2032
- Table 58: Global Aloe Vera Products Industry Revenue Million Forecast, by Distribution Channel 2019 & 2032
- Table 59: Global Aloe Vera Products Industry Revenue Million Forecast, by Country 2019 & 2032
- Table 60: Brazil Aloe Vera Products Industry Revenue (Million) Forecast, by Application 2019 & 2032
- Table 61: Argentina Aloe Vera Products Industry Revenue (Million) Forecast, by Application 2019 & 2032
- Table 62: Rest of South America Aloe Vera Products Industry Revenue (Million) Forecast, by Application 2019 & 2032
- Table 63: Global Aloe Vera Products Industry Revenue Million Forecast, by Product Type 2019 & 2032
- Table 64: Global Aloe Vera Products Industry Revenue Million Forecast, by Distribution Channel 2019 & 2032
- Table 65: Global Aloe Vera Products Industry Revenue Million Forecast, by Country 2019 & 2032
- Table 66: South Africa Aloe Vera Products Industry Revenue (Million) Forecast, by Application 2019 & 2032
- Table 67: Saudi Arabia Aloe Vera Products Industry Revenue (Million) Forecast, by Application 2019 & 2032
- Table 68: Rest of Middle East and Africa Aloe Vera Products Industry Revenue (Million) Forecast, by Application 2019 & 2032
Frequently Asked Questions
1. What is the projected Compound Annual Growth Rate (CAGR) of the Aloe Vera Products Industry?
The projected CAGR is approximately 10.90%.
2. Which companies are prominent players in the Aloe Vera Products Industry?
Key companies in the market include Grace Foods, Tory's Choice Inc, OKF, Alterfood, Okyalo, Houssy Global, Veganic*List Not Exhaustive, Forever Living Products, Simplee Aloe.
3. What are the main segments of the Aloe Vera Products Industry?
The market segments include Product Type, Distribution Channel.
4. Can you provide details about the market size?
The market size is estimated to be USD 155.16 Million as of 2022.
5. What are some drivers contributing to market growth?
Increasing Consumer Awareness Regarding Natural Products; Growing Demand for Anthocyanin in Pharmaceutical Industry.
6. What are the notable trends driving market growth?
Aloe Vera based Juices to Witness Higher Growth.
7. Are there any restraints impacting market growth?
Easy Availability of Synthetic Food Colorant.
8. Can you provide examples of recent developments in the market?
September 2022: 1NE Beverages, a seasoning and beverage brand under the subsidiary of US-based Livinia Foods, launched aloe vera juices available in a range of flavors in India. The company claims the product has antioxidant properties and multiple health benefits ranging from skin, oral, dental, or digestive health.
9. What pricing options are available for accessing the report?
Pricing options include single-user, multi-user, and enterprise licenses priced at USD 4750, USD 5250, and USD 8750 respectively.
10. Is the market size provided in terms of value or volume?
The market size is provided in terms of value, measured in Million.
11. Are there any specific market keywords associated with the report?
Yes, the market keyword associated with the report is "Aloe Vera Products Industry," which aids in identifying and referencing the specific market segment covered.
12. How do I determine which pricing option suits my needs best?
The pricing options vary based on user requirements and access needs. Individual users may opt for single-user licenses, while businesses requiring broader access may choose multi-user or enterprise licenses for cost-effective access to the report.
13. Are there any additional resources or data provided in the Aloe Vera Products Industry report?
While the report offers comprehensive insights, it's advisable to review the specific contents or supplementary materials provided to ascertain if additional resources or data are available.
14. How can I stay updated on further developments or reports in the Aloe Vera Products Industry?
To stay informed about further developments, trends, and reports in the Aloe Vera Products Industry, consider subscribing to industry newsletters, following relevant companies and organizations, or regularly checking reputable industry news sources and publications.
Methodology
Step 1 - Identification of Relevant Samples Size from Population Database


Step 2 - Approaches for Defining Global Market Size (Value, Volume* & Price*)

Note*: In applicable scenarios
Step 3 - Data Sources
Primary Research
- Web Analytics
- Survey Reports
- Research Institute
- Latest Research Reports
- Opinion Leaders
Secondary Research
- Annual Reports
- White Paper
- Latest Press Release
- Industry Association
- Paid Database
- Investor Presentations

Step 4 - Data Triangulation
Involves using different sources of information in order to increase the validity of a study
These sources are likely to be stakeholders in a program - participants, other researchers, program staff, other community members, and so on.
Then we put all data in single framework & apply various statistical tools to find out the dynamic on the market.
During the analysis stage, feedback from the stakeholder groups would be compared to determine areas of agreement as well as areas of divergence


