
Key Insights
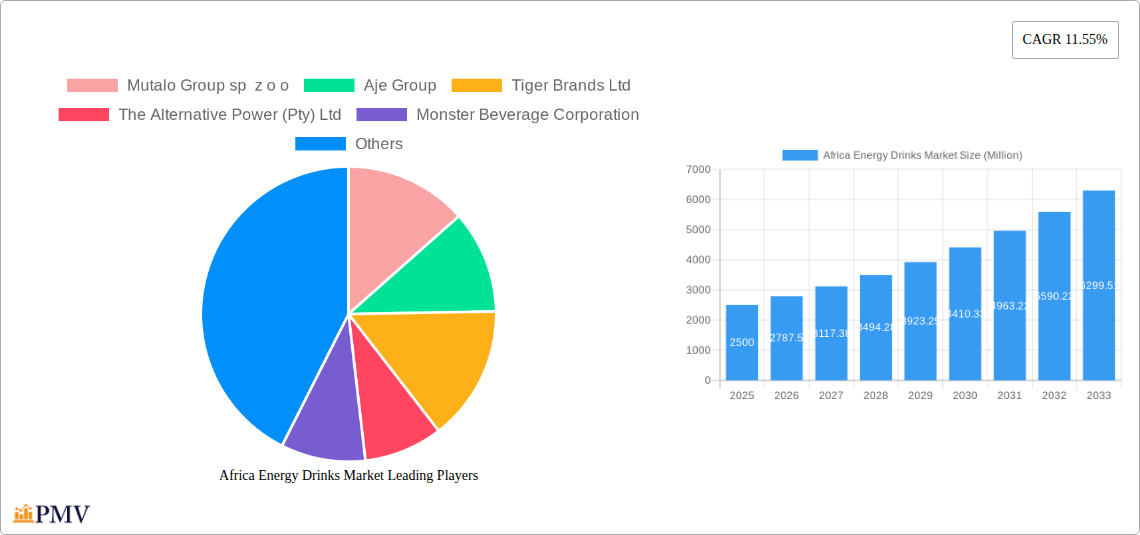
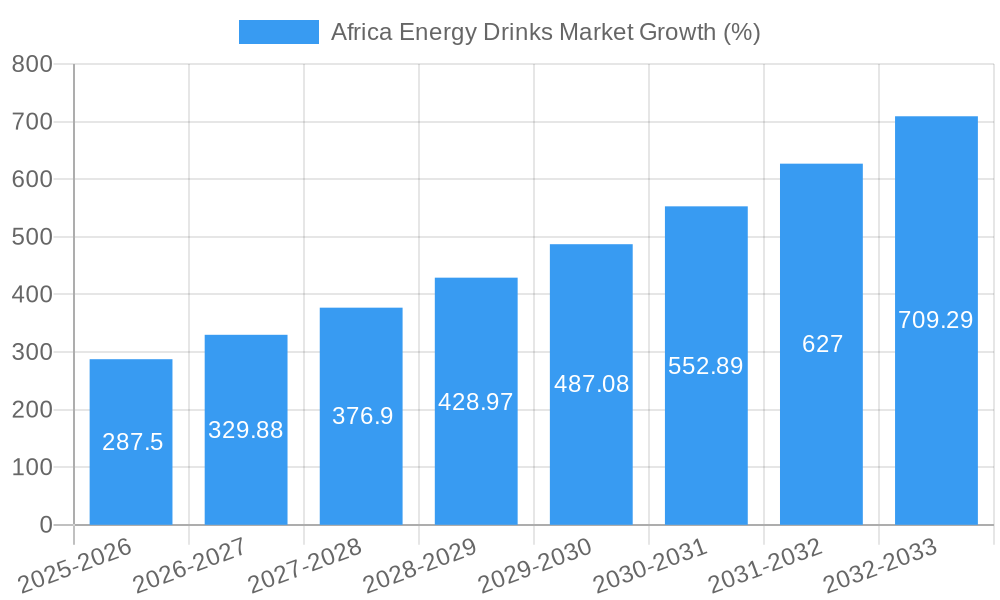
The African energy drinks market is experiencing robust growth, projected to reach a significant market size by 2033. A Compound Annual Growth Rate (CAGR) of 11.55% from 2019 to 2024 indicates a dynamic market fueled by several key drivers. Increasing urbanization, rising disposable incomes, and a growing young adult population, particularly in countries like Nigeria, South Africa, and Egypt, are significantly boosting demand. The market is segmented by packaging type (glass bottles, metal cans, PET bottles), distribution channels (off-trade, on-trade), and product type (energy shots, natural/organic, sugar-free/low-calorie, traditional, and other energy drinks). The popularity of natural and organic energy drinks is on the rise, driven by increasing health consciousness among consumers, while the traditional energy drink segment retains a substantial market share due to established brand recognition and widespread availability. Key players like Red Bull, Coca-Cola, PepsiCo, and Monster Beverage Corporation are actively competing, often through localized strategies to adapt to cultural preferences and distribution networks. However, challenges remain. These include fluctuating raw material prices, regulatory hurdles in some African countries concerning sugar content and marketing regulations, and the need for robust distribution infrastructure to reach consumers in remote areas. Furthermore, competition from locally produced, lower-priced brands will shape the market landscape in the coming years.
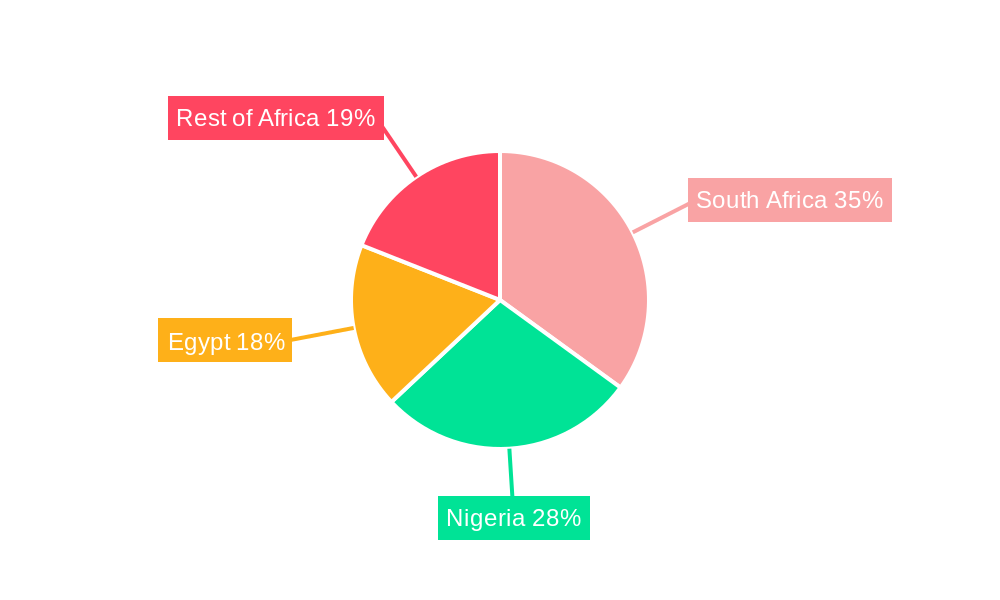
The forecast period of 2025-2033 anticipates continued expansion, although the rate might slightly moderate due to potential economic factors. South Africa is currently a leading market, given its relatively developed economy and infrastructure, but Nigeria and Egypt are poised for substantial growth, offering lucrative opportunities for both established international players and emerging local brands. Strategic partnerships with local distributors and tailored marketing campaigns will be crucial for companies seeking to capture a larger share of this promising but complex market. The focus will likely be on product diversification, exploring innovative flavors and formulations to appeal to the diverse tastes of African consumers and increasing affordability to cater to a wider consumer base.
Africa Energy Drinks Market: A Comprehensive Report (2019-2033)
This comprehensive report provides a detailed analysis of the Africa energy drinks market, offering valuable insights for industry stakeholders, investors, and businesses seeking to navigate this dynamic landscape. The report covers the period 2019-2033, with a focus on 2025, and incorporates detailed segmentation, competitive analysis, and future growth projections. The market is valued at xx Million in 2025 and is projected to reach xx Million by 2033, exhibiting a CAGR of xx%.
Africa Energy Drinks Market Market Structure & Competitive Dynamics
This section delves into the competitive landscape of the African energy drinks market, analyzing market concentration, innovation, regulations, substitutes, and M&A activity. The market is characterized by a mix of multinational giants and local players, leading to a moderately fragmented structure. Market share data reveals that The Coca-Cola Company and Red Bull GmbH hold significant shares, while regional players like Aje Group and MoFaya Beverage Company (PTY) Ltd are making inroads. Innovation is driven by both established players introducing new flavors and formats, and emerging brands focusing on niche segments like natural/organic or sugar-free energy drinks. Regulatory frameworks vary across African countries, impacting product labeling, ingredient restrictions, and marketing practices. The increasing consumer preference for healthier options presents both a challenge and an opportunity, with a rise in sugar-free and functional energy drinks. Recent M&A activity has been moderate, with deal values ranging from xx Million to xx Million, primarily focused on expanding distribution networks or acquiring local brands.
- Market Concentration: Moderately fragmented, with major players holding significant but not dominant shares.
- Innovation Ecosystems: Active, with both established and emerging players driving product diversification.
- Regulatory Frameworks: Vary across countries, creating both opportunities and challenges for market participants.
- Product Substitutes: Include other beverages like sports drinks, juices, and carbonated soft drinks.
- End-User Trends: Shifting towards healthier options like sugar-free and functional energy drinks.
- M&A Activity: Moderate activity, with deals focused on distribution and market penetration.
Africa Energy Drinks Market Industry Trends & Insights
The African energy drinks market is experiencing significant growth, driven by several factors. Rising disposable incomes, particularly among the younger population, fuel demand for premium and convenient beverages. Urbanization and the growing adoption of western lifestyles are also contributing to market expansion. However, challenges remain including limited cold chain infrastructure in certain regions, hindering the distribution of perishable products. Technological disruptions, such as innovative packaging solutions and personalized marketing campaigns, are reshaping the industry. Consumer preferences are increasingly focused on natural, organic, and sugar-free options, forcing producers to adapt their product offerings. The market’s competitive dynamics are marked by intense rivalry, particularly between global giants and agile local players. This competitive landscape fosters innovation and provides consumers with diverse options. The market's CAGR during the historical period (2019-2024) was xx%, and the market penetration rate stands at xx% in 2025, with further growth projected.
Dominant Markets & Segments in Africa Energy Drinks Market
South Africa represents the largest national market for energy drinks in Africa, driven by strong economic growth, high levels of urbanization, and a sizeable young population. Nigeria is another key market with substantial growth potential.
- Leading Region: Southern Africa
- Leading Country: South Africa
- Dominant Packaging Type: PET Bottles due to affordability and convenience.
- Dominant Distribution Channel: Off-trade channels, particularly convenience stores and supermarkets, hold the largest share.
- Dominant Soft Drink Type: Traditional energy drinks, due to established consumer preference.
Key Drivers for South Africa's Dominance:
- Strong and relatively stable economy.
- Well-developed distribution infrastructure.
- Higher per capita income compared to many other African countries.
- Younger population with higher disposable income.
Egypt and Nigeria also represent key markets with substantial growth, although facing challenges with less developed infrastructure compared to South Africa.
Africa Energy Drinks Market Product Innovations
Recent product innovation has largely focused on introducing new flavors, catering to diverse consumer preferences. The addition of functional ingredients and improved packaging formats (e.g., recyclable materials) reflects growing environmental consciousness among consumers. The market also shows a trend towards natural and organic options, and sugar-free variants targeting health-conscious consumers. Limited-edition releases tied to local events or collaborations with influencers further increase product appeal and brand visibility.
Report Segmentation & Scope
This report segments the Africa energy drinks market by:
- Packaging Type: Glass Bottles, Metal Can, PET Bottles (Growth projections and market size available for each).
- Distribution Channel: Off-trade (Supermarkets, convenience stores etc.), On-trade (Bars, restaurants etc.) (Market size and competitive analysis for each).
- Soft Drink Type: Energy Shots, Natural/Organic Energy Drinks, Sugar-free or Low-calories Energy Drinks, Traditional Energy Drinks, Other Energy Drinks (Growth projections and market share for each).
- Country: Egypt, Nigeria, South Africa, Rest of Africa (Market size and competitive dynamics for each).
Key Drivers of Africa Energy Drinks Market Growth
The growth of the African energy drinks market is propelled by several key drivers:
- Rising Disposable Incomes: Increased purchasing power, especially among younger consumers, fuels demand for premium beverages.
- Urbanization: Growing urban populations lead to increased exposure to Western lifestyle trends and higher energy drink consumption.
- Changing Lifestyles: Busy lifestyles and the need for enhanced energy and focus drive demand.
- Favorable Demographics: A young and growing population represents a substantial consumer base.
Challenges in the Africa Energy Drinks Market Sector
The African energy drinks market faces numerous challenges:
- Infrastructure Limitations: Inadequate cold chain infrastructure in many areas hinders distribution of temperature-sensitive beverages.
- Regulatory Hurdles: Varied regulations across countries complicate product launch and marketing strategies.
- Competitive Pressures: Intense competition, both from global and regional players, necessitates continuous innovation and differentiation.
- Economic Volatility: Economic instability in certain regions can impact consumer spending and market growth.
Leading Players in the Africa Energy Drinks Market Market
- Mutalo Group sp z o o
- Aje Group
- Tiger Brands Ltd
- The Alternative Power (Pty) Ltd
- Monster Beverage Corporation
- PepsiCo Inc
- Mofaya Beverage Company (PTY) Ltd
- S Spitz GmbH
- Suntory Holdings Limited
- Red Bull GmbH
- Halewood International South Africa (Pty) Ltd
- The Coca-Cola Company
Key Developments in Africa Energy Drinks Market Sector
- October 2023: Miss South Africa Natasha Joubert launches a new Berry Queen-flavored energy drink under the MoFaya brand, signaling a celebrity endorsement and potential expansion.
- October 2023: Switch Energy Drink introduces three new limited-edition flavors, suggesting a focus on flavor innovation and limited-time promotions.
- September 2023: Switch Energy Drink launches a special limited-edition flavor for South African Heritage Day, highlighting the use of localized marketing strategies.
Strategic Africa Energy Drinks Market Market Outlook
The African energy drinks market holds significant long-term growth potential, driven by favorable demographics, rising incomes, and ongoing urbanization. Strategic opportunities exist for companies focused on innovation, particularly in the natural/organic and sugar-free segments. Companies that establish robust distribution networks and adapt to the diverse regulatory landscape across different African countries will be well-positioned to capture market share. Expanding into underserved regions and leveraging digital marketing to reach younger consumers will be crucial for sustained success.
Africa Energy Drinks Market Segmentation
-
1. Soft Drink Type
- 1.1. Energy Shots
- 1.2. Natural/Organic Energy Drinks
- 1.3. Sugar-free or Low-calories Energy Drinks
- 1.4. Traditional Energy Drinks
- 1.5. Other Energy Drinks
-
2. Packaging Type
- 2.1. Glass Bottles
- 2.2. Metal Can
- 2.3. PET Bottles
-
3. Distribution Channel
-
3.1. Off-trade
- 3.1.1. Convenience Stores
- 3.1.2. Online Retail
- 3.1.3. Supermarket/Hypermarket
- 3.1.4. Others
- 3.2. On-trade
-
3.1. Off-trade
Africa Energy Drinks Market Segmentation By Geography
-
1. Africa
- 1.1. Nigeria
- 1.2. South Africa
- 1.3. Egypt
- 1.4. Kenya
- 1.5. Ethiopia
- 1.6. Morocco
- 1.7. Ghana
- 1.8. Algeria
- 1.9. Tanzania
- 1.10. Ivory Coast
Africa Energy Drinks Market REPORT HIGHLIGHTS
| Aspects | Details |
|---|---|
| Study Period | 2019-2033 |
| Base Year | 2024 |
| Estimated Year | 2025 |
| Forecast Period | 2025-2033 |
| Historical Period | 2019-2024 |
| Growth Rate | CAGR of 11.55% from 2019-2033 |
| Segmentation |
|
Table of Contents
- 1. Introduction
- 1.1. Research Scope
- 1.2. Market Segmentation
- 1.3. Research Methodology
- 1.4. Definitions and Assumptions
- 2. Executive Summary
- 2.1. Introduction
- 3. Market Dynamics
- 3.1. Introduction
- 3.2. Market Drivers
- 3.2.1. Increasing Demand for Protein-Rich Food; Increasing Demand for Plant-Based and Organic Ingredients
- 3.3. Market Restrains
- 3.3.1. Presence of Counterfeit Products
- 3.4. Market Trends
- 3.4.1. OTHER KEY INDUSTRY TRENDS COVERED IN THE REPORT
- 4. Market Factor Analysis
- 4.1. Porters Five Forces
- 4.2. Supply/Value Chain
- 4.3. PESTEL analysis
- 4.4. Market Entropy
- 4.5. Patent/Trademark Analysis
- 5. Africa Energy Drinks Market Analysis, Insights and Forecast, 2019-2031
- 5.1. Market Analysis, Insights and Forecast - by Soft Drink Type
- 5.1.1. Energy Shots
- 5.1.2. Natural/Organic Energy Drinks
- 5.1.3. Sugar-free or Low-calories Energy Drinks
- 5.1.4. Traditional Energy Drinks
- 5.1.5. Other Energy Drinks
- 5.2. Market Analysis, Insights and Forecast - by Packaging Type
- 5.2.1. Glass Bottles
- 5.2.2. Metal Can
- 5.2.3. PET Bottles
- 5.3. Market Analysis, Insights and Forecast - by Distribution Channel
- 5.3.1. Off-trade
- 5.3.1.1. Convenience Stores
- 5.3.1.2. Online Retail
- 5.3.1.3. Supermarket/Hypermarket
- 5.3.1.4. Others
- 5.3.2. On-trade
- 5.3.1. Off-trade
- 5.4. Market Analysis, Insights and Forecast - by Region
- 5.4.1. Africa
- 5.1. Market Analysis, Insights and Forecast - by Soft Drink Type
- 6. South Africa Africa Energy Drinks Market Analysis, Insights and Forecast, 2019-2031
- 7. Sudan Africa Energy Drinks Market Analysis, Insights and Forecast, 2019-2031
- 8. Uganda Africa Energy Drinks Market Analysis, Insights and Forecast, 2019-2031
- 9. Tanzania Africa Energy Drinks Market Analysis, Insights and Forecast, 2019-2031
- 10. Kenya Africa Energy Drinks Market Analysis, Insights and Forecast, 2019-2031
- 11. Rest of Africa Africa Energy Drinks Market Analysis, Insights and Forecast, 2019-2031
- 12. Competitive Analysis
- 12.1. Market Share Analysis 2024
- 12.2. Company Profiles
- 12.2.1 Mutalo Group sp z o o
- 12.2.1.1. Overview
- 12.2.1.2. Products
- 12.2.1.3. SWOT Analysis
- 12.2.1.4. Recent Developments
- 12.2.1.5. Financials (Based on Availability)
- 12.2.2 Aje Group
- 12.2.2.1. Overview
- 12.2.2.2. Products
- 12.2.2.3. SWOT Analysis
- 12.2.2.4. Recent Developments
- 12.2.2.5. Financials (Based on Availability)
- 12.2.3 Tiger Brands Ltd
- 12.2.3.1. Overview
- 12.2.3.2. Products
- 12.2.3.3. SWOT Analysis
- 12.2.3.4. Recent Developments
- 12.2.3.5. Financials (Based on Availability)
- 12.2.4 The Alternative Power (Pty) Ltd
- 12.2.4.1. Overview
- 12.2.4.2. Products
- 12.2.4.3. SWOT Analysis
- 12.2.4.4. Recent Developments
- 12.2.4.5. Financials (Based on Availability)
- 12.2.5 Monster Beverage Corporation
- 12.2.5.1. Overview
- 12.2.5.2. Products
- 12.2.5.3. SWOT Analysis
- 12.2.5.4. Recent Developments
- 12.2.5.5. Financials (Based on Availability)
- 12.2.6 PepsiCo Inc
- 12.2.6.1. Overview
- 12.2.6.2. Products
- 12.2.6.3. SWOT Analysis
- 12.2.6.4. Recent Developments
- 12.2.6.5. Financials (Based on Availability)
- 12.2.7 Mofaya Beverage Company (PTY) Ltd
- 12.2.7.1. Overview
- 12.2.7.2. Products
- 12.2.7.3. SWOT Analysis
- 12.2.7.4. Recent Developments
- 12.2.7.5. Financials (Based on Availability)
- 12.2.8 S Spitz GmbH
- 12.2.8.1. Overview
- 12.2.8.2. Products
- 12.2.8.3. SWOT Analysis
- 12.2.8.4. Recent Developments
- 12.2.8.5. Financials (Based on Availability)
- 12.2.9 Suntory Holdings Limited
- 12.2.9.1. Overview
- 12.2.9.2. Products
- 12.2.9.3. SWOT Analysis
- 12.2.9.4. Recent Developments
- 12.2.9.5. Financials (Based on Availability)
- 12.2.10 Red Bull GmbH
- 12.2.10.1. Overview
- 12.2.10.2. Products
- 12.2.10.3. SWOT Analysis
- 12.2.10.4. Recent Developments
- 12.2.10.5. Financials (Based on Availability)
- 12.2.11 Halewood International South Africa (Pty) Ltd
- 12.2.11.1. Overview
- 12.2.11.2. Products
- 12.2.11.3. SWOT Analysis
- 12.2.11.4. Recent Developments
- 12.2.11.5. Financials (Based on Availability)
- 12.2.12 The Coca-Cola Company
- 12.2.12.1. Overview
- 12.2.12.2. Products
- 12.2.12.3. SWOT Analysis
- 12.2.12.4. Recent Developments
- 12.2.12.5. Financials (Based on Availability)
- 12.2.1 Mutalo Group sp z o o
List of Figures
- Figure 1: Africa Energy Drinks Market Revenue Breakdown (Million, %) by Product 2024 & 2032
- Figure 2: Africa Energy Drinks Market Share (%) by Company 2024
List of Tables
- Table 1: Africa Energy Drinks Market Revenue Million Forecast, by Region 2019 & 2032
- Table 2: Africa Energy Drinks Market Volume K Tons Forecast, by Region 2019 & 2032
- Table 3: Africa Energy Drinks Market Revenue Million Forecast, by Soft Drink Type 2019 & 2032
- Table 4: Africa Energy Drinks Market Volume K Tons Forecast, by Soft Drink Type 2019 & 2032
- Table 5: Africa Energy Drinks Market Revenue Million Forecast, by Packaging Type 2019 & 2032
- Table 6: Africa Energy Drinks Market Volume K Tons Forecast, by Packaging Type 2019 & 2032
- Table 7: Africa Energy Drinks Market Revenue Million Forecast, by Distribution Channel 2019 & 2032
- Table 8: Africa Energy Drinks Market Volume K Tons Forecast, by Distribution Channel 2019 & 2032
- Table 9: Africa Energy Drinks Market Revenue Million Forecast, by Region 2019 & 2032
- Table 10: Africa Energy Drinks Market Volume K Tons Forecast, by Region 2019 & 2032
- Table 11: Africa Energy Drinks Market Revenue Million Forecast, by Country 2019 & 2032
- Table 12: Africa Energy Drinks Market Volume K Tons Forecast, by Country 2019 & 2032
- Table 13: South Africa Africa Energy Drinks Market Revenue (Million) Forecast, by Application 2019 & 2032
- Table 14: South Africa Africa Energy Drinks Market Volume (K Tons) Forecast, by Application 2019 & 2032
- Table 15: Sudan Africa Energy Drinks Market Revenue (Million) Forecast, by Application 2019 & 2032
- Table 16: Sudan Africa Energy Drinks Market Volume (K Tons) Forecast, by Application 2019 & 2032
- Table 17: Uganda Africa Energy Drinks Market Revenue (Million) Forecast, by Application 2019 & 2032
- Table 18: Uganda Africa Energy Drinks Market Volume (K Tons) Forecast, by Application 2019 & 2032
- Table 19: Tanzania Africa Energy Drinks Market Revenue (Million) Forecast, by Application 2019 & 2032
- Table 20: Tanzania Africa Energy Drinks Market Volume (K Tons) Forecast, by Application 2019 & 2032
- Table 21: Kenya Africa Energy Drinks Market Revenue (Million) Forecast, by Application 2019 & 2032
- Table 22: Kenya Africa Energy Drinks Market Volume (K Tons) Forecast, by Application 2019 & 2032
- Table 23: Rest of Africa Africa Energy Drinks Market Revenue (Million) Forecast, by Application 2019 & 2032
- Table 24: Rest of Africa Africa Energy Drinks Market Volume (K Tons) Forecast, by Application 2019 & 2032
- Table 25: Africa Energy Drinks Market Revenue Million Forecast, by Soft Drink Type 2019 & 2032
- Table 26: Africa Energy Drinks Market Volume K Tons Forecast, by Soft Drink Type 2019 & 2032
- Table 27: Africa Energy Drinks Market Revenue Million Forecast, by Packaging Type 2019 & 2032
- Table 28: Africa Energy Drinks Market Volume K Tons Forecast, by Packaging Type 2019 & 2032
- Table 29: Africa Energy Drinks Market Revenue Million Forecast, by Distribution Channel 2019 & 2032
- Table 30: Africa Energy Drinks Market Volume K Tons Forecast, by Distribution Channel 2019 & 2032
- Table 31: Africa Energy Drinks Market Revenue Million Forecast, by Country 2019 & 2032
- Table 32: Africa Energy Drinks Market Volume K Tons Forecast, by Country 2019 & 2032
- Table 33: Nigeria Africa Energy Drinks Market Revenue (Million) Forecast, by Application 2019 & 2032
- Table 34: Nigeria Africa Energy Drinks Market Volume (K Tons) Forecast, by Application 2019 & 2032
- Table 35: South Africa Africa Energy Drinks Market Revenue (Million) Forecast, by Application 2019 & 2032
- Table 36: South Africa Africa Energy Drinks Market Volume (K Tons) Forecast, by Application 2019 & 2032
- Table 37: Egypt Africa Energy Drinks Market Revenue (Million) Forecast, by Application 2019 & 2032
- Table 38: Egypt Africa Energy Drinks Market Volume (K Tons) Forecast, by Application 2019 & 2032
- Table 39: Kenya Africa Energy Drinks Market Revenue (Million) Forecast, by Application 2019 & 2032
- Table 40: Kenya Africa Energy Drinks Market Volume (K Tons) Forecast, by Application 2019 & 2032
- Table 41: Ethiopia Africa Energy Drinks Market Revenue (Million) Forecast, by Application 2019 & 2032
- Table 42: Ethiopia Africa Energy Drinks Market Volume (K Tons) Forecast, by Application 2019 & 2032
- Table 43: Morocco Africa Energy Drinks Market Revenue (Million) Forecast, by Application 2019 & 2032
- Table 44: Morocco Africa Energy Drinks Market Volume (K Tons) Forecast, by Application 2019 & 2032
- Table 45: Ghana Africa Energy Drinks Market Revenue (Million) Forecast, by Application 2019 & 2032
- Table 46: Ghana Africa Energy Drinks Market Volume (K Tons) Forecast, by Application 2019 & 2032
- Table 47: Algeria Africa Energy Drinks Market Revenue (Million) Forecast, by Application 2019 & 2032
- Table 48: Algeria Africa Energy Drinks Market Volume (K Tons) Forecast, by Application 2019 & 2032
- Table 49: Tanzania Africa Energy Drinks Market Revenue (Million) Forecast, by Application 2019 & 2032
- Table 50: Tanzania Africa Energy Drinks Market Volume (K Tons) Forecast, by Application 2019 & 2032
- Table 51: Ivory Coast Africa Energy Drinks Market Revenue (Million) Forecast, by Application 2019 & 2032
- Table 52: Ivory Coast Africa Energy Drinks Market Volume (K Tons) Forecast, by Application 2019 & 2032
Frequently Asked Questions
1. What is the projected Compound Annual Growth Rate (CAGR) of the Africa Energy Drinks Market?
The projected CAGR is approximately 11.55%.
2. Which companies are prominent players in the Africa Energy Drinks Market?
Key companies in the market include Mutalo Group sp z o o, Aje Group, Tiger Brands Ltd, The Alternative Power (Pty) Ltd, Monster Beverage Corporation, PepsiCo Inc, Mofaya Beverage Company (PTY) Ltd, S Spitz GmbH, Suntory Holdings Limited, Red Bull GmbH, Halewood International South Africa (Pty) Ltd, The Coca-Cola Company.
3. What are the main segments of the Africa Energy Drinks Market?
The market segments include Soft Drink Type, Packaging Type, Distribution Channel.
4. Can you provide details about the market size?
The market size is estimated to be USD XX Million as of 2022.
5. What are some drivers contributing to market growth?
Increasing Demand for Protein-Rich Food; Increasing Demand for Plant-Based and Organic Ingredients.
6. What are the notable trends driving market growth?
OTHER KEY INDUSTRY TRENDS COVERED IN THE REPORT.
7. Are there any restraints impacting market growth?
Presence of Counterfeit Products.
8. Can you provide examples of recent developments in the market?
October 2023: Miss South Africa Natasha Joubert has expanded her business venture by collaborating with the MoFaya energy drink business. Joubert has launched the Berry Queen-flavoured energy drink under the MoFaya energy drink brand.October 2023: Switch Energy Drink introduced 3 new flavors in the African region. The three new limited-edition flavors are Sour Worms, Naartjie & Grape, and Kiwi, Mango & Strawberry.September 2023: Switch Energy Drink launched a special limited-edition flavor in celebration of South African Heritage Day. As a brand deeply rooted in the South African spirit, Switch Energy Drink is excited to contribute to the festivities with this special edition.
9. What pricing options are available for accessing the report?
Pricing options include single-user, multi-user, and enterprise licenses priced at USD 3800, USD 4500, and USD 5800 respectively.
10. Is the market size provided in terms of value or volume?
The market size is provided in terms of value, measured in Million and volume, measured in K Tons.
11. Are there any specific market keywords associated with the report?
Yes, the market keyword associated with the report is "Africa Energy Drinks Market," which aids in identifying and referencing the specific market segment covered.
12. How do I determine which pricing option suits my needs best?
The pricing options vary based on user requirements and access needs. Individual users may opt for single-user licenses, while businesses requiring broader access may choose multi-user or enterprise licenses for cost-effective access to the report.
13. Are there any additional resources or data provided in the Africa Energy Drinks Market report?
While the report offers comprehensive insights, it's advisable to review the specific contents or supplementary materials provided to ascertain if additional resources or data are available.
14. How can I stay updated on further developments or reports in the Africa Energy Drinks Market?
To stay informed about further developments, trends, and reports in the Africa Energy Drinks Market, consider subscribing to industry newsletters, following relevant companies and organizations, or regularly checking reputable industry news sources and publications.
Methodology
Step 1 - Identification of Relevant Samples Size from Population Database


Step 2 - Approaches for Defining Global Market Size (Value, Volume* & Price*)

Note*: In applicable scenarios
Step 3 - Data Sources
Primary Research
- Web Analytics
- Survey Reports
- Research Institute
- Latest Research Reports
- Opinion Leaders
Secondary Research
- Annual Reports
- White Paper
- Latest Press Release
- Industry Association
- Paid Database
- Investor Presentations

Step 4 - Data Triangulation
Involves using different sources of information in order to increase the validity of a study
These sources are likely to be stakeholders in a program - participants, other researchers, program staff, other community members, and so on.
Then we put all data in single framework & apply various statistical tools to find out the dynamic on the market.
During the analysis stage, feedback from the stakeholder groups would be compared to determine areas of agreement as well as areas of divergence


