
Key Insights
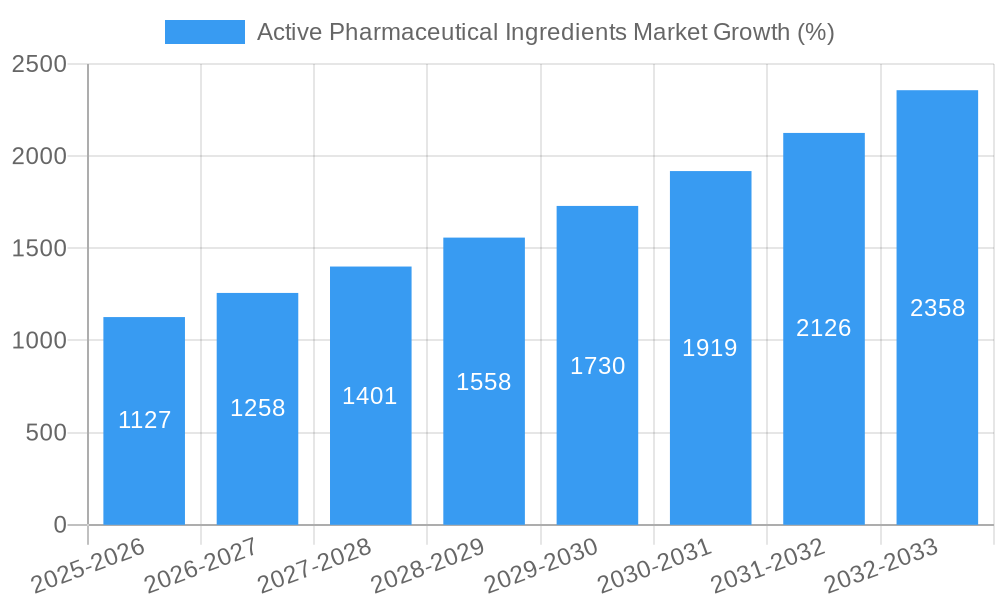
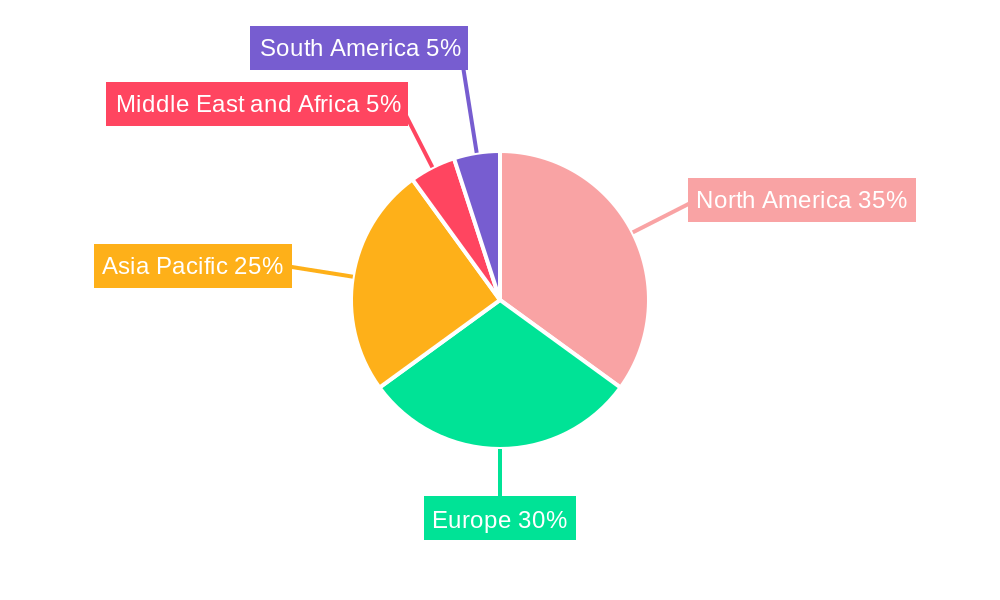
The Active Pharmaceutical Ingredients (API) market, valued at $13.64 billion in 2025, is projected to experience robust growth, driven by a compound annual growth rate (CAGR) of 8.31% from 2025 to 2033. This expansion is fueled by several key factors. The increasing prevalence of chronic diseases globally necessitates a higher demand for pharmaceuticals, directly impacting the API market. Furthermore, the rise in generic drug consumption, particularly in emerging markets, contributes significantly to this growth. Technological advancements in synthetic and biotechnological API synthesis methods are also boosting efficiency and reducing production costs. The market is segmented by synthesis type (synthetic and biotech), drug type (generic and branded), and application (cardiology, oncology, pulmonology, neurology, orthopedics, ophthalmology, and others). Significant regional variations exist, with North America and Europe currently holding substantial market shares due to established pharmaceutical industries and robust regulatory frameworks. However, the Asia-Pacific region is poised for accelerated growth, driven by increasing healthcare spending and a growing population. The competitive landscape includes major pharmaceutical companies such as Boehringer Ingelheim, Novartis, Viatris, Lupin, BASF, Sun Pharmaceutical Industries, Aurobindo Pharma, Sanofi, Dr. Reddy's Laboratories, GlaxoSmithKline, and Pfizer, engaged in both captive and merchant API businesses. Strategic alliances, mergers, and acquisitions are expected to further shape the market landscape in the coming years.
The market's growth is not without challenges. Regulatory hurdles and stringent quality control standards pose significant barriers to entry for new players. Fluctuations in raw material prices and supply chain disruptions can also impact profitability. However, the ongoing research and development efforts focused on innovative drug delivery systems and personalized medicine are expected to create lucrative opportunities for API manufacturers. The increasing focus on biosimilars and the expanding application of APIs in advanced therapies such as gene therapy further contribute to a dynamic and evolving market. The long-term outlook for the API market remains positive, fueled by continuous advancements in pharmaceutical technology, a growing global population, and the rising prevalence of chronic diseases.

Active Pharmaceutical Ingredients (API) Market: A Comprehensive Report (2019-2033)
This detailed report provides a comprehensive analysis of the Active Pharmaceutical Ingredients (API) market, offering invaluable insights for industry stakeholders. With a study period spanning 2019-2033, a base year of 2025, and a forecast period of 2025-2033, this report examines market dynamics, competitive landscapes, and future growth opportunities. The market size is projected to reach xx Million by 2033, exhibiting a CAGR of xx% during the forecast period. This in-depth analysis covers key segments including synthesis type (synthetic, biotech), drug type (generic, branded), application (cardiology, oncology, pulmonology, neurology, orthopedic, ophthalmology, other applications), and business mode (captive API, merchant API).
Active Pharmaceutical Ingredients Market Market Structure & Competitive Dynamics
The Active Pharmaceutical Ingredients (API) market is characterized by a moderately concentrated structure, with several multinational corporations holding significant market share. Key players like Boehringer Ingelheim GmbH, Novartis AG, Viatris Inc, Lupin Ltd, BASF SE, Sun Pharmaceutical Industries Ltd, Aurobindo Pharma, Sanofi Inc, Dr Reddy's Laboratories Ltd, GlaxoSmithKline PLC, and Pfizer Inc compete fiercely, driving innovation and impacting market pricing. Market concentration is estimated at xx%, indicating a degree of oligopolistic competition.
Innovation plays a crucial role, with significant investments in R&D focusing on novel drug delivery systems and advanced synthesis techniques. Regulatory frameworks, particularly those concerning Good Manufacturing Practices (GMP) and environmental regulations, significantly influence operational costs and market entry barriers. The market also witnesses considerable M&A activity, with deal values exceeding xx Million in recent years. For example, the acquisition of Company X by Company Y in 2024 resulted in a xx% increase in market share for the acquiring company. End-user trends, such as the increasing demand for generic APIs and the growing prevalence of chronic diseases, are driving market expansion.
- Market Concentration: xx%
- Average M&A Deal Value: xx Million
- Number of M&A Deals (2019-2024): xx
Active Pharmaceutical Ingredients Market Industry Trends & Insights
The API market is experiencing robust growth, driven by several key factors. The rising prevalence of chronic diseases globally fuels demand for a wide array of pharmaceutical products, consequently increasing the need for APIs. Technological advancements, such as continuous manufacturing and process intensification, are enhancing production efficiency and lowering costs. Consumer preferences are increasingly shifting towards generic drugs, creating significant opportunities in the generic API segment. The market penetration of generic APIs is estimated at xx%, with growth projected to reach xx% by 2033. Furthermore, the increasing adoption of biosimilars and the growing biopharmaceutical industry contribute significantly to the expanding demand for biotech APIs. Competitive dynamics are characterized by price competition, especially in the generic API segment, alongside a push for innovation and differentiation in the branded API market. The global API market exhibits a substantial market value with a projected CAGR of xx% from 2025 to 2033. This growth trajectory is influenced by various factors, including advancements in technology, evolving consumer preferences, and increasing prevalence of chronic ailments that necessitate pharmaceuticals.
Dominant Markets & Segments in Active Pharmaceutical Ingredients Market
The Asia-Pacific region, particularly India and China, holds a dominant position in the API market, driven by favorable government policies, lower manufacturing costs, and a large pool of skilled labor. The synthetic API segment accounts for the largest market share due to its cost-effectiveness and wide applicability. Within drug types, the generic API segment exhibits faster growth due to increasing cost consciousness among consumers and healthcare systems globally. The oncology and cardiology application segments are major revenue generators owing to the high prevalence of related diseases and the associated demand for pharmaceutical treatments. The merchant API business model enjoys a significant share as it facilitates access to APIs for a wider range of pharmaceutical companies.
- Key Drivers for Asia-Pacific Dominance:
- Favorable government policies and incentives (e.g., PLI schemes in India).
- Lower manufacturing costs compared to Western countries.
- Large and skilled workforce.
- Robust infrastructure for API manufacturing.
Active Pharmaceutical Ingredients Market Product Innovations
Recent product innovations focus on improving API synthesis efficiency, enhancing drug delivery systems, and developing novel APIs for emerging therapeutic areas. Continuous flow manufacturing, enabling better process control and yield, is gaining traction. Furthermore, advancements in biocatalysis and bioprocessing are driving innovation in biotech APIs. These innovations are improving the efficacy, safety, and cost-effectiveness of pharmaceutical products, ensuring a better market fit for both generic and branded APIs.
Report Segmentation & Scope
This report segments the API market across several key parameters:
Synthesis Type: Synthetic APIs dominate the market currently due to cost efficiency, but Biotech APIs show strong growth potential. The Synthetic API market is expected to grow to xx Million by 2033, while the Biotech API segment is projected at xx Million by the same year.
Drug Type: The Generic API segment is experiencing faster growth compared to the Branded API segment, driven by pricing pressures and increased affordability requirements. Generic APIs are expected to reach xx Million by 2033, while the branded segment reaches xx Million.
Application: Oncology and Cardiology remain major applications, but growth in other segments like Pulmonology and Neurology is notable. Oncology is projected to reach xx Million by 2033.
Business Mode: Both Captive and Merchant API models have established roles, with merchant models enjoying significant market share due to their accessibility. Merchant APIs are expected to reach xx Million by 2033.
Key Drivers of Active Pharmaceutical Ingredients Market Growth
Several factors are driving API market growth, including the rising prevalence of chronic diseases, technological advancements leading to increased efficiency and reduced production costs, and supportive government policies. The increasing demand for generic drugs and the expansion of the biopharmaceutical industry also contribute to the market’s growth. Favorable regulatory frameworks and increased investments in R&D further propel market expansion.
Challenges in the Active Pharmaceutical Ingredients Market Sector
The API market faces challenges including stringent regulatory hurdles, supply chain disruptions, and price competition, particularly in the generic segment. Intellectual property protection concerns and the increasing complexity of API manufacturing also present significant obstacles. These challenges often result in increased production costs and potential delays in bringing new products to market.
Leading Players in the Active Pharmaceutical Ingredients Market Market
- Boehringer Ingelheim GmbH
- Novartis AG
- Viatris Inc
- Lupin Ltd
- BASF SE
- Sun Pharmaceutical Industries Ltd
- Aurobindo Pharma
- Sanofi Inc
- Dr Reddy's Laboratories Ltd
- GlaxoSmithKline PLC
- Pfizer Inc
Key Developments in Active Pharmaceutical Ingredients Market Sector
- July 2022: Piramal Pharma Limited launched a new API plant in Aurora, Ontario, expanding its CDMO capabilities and increasing API production capacity.
- March 2022: India initiated local manufacturing of 35 APIs under the PLI scheme, reducing dependence on imports from China and boosting domestic production.
Strategic Active Pharmaceutical Ingredients Market Market Outlook
The API market holds significant future potential, driven by continued growth in the pharmaceutical industry, technological innovation, and expanding access to healthcare globally. Strategic opportunities lie in investing in advanced manufacturing technologies, focusing on specialized APIs for emerging therapeutic areas, and strengthening supply chain resilience. Companies prioritizing sustainability and ethical sourcing practices will also gain a competitive advantage.
Active Pharmaceutical Ingredients Market Segmentation
-
1. Business Mode
- 1.1. Captive API
- 1.2. Merchant API
-
2. Synthesis Type
- 2.1. Synthetic
- 2.2. Biotech
-
3. Drug Type
- 3.1. Generic
- 3.2. Branded
-
4. Application
- 4.1. Cardiology
- 4.2. Oncology
- 4.3. Pulmonology
- 4.4. Neurology
- 4.5. Orthopedic
- 4.6. Ophthalmology
- 4.7. Other Applications
Active Pharmaceutical Ingredients Market Segmentation By Geography
-
1. North America
- 1.1. United States
- 1.2. Canada
- 1.3. Mexico
-
2. South America
- 2.1. Brazil
- 2.2. Argentina
- 2.3. Rest of South America
-
3. Europe
- 3.1. United Kingdom
- 3.2. Germany
- 3.3. France
- 3.4. Italy
- 3.5. Spain
- 3.6. Russia
- 3.7. Benelux
- 3.8. Nordics
- 3.9. Rest of Europe
-
4. Middle East & Africa
- 4.1. Turkey
- 4.2. Israel
- 4.3. GCC
- 4.4. North Africa
- 4.5. South Africa
- 4.6. Rest of Middle East & Africa
-
5. Asia Pacific
- 5.1. China
- 5.2. India
- 5.3. Japan
- 5.4. South Korea
- 5.5. ASEAN
- 5.6. Oceania
- 5.7. Rest of Asia Pacific
Active Pharmaceutical Ingredients Market REPORT HIGHLIGHTS
| Aspects | Details |
|---|---|
| Study Period | 2019-2033 |
| Base Year | 2024 |
| Estimated Year | 2025 |
| Forecast Period | 2025-2033 |
| Historical Period | 2019-2024 |
| Growth Rate | CAGR of 8.31% from 2019-2033 |
| Segmentation |
|
Table of Contents
- 1. Introduction
- 1.1. Research Scope
- 1.2. Market Segmentation
- 1.3. Research Methodology
- 1.4. Definitions and Assumptions
- 2. Executive Summary
- 2.1. Introduction
- 3. Market Dynamics
- 3.1. Introduction
- 3.2. Market Drivers
- 3.2.1 Increasing Prevalence of Infectious
- 3.2.2 Genetic
- 3.2.3 Cardiovascular
- 3.2.4 and Other Chronic Disorders; Rising Research & Development Activities of Generic Drugs; Increasing Adoption of Biologicals and Biosimilars
- 3.3. Market Restrains
- 3.3.1. Drug Price Control Policies; Stringent Regulations and Drug Price Policies in the Country
- 3.4. Market Trends
- 3.4.1. Oncology Segment Expects to Register a High CAGR
- 4. Market Factor Analysis
- 4.1. Porters Five Forces
- 4.2. Supply/Value Chain
- 4.3. PESTEL analysis
- 4.4. Market Entropy
- 4.5. Patent/Trademark Analysis
- 5. Global Active Pharmaceutical Ingredients Market Analysis, Insights and Forecast, 2019-2031
- 5.1. Market Analysis, Insights and Forecast - by Business Mode
- 5.1.1. Captive API
- 5.1.2. Merchant API
- 5.2. Market Analysis, Insights and Forecast - by Synthesis Type
- 5.2.1. Synthetic
- 5.2.2. Biotech
- 5.3. Market Analysis, Insights and Forecast - by Drug Type
- 5.3.1. Generic
- 5.3.2. Branded
- 5.4. Market Analysis, Insights and Forecast - by Application
- 5.4.1. Cardiology
- 5.4.2. Oncology
- 5.4.3. Pulmonology
- 5.4.4. Neurology
- 5.4.5. Orthopedic
- 5.4.6. Ophthalmology
- 5.4.7. Other Applications
- 5.5. Market Analysis, Insights and Forecast - by Region
- 5.5.1. North America
- 5.5.2. South America
- 5.5.3. Europe
- 5.5.4. Middle East & Africa
- 5.5.5. Asia Pacific
- 5.1. Market Analysis, Insights and Forecast - by Business Mode
- 6. North America Active Pharmaceutical Ingredients Market Analysis, Insights and Forecast, 2019-2031
- 6.1. Market Analysis, Insights and Forecast - by Business Mode
- 6.1.1. Captive API
- 6.1.2. Merchant API
- 6.2. Market Analysis, Insights and Forecast - by Synthesis Type
- 6.2.1. Synthetic
- 6.2.2. Biotech
- 6.3. Market Analysis, Insights and Forecast - by Drug Type
- 6.3.1. Generic
- 6.3.2. Branded
- 6.4. Market Analysis, Insights and Forecast - by Application
- 6.4.1. Cardiology
- 6.4.2. Oncology
- 6.4.3. Pulmonology
- 6.4.4. Neurology
- 6.4.5. Orthopedic
- 6.4.6. Ophthalmology
- 6.4.7. Other Applications
- 6.1. Market Analysis, Insights and Forecast - by Business Mode
- 7. South America Active Pharmaceutical Ingredients Market Analysis, Insights and Forecast, 2019-2031
- 7.1. Market Analysis, Insights and Forecast - by Business Mode
- 7.1.1. Captive API
- 7.1.2. Merchant API
- 7.2. Market Analysis, Insights and Forecast - by Synthesis Type
- 7.2.1. Synthetic
- 7.2.2. Biotech
- 7.3. Market Analysis, Insights and Forecast - by Drug Type
- 7.3.1. Generic
- 7.3.2. Branded
- 7.4. Market Analysis, Insights and Forecast - by Application
- 7.4.1. Cardiology
- 7.4.2. Oncology
- 7.4.3. Pulmonology
- 7.4.4. Neurology
- 7.4.5. Orthopedic
- 7.4.6. Ophthalmology
- 7.4.7. Other Applications
- 7.1. Market Analysis, Insights and Forecast - by Business Mode
- 8. Europe Active Pharmaceutical Ingredients Market Analysis, Insights and Forecast, 2019-2031
- 8.1. Market Analysis, Insights and Forecast - by Business Mode
- 8.1.1. Captive API
- 8.1.2. Merchant API
- 8.2. Market Analysis, Insights and Forecast - by Synthesis Type
- 8.2.1. Synthetic
- 8.2.2. Biotech
- 8.3. Market Analysis, Insights and Forecast - by Drug Type
- 8.3.1. Generic
- 8.3.2. Branded
- 8.4. Market Analysis, Insights and Forecast - by Application
- 8.4.1. Cardiology
- 8.4.2. Oncology
- 8.4.3. Pulmonology
- 8.4.4. Neurology
- 8.4.5. Orthopedic
- 8.4.6. Ophthalmology
- 8.4.7. Other Applications
- 8.1. Market Analysis, Insights and Forecast - by Business Mode
- 9. Middle East & Africa Active Pharmaceutical Ingredients Market Analysis, Insights and Forecast, 2019-2031
- 9.1. Market Analysis, Insights and Forecast - by Business Mode
- 9.1.1. Captive API
- 9.1.2. Merchant API
- 9.2. Market Analysis, Insights and Forecast - by Synthesis Type
- 9.2.1. Synthetic
- 9.2.2. Biotech
- 9.3. Market Analysis, Insights and Forecast - by Drug Type
- 9.3.1. Generic
- 9.3.2. Branded
- 9.4. Market Analysis, Insights and Forecast - by Application
- 9.4.1. Cardiology
- 9.4.2. Oncology
- 9.4.3. Pulmonology
- 9.4.4. Neurology
- 9.4.5. Orthopedic
- 9.4.6. Ophthalmology
- 9.4.7. Other Applications
- 9.1. Market Analysis, Insights and Forecast - by Business Mode
- 10. Asia Pacific Active Pharmaceutical Ingredients Market Analysis, Insights and Forecast, 2019-2031
- 10.1. Market Analysis, Insights and Forecast - by Business Mode
- 10.1.1. Captive API
- 10.1.2. Merchant API
- 10.2. Market Analysis, Insights and Forecast - by Synthesis Type
- 10.2.1. Synthetic
- 10.2.2. Biotech
- 10.3. Market Analysis, Insights and Forecast - by Drug Type
- 10.3.1. Generic
- 10.3.2. Branded
- 10.4. Market Analysis, Insights and Forecast - by Application
- 10.4.1. Cardiology
- 10.4.2. Oncology
- 10.4.3. Pulmonology
- 10.4.4. Neurology
- 10.4.5. Orthopedic
- 10.4.6. Ophthalmology
- 10.4.7. Other Applications
- 10.1. Market Analysis, Insights and Forecast - by Business Mode
- 11. North America Active Pharmaceutical Ingredients Market Analysis, Insights and Forecast, 2019-2031
- 11.1. Market Analysis, Insights and Forecast - By Country/Sub-region
- 11.1.1. undefined
- 12. Europe Active Pharmaceutical Ingredients Market Analysis, Insights and Forecast, 2019-2031
- 12.1. Market Analysis, Insights and Forecast - By Country/Sub-region
- 12.1.1. undefined
- 13. Asia Pacific Active Pharmaceutical Ingredients Market Analysis, Insights and Forecast, 2019-2031
- 13.1. Market Analysis, Insights and Forecast - By Country/Sub-region
- 13.1.1. undefined
- 14. Middle East and Africa Active Pharmaceutical Ingredients Market Analysis, Insights and Forecast, 2019-2031
- 14.1. Market Analysis, Insights and Forecast - By Country/Sub-region
- 14.1.1. undefined
- 15. South America Active Pharmaceutical Ingredients Market Analysis, Insights and Forecast, 2019-2031
- 15.1. Market Analysis, Insights and Forecast - By Country/Sub-region
- 15.1.1. undefined
- 16. Competitive Analysis
- 16.1. Global Market Share Analysis 2024
- 16.2. Company Profiles
- 16.2.1 Boehringer Ingelheim GmbH
- 16.2.1.1. Overview
- 16.2.1.2. Products
- 16.2.1.3. SWOT Analysis
- 16.2.1.4. Recent Developments
- 16.2.1.5. Financials (Based on Availability)
- 16.2.2 Novartis AG
- 16.2.2.1. Overview
- 16.2.2.2. Products
- 16.2.2.3. SWOT Analysis
- 16.2.2.4. Recent Developments
- 16.2.2.5. Financials (Based on Availability)
- 16.2.3 Viatris Inc
- 16.2.3.1. Overview
- 16.2.3.2. Products
- 16.2.3.3. SWOT Analysis
- 16.2.3.4. Recent Developments
- 16.2.3.5. Financials (Based on Availability)
- 16.2.4 Lupin Ltd
- 16.2.4.1. Overview
- 16.2.4.2. Products
- 16.2.4.3. SWOT Analysis
- 16.2.4.4. Recent Developments
- 16.2.4.5. Financials (Based on Availability)
- 16.2.5 BASF SE
- 16.2.5.1. Overview
- 16.2.5.2. Products
- 16.2.5.3. SWOT Analysis
- 16.2.5.4. Recent Developments
- 16.2.5.5. Financials (Based on Availability)
- 16.2.6 Sun Pharmaceutical Industries Ltd
- 16.2.6.1. Overview
- 16.2.6.2. Products
- 16.2.6.3. SWOT Analysis
- 16.2.6.4. Recent Developments
- 16.2.6.5. Financials (Based on Availability)
- 16.2.7 Aurobindo Pharma
- 16.2.7.1. Overview
- 16.2.7.2. Products
- 16.2.7.3. SWOT Analysis
- 16.2.7.4. Recent Developments
- 16.2.7.5. Financials (Based on Availability)
- 16.2.8 Sanofi Inc
- 16.2.8.1. Overview
- 16.2.8.2. Products
- 16.2.8.3. SWOT Analysis
- 16.2.8.4. Recent Developments
- 16.2.8.5. Financials (Based on Availability)
- 16.2.9 Dr Reddy's Laboratories Ltd
- 16.2.9.1. Overview
- 16.2.9.2. Products
- 16.2.9.3. SWOT Analysis
- 16.2.9.4. Recent Developments
- 16.2.9.5. Financials (Based on Availability)
- 16.2.10 GlaxoSmithKline PLC
- 16.2.10.1. Overview
- 16.2.10.2. Products
- 16.2.10.3. SWOT Analysis
- 16.2.10.4. Recent Developments
- 16.2.10.5. Financials (Based on Availability)
- 16.2.11 Pfizer Inc
- 16.2.11.1. Overview
- 16.2.11.2. Products
- 16.2.11.3. SWOT Analysis
- 16.2.11.4. Recent Developments
- 16.2.11.5. Financials (Based on Availability)
- 16.2.1 Boehringer Ingelheim GmbH
List of Figures
- Figure 1: Global Active Pharmaceutical Ingredients Market Revenue Breakdown (Million, %) by Region 2024 & 2032
- Figure 2: Global Active Pharmaceutical Ingredients Market Volume Breakdown (k unit , %) by Region 2024 & 2032
- Figure 3: North America Active Pharmaceutical Ingredients Market Revenue (Million), by Country 2024 & 2032
- Figure 4: North America Active Pharmaceutical Ingredients Market Volume (k unit ), by Country 2024 & 2032
- Figure 5: North America Active Pharmaceutical Ingredients Market Revenue Share (%), by Country 2024 & 2032
- Figure 6: North America Active Pharmaceutical Ingredients Market Volume Share (%), by Country 2024 & 2032
- Figure 7: Europe Active Pharmaceutical Ingredients Market Revenue (Million), by Country 2024 & 2032
- Figure 8: Europe Active Pharmaceutical Ingredients Market Volume (k unit ), by Country 2024 & 2032
- Figure 9: Europe Active Pharmaceutical Ingredients Market Revenue Share (%), by Country 2024 & 2032
- Figure 10: Europe Active Pharmaceutical Ingredients Market Volume Share (%), by Country 2024 & 2032
- Figure 11: Asia Pacific Active Pharmaceutical Ingredients Market Revenue (Million), by Country 2024 & 2032
- Figure 12: Asia Pacific Active Pharmaceutical Ingredients Market Volume (k unit ), by Country 2024 & 2032
- Figure 13: Asia Pacific Active Pharmaceutical Ingredients Market Revenue Share (%), by Country 2024 & 2032
- Figure 14: Asia Pacific Active Pharmaceutical Ingredients Market Volume Share (%), by Country 2024 & 2032
- Figure 15: Middle East and Africa Active Pharmaceutical Ingredients Market Revenue (Million), by Country 2024 & 2032
- Figure 16: Middle East and Africa Active Pharmaceutical Ingredients Market Volume (k unit ), by Country 2024 & 2032
- Figure 17: Middle East and Africa Active Pharmaceutical Ingredients Market Revenue Share (%), by Country 2024 & 2032
- Figure 18: Middle East and Africa Active Pharmaceutical Ingredients Market Volume Share (%), by Country 2024 & 2032
- Figure 19: South America Active Pharmaceutical Ingredients Market Revenue (Million), by Country 2024 & 2032
- Figure 20: South America Active Pharmaceutical Ingredients Market Volume (k unit ), by Country 2024 & 2032
- Figure 21: South America Active Pharmaceutical Ingredients Market Revenue Share (%), by Country 2024 & 2032
- Figure 22: South America Active Pharmaceutical Ingredients Market Volume Share (%), by Country 2024 & 2032
- Figure 23: North America Active Pharmaceutical Ingredients Market Revenue (Million), by Business Mode 2024 & 2032
- Figure 24: North America Active Pharmaceutical Ingredients Market Volume (k unit ), by Business Mode 2024 & 2032
- Figure 25: North America Active Pharmaceutical Ingredients Market Revenue Share (%), by Business Mode 2024 & 2032
- Figure 26: North America Active Pharmaceutical Ingredients Market Volume Share (%), by Business Mode 2024 & 2032
- Figure 27: North America Active Pharmaceutical Ingredients Market Revenue (Million), by Synthesis Type 2024 & 2032
- Figure 28: North America Active Pharmaceutical Ingredients Market Volume (k unit ), by Synthesis Type 2024 & 2032
- Figure 29: North America Active Pharmaceutical Ingredients Market Revenue Share (%), by Synthesis Type 2024 & 2032
- Figure 30: North America Active Pharmaceutical Ingredients Market Volume Share (%), by Synthesis Type 2024 & 2032
- Figure 31: North America Active Pharmaceutical Ingredients Market Revenue (Million), by Drug Type 2024 & 2032
- Figure 32: North America Active Pharmaceutical Ingredients Market Volume (k unit ), by Drug Type 2024 & 2032
- Figure 33: North America Active Pharmaceutical Ingredients Market Revenue Share (%), by Drug Type 2024 & 2032
- Figure 34: North America Active Pharmaceutical Ingredients Market Volume Share (%), by Drug Type 2024 & 2032
- Figure 35: North America Active Pharmaceutical Ingredients Market Revenue (Million), by Application 2024 & 2032
- Figure 36: North America Active Pharmaceutical Ingredients Market Volume (k unit ), by Application 2024 & 2032
- Figure 37: North America Active Pharmaceutical Ingredients Market Revenue Share (%), by Application 2024 & 2032
- Figure 38: North America Active Pharmaceutical Ingredients Market Volume Share (%), by Application 2024 & 2032
- Figure 39: North America Active Pharmaceutical Ingredients Market Revenue (Million), by Country 2024 & 2032
- Figure 40: North America Active Pharmaceutical Ingredients Market Volume (k unit ), by Country 2024 & 2032
- Figure 41: North America Active Pharmaceutical Ingredients Market Revenue Share (%), by Country 2024 & 2032
- Figure 42: North America Active Pharmaceutical Ingredients Market Volume Share (%), by Country 2024 & 2032
- Figure 43: South America Active Pharmaceutical Ingredients Market Revenue (Million), by Business Mode 2024 & 2032
- Figure 44: South America Active Pharmaceutical Ingredients Market Volume (k unit ), by Business Mode 2024 & 2032
- Figure 45: South America Active Pharmaceutical Ingredients Market Revenue Share (%), by Business Mode 2024 & 2032
- Figure 46: South America Active Pharmaceutical Ingredients Market Volume Share (%), by Business Mode 2024 & 2032
- Figure 47: South America Active Pharmaceutical Ingredients Market Revenue (Million), by Synthesis Type 2024 & 2032
- Figure 48: South America Active Pharmaceutical Ingredients Market Volume (k unit ), by Synthesis Type 2024 & 2032
- Figure 49: South America Active Pharmaceutical Ingredients Market Revenue Share (%), by Synthesis Type 2024 & 2032
- Figure 50: South America Active Pharmaceutical Ingredients Market Volume Share (%), by Synthesis Type 2024 & 2032
- Figure 51: South America Active Pharmaceutical Ingredients Market Revenue (Million), by Drug Type 2024 & 2032
- Figure 52: South America Active Pharmaceutical Ingredients Market Volume (k unit ), by Drug Type 2024 & 2032
- Figure 53: South America Active Pharmaceutical Ingredients Market Revenue Share (%), by Drug Type 2024 & 2032
- Figure 54: South America Active Pharmaceutical Ingredients Market Volume Share (%), by Drug Type 2024 & 2032
- Figure 55: South America Active Pharmaceutical Ingredients Market Revenue (Million), by Application 2024 & 2032
- Figure 56: South America Active Pharmaceutical Ingredients Market Volume (k unit ), by Application 2024 & 2032
- Figure 57: South America Active Pharmaceutical Ingredients Market Revenue Share (%), by Application 2024 & 2032
- Figure 58: South America Active Pharmaceutical Ingredients Market Volume Share (%), by Application 2024 & 2032
- Figure 59: South America Active Pharmaceutical Ingredients Market Revenue (Million), by Country 2024 & 2032
- Figure 60: South America Active Pharmaceutical Ingredients Market Volume (k unit ), by Country 2024 & 2032
- Figure 61: South America Active Pharmaceutical Ingredients Market Revenue Share (%), by Country 2024 & 2032
- Figure 62: South America Active Pharmaceutical Ingredients Market Volume Share (%), by Country 2024 & 2032
- Figure 63: Europe Active Pharmaceutical Ingredients Market Revenue (Million), by Business Mode 2024 & 2032
- Figure 64: Europe Active Pharmaceutical Ingredients Market Volume (k unit ), by Business Mode 2024 & 2032
- Figure 65: Europe Active Pharmaceutical Ingredients Market Revenue Share (%), by Business Mode 2024 & 2032
- Figure 66: Europe Active Pharmaceutical Ingredients Market Volume Share (%), by Business Mode 2024 & 2032
- Figure 67: Europe Active Pharmaceutical Ingredients Market Revenue (Million), by Synthesis Type 2024 & 2032
- Figure 68: Europe Active Pharmaceutical Ingredients Market Volume (k unit ), by Synthesis Type 2024 & 2032
- Figure 69: Europe Active Pharmaceutical Ingredients Market Revenue Share (%), by Synthesis Type 2024 & 2032
- Figure 70: Europe Active Pharmaceutical Ingredients Market Volume Share (%), by Synthesis Type 2024 & 2032
- Figure 71: Europe Active Pharmaceutical Ingredients Market Revenue (Million), by Drug Type 2024 & 2032
- Figure 72: Europe Active Pharmaceutical Ingredients Market Volume (k unit ), by Drug Type 2024 & 2032
- Figure 73: Europe Active Pharmaceutical Ingredients Market Revenue Share (%), by Drug Type 2024 & 2032
- Figure 74: Europe Active Pharmaceutical Ingredients Market Volume Share (%), by Drug Type 2024 & 2032
- Figure 75: Europe Active Pharmaceutical Ingredients Market Revenue (Million), by Application 2024 & 2032
- Figure 76: Europe Active Pharmaceutical Ingredients Market Volume (k unit ), by Application 2024 & 2032
- Figure 77: Europe Active Pharmaceutical Ingredients Market Revenue Share (%), by Application 2024 & 2032
- Figure 78: Europe Active Pharmaceutical Ingredients Market Volume Share (%), by Application 2024 & 2032
- Figure 79: Europe Active Pharmaceutical Ingredients Market Revenue (Million), by Country 2024 & 2032
- Figure 80: Europe Active Pharmaceutical Ingredients Market Volume (k unit ), by Country 2024 & 2032
- Figure 81: Europe Active Pharmaceutical Ingredients Market Revenue Share (%), by Country 2024 & 2032
- Figure 82: Europe Active Pharmaceutical Ingredients Market Volume Share (%), by Country 2024 & 2032
- Figure 83: Middle East & Africa Active Pharmaceutical Ingredients Market Revenue (Million), by Business Mode 2024 & 2032
- Figure 84: Middle East & Africa Active Pharmaceutical Ingredients Market Volume (k unit ), by Business Mode 2024 & 2032
- Figure 85: Middle East & Africa Active Pharmaceutical Ingredients Market Revenue Share (%), by Business Mode 2024 & 2032
- Figure 86: Middle East & Africa Active Pharmaceutical Ingredients Market Volume Share (%), by Business Mode 2024 & 2032
- Figure 87: Middle East & Africa Active Pharmaceutical Ingredients Market Revenue (Million), by Synthesis Type 2024 & 2032
- Figure 88: Middle East & Africa Active Pharmaceutical Ingredients Market Volume (k unit ), by Synthesis Type 2024 & 2032
- Figure 89: Middle East & Africa Active Pharmaceutical Ingredients Market Revenue Share (%), by Synthesis Type 2024 & 2032
- Figure 90: Middle East & Africa Active Pharmaceutical Ingredients Market Volume Share (%), by Synthesis Type 2024 & 2032
- Figure 91: Middle East & Africa Active Pharmaceutical Ingredients Market Revenue (Million), by Drug Type 2024 & 2032
- Figure 92: Middle East & Africa Active Pharmaceutical Ingredients Market Volume (k unit ), by Drug Type 2024 & 2032
- Figure 93: Middle East & Africa Active Pharmaceutical Ingredients Market Revenue Share (%), by Drug Type 2024 & 2032
- Figure 94: Middle East & Africa Active Pharmaceutical Ingredients Market Volume Share (%), by Drug Type 2024 & 2032
- Figure 95: Middle East & Africa Active Pharmaceutical Ingredients Market Revenue (Million), by Application 2024 & 2032
- Figure 96: Middle East & Africa Active Pharmaceutical Ingredients Market Volume (k unit ), by Application 2024 & 2032
- Figure 97: Middle East & Africa Active Pharmaceutical Ingredients Market Revenue Share (%), by Application 2024 & 2032
- Figure 98: Middle East & Africa Active Pharmaceutical Ingredients Market Volume Share (%), by Application 2024 & 2032
- Figure 99: Middle East & Africa Active Pharmaceutical Ingredients Market Revenue (Million), by Country 2024 & 2032
- Figure 100: Middle East & Africa Active Pharmaceutical Ingredients Market Volume (k unit ), by Country 2024 & 2032
- Figure 101: Middle East & Africa Active Pharmaceutical Ingredients Market Revenue Share (%), by Country 2024 & 2032
- Figure 102: Middle East & Africa Active Pharmaceutical Ingredients Market Volume Share (%), by Country 2024 & 2032
- Figure 103: Asia Pacific Active Pharmaceutical Ingredients Market Revenue (Million), by Business Mode 2024 & 2032
- Figure 104: Asia Pacific Active Pharmaceutical Ingredients Market Volume (k unit ), by Business Mode 2024 & 2032
- Figure 105: Asia Pacific Active Pharmaceutical Ingredients Market Revenue Share (%), by Business Mode 2024 & 2032
- Figure 106: Asia Pacific Active Pharmaceutical Ingredients Market Volume Share (%), by Business Mode 2024 & 2032
- Figure 107: Asia Pacific Active Pharmaceutical Ingredients Market Revenue (Million), by Synthesis Type 2024 & 2032
- Figure 108: Asia Pacific Active Pharmaceutical Ingredients Market Volume (k unit ), by Synthesis Type 2024 & 2032
- Figure 109: Asia Pacific Active Pharmaceutical Ingredients Market Revenue Share (%), by Synthesis Type 2024 & 2032
- Figure 110: Asia Pacific Active Pharmaceutical Ingredients Market Volume Share (%), by Synthesis Type 2024 & 2032
- Figure 111: Asia Pacific Active Pharmaceutical Ingredients Market Revenue (Million), by Drug Type 2024 & 2032
- Figure 112: Asia Pacific Active Pharmaceutical Ingredients Market Volume (k unit ), by Drug Type 2024 & 2032
- Figure 113: Asia Pacific Active Pharmaceutical Ingredients Market Revenue Share (%), by Drug Type 2024 & 2032
- Figure 114: Asia Pacific Active Pharmaceutical Ingredients Market Volume Share (%), by Drug Type 2024 & 2032
- Figure 115: Asia Pacific Active Pharmaceutical Ingredients Market Revenue (Million), by Application 2024 & 2032
- Figure 116: Asia Pacific Active Pharmaceutical Ingredients Market Volume (k unit ), by Application 2024 & 2032
- Figure 117: Asia Pacific Active Pharmaceutical Ingredients Market Revenue Share (%), by Application 2024 & 2032
- Figure 118: Asia Pacific Active Pharmaceutical Ingredients Market Volume Share (%), by Application 2024 & 2032
- Figure 119: Asia Pacific Active Pharmaceutical Ingredients Market Revenue (Million), by Country 2024 & 2032
- Figure 120: Asia Pacific Active Pharmaceutical Ingredients Market Volume (k unit ), by Country 2024 & 2032
- Figure 121: Asia Pacific Active Pharmaceutical Ingredients Market Revenue Share (%), by Country 2024 & 2032
- Figure 122: Asia Pacific Active Pharmaceutical Ingredients Market Volume Share (%), by Country 2024 & 2032
List of Tables
- Table 1: Global Active Pharmaceutical Ingredients Market Revenue Million Forecast, by Region 2019 & 2032
- Table 2: Global Active Pharmaceutical Ingredients Market Volume k unit Forecast, by Region 2019 & 2032
- Table 3: Global Active Pharmaceutical Ingredients Market Revenue Million Forecast, by Business Mode 2019 & 2032
- Table 4: Global Active Pharmaceutical Ingredients Market Volume k unit Forecast, by Business Mode 2019 & 2032
- Table 5: Global Active Pharmaceutical Ingredients Market Revenue Million Forecast, by Synthesis Type 2019 & 2032
- Table 6: Global Active Pharmaceutical Ingredients Market Volume k unit Forecast, by Synthesis Type 2019 & 2032
- Table 7: Global Active Pharmaceutical Ingredients Market Revenue Million Forecast, by Drug Type 2019 & 2032
- Table 8: Global Active Pharmaceutical Ingredients Market Volume k unit Forecast, by Drug Type 2019 & 2032
- Table 9: Global Active Pharmaceutical Ingredients Market Revenue Million Forecast, by Application 2019 & 2032
- Table 10: Global Active Pharmaceutical Ingredients Market Volume k unit Forecast, by Application 2019 & 2032
- Table 11: Global Active Pharmaceutical Ingredients Market Revenue Million Forecast, by Region 2019 & 2032
- Table 12: Global Active Pharmaceutical Ingredients Market Volume k unit Forecast, by Region 2019 & 2032
- Table 13: Global Active Pharmaceutical Ingredients Market Revenue Million Forecast, by Country 2019 & 2032
- Table 14: Global Active Pharmaceutical Ingredients Market Volume k unit Forecast, by Country 2019 & 2032
- Table 15: Global Active Pharmaceutical Ingredients Market Revenue Million Forecast, by Country 2019 & 2032
- Table 16: Global Active Pharmaceutical Ingredients Market Volume k unit Forecast, by Country 2019 & 2032
- Table 17: Global Active Pharmaceutical Ingredients Market Revenue Million Forecast, by Country 2019 & 2032
- Table 18: Global Active Pharmaceutical Ingredients Market Volume k unit Forecast, by Country 2019 & 2032
- Table 19: Global Active Pharmaceutical Ingredients Market Revenue Million Forecast, by Country 2019 & 2032
- Table 20: Global Active Pharmaceutical Ingredients Market Volume k unit Forecast, by Country 2019 & 2032
- Table 21: Global Active Pharmaceutical Ingredients Market Revenue Million Forecast, by Country 2019 & 2032
- Table 22: Global Active Pharmaceutical Ingredients Market Volume k unit Forecast, by Country 2019 & 2032
- Table 23: Global Active Pharmaceutical Ingredients Market Revenue Million Forecast, by Business Mode 2019 & 2032
- Table 24: Global Active Pharmaceutical Ingredients Market Volume k unit Forecast, by Business Mode 2019 & 2032
- Table 25: Global Active Pharmaceutical Ingredients Market Revenue Million Forecast, by Synthesis Type 2019 & 2032
- Table 26: Global Active Pharmaceutical Ingredients Market Volume k unit Forecast, by Synthesis Type 2019 & 2032
- Table 27: Global Active Pharmaceutical Ingredients Market Revenue Million Forecast, by Drug Type 2019 & 2032
- Table 28: Global Active Pharmaceutical Ingredients Market Volume k unit Forecast, by Drug Type 2019 & 2032
- Table 29: Global Active Pharmaceutical Ingredients Market Revenue Million Forecast, by Application 2019 & 2032
- Table 30: Global Active Pharmaceutical Ingredients Market Volume k unit Forecast, by Application 2019 & 2032
- Table 31: Global Active Pharmaceutical Ingredients Market Revenue Million Forecast, by Country 2019 & 2032
- Table 32: Global Active Pharmaceutical Ingredients Market Volume k unit Forecast, by Country 2019 & 2032
- Table 33: United States Active Pharmaceutical Ingredients Market Revenue (Million) Forecast, by Application 2019 & 2032
- Table 34: United States Active Pharmaceutical Ingredients Market Volume (k unit ) Forecast, by Application 2019 & 2032
- Table 35: Canada Active Pharmaceutical Ingredients Market Revenue (Million) Forecast, by Application 2019 & 2032
- Table 36: Canada Active Pharmaceutical Ingredients Market Volume (k unit ) Forecast, by Application 2019 & 2032
- Table 37: Mexico Active Pharmaceutical Ingredients Market Revenue (Million) Forecast, by Application 2019 & 2032
- Table 38: Mexico Active Pharmaceutical Ingredients Market Volume (k unit ) Forecast, by Application 2019 & 2032
- Table 39: Global Active Pharmaceutical Ingredients Market Revenue Million Forecast, by Business Mode 2019 & 2032
- Table 40: Global Active Pharmaceutical Ingredients Market Volume k unit Forecast, by Business Mode 2019 & 2032
- Table 41: Global Active Pharmaceutical Ingredients Market Revenue Million Forecast, by Synthesis Type 2019 & 2032
- Table 42: Global Active Pharmaceutical Ingredients Market Volume k unit Forecast, by Synthesis Type 2019 & 2032
- Table 43: Global Active Pharmaceutical Ingredients Market Revenue Million Forecast, by Drug Type 2019 & 2032
- Table 44: Global Active Pharmaceutical Ingredients Market Volume k unit Forecast, by Drug Type 2019 & 2032
- Table 45: Global Active Pharmaceutical Ingredients Market Revenue Million Forecast, by Application 2019 & 2032
- Table 46: Global Active Pharmaceutical Ingredients Market Volume k unit Forecast, by Application 2019 & 2032
- Table 47: Global Active Pharmaceutical Ingredients Market Revenue Million Forecast, by Country 2019 & 2032
- Table 48: Global Active Pharmaceutical Ingredients Market Volume k unit Forecast, by Country 2019 & 2032
- Table 49: Brazil Active Pharmaceutical Ingredients Market Revenue (Million) Forecast, by Application 2019 & 2032
- Table 50: Brazil Active Pharmaceutical Ingredients Market Volume (k unit ) Forecast, by Application 2019 & 2032
- Table 51: Argentina Active Pharmaceutical Ingredients Market Revenue (Million) Forecast, by Application 2019 & 2032
- Table 52: Argentina Active Pharmaceutical Ingredients Market Volume (k unit ) Forecast, by Application 2019 & 2032
- Table 53: Rest of South America Active Pharmaceutical Ingredients Market Revenue (Million) Forecast, by Application 2019 & 2032
- Table 54: Rest of South America Active Pharmaceutical Ingredients Market Volume (k unit ) Forecast, by Application 2019 & 2032
- Table 55: Global Active Pharmaceutical Ingredients Market Revenue Million Forecast, by Business Mode 2019 & 2032
- Table 56: Global Active Pharmaceutical Ingredients Market Volume k unit Forecast, by Business Mode 2019 & 2032
- Table 57: Global Active Pharmaceutical Ingredients Market Revenue Million Forecast, by Synthesis Type 2019 & 2032
- Table 58: Global Active Pharmaceutical Ingredients Market Volume k unit Forecast, by Synthesis Type 2019 & 2032
- Table 59: Global Active Pharmaceutical Ingredients Market Revenue Million Forecast, by Drug Type 2019 & 2032
- Table 60: Global Active Pharmaceutical Ingredients Market Volume k unit Forecast, by Drug Type 2019 & 2032
- Table 61: Global Active Pharmaceutical Ingredients Market Revenue Million Forecast, by Application 2019 & 2032
- Table 62: Global Active Pharmaceutical Ingredients Market Volume k unit Forecast, by Application 2019 & 2032
- Table 63: Global Active Pharmaceutical Ingredients Market Revenue Million Forecast, by Country 2019 & 2032
- Table 64: Global Active Pharmaceutical Ingredients Market Volume k unit Forecast, by Country 2019 & 2032
- Table 65: United Kingdom Active Pharmaceutical Ingredients Market Revenue (Million) Forecast, by Application 2019 & 2032
- Table 66: United Kingdom Active Pharmaceutical Ingredients Market Volume (k unit ) Forecast, by Application 2019 & 2032
- Table 67: Germany Active Pharmaceutical Ingredients Market Revenue (Million) Forecast, by Application 2019 & 2032
- Table 68: Germany Active Pharmaceutical Ingredients Market Volume (k unit ) Forecast, by Application 2019 & 2032
- Table 69: France Active Pharmaceutical Ingredients Market Revenue (Million) Forecast, by Application 2019 & 2032
- Table 70: France Active Pharmaceutical Ingredients Market Volume (k unit ) Forecast, by Application 2019 & 2032
- Table 71: Italy Active Pharmaceutical Ingredients Market Revenue (Million) Forecast, by Application 2019 & 2032
- Table 72: Italy Active Pharmaceutical Ingredients Market Volume (k unit ) Forecast, by Application 2019 & 2032
- Table 73: Spain Active Pharmaceutical Ingredients Market Revenue (Million) Forecast, by Application 2019 & 2032
- Table 74: Spain Active Pharmaceutical Ingredients Market Volume (k unit ) Forecast, by Application 2019 & 2032
- Table 75: Russia Active Pharmaceutical Ingredients Market Revenue (Million) Forecast, by Application 2019 & 2032
- Table 76: Russia Active Pharmaceutical Ingredients Market Volume (k unit ) Forecast, by Application 2019 & 2032
- Table 77: Benelux Active Pharmaceutical Ingredients Market Revenue (Million) Forecast, by Application 2019 & 2032
- Table 78: Benelux Active Pharmaceutical Ingredients Market Volume (k unit ) Forecast, by Application 2019 & 2032
- Table 79: Nordics Active Pharmaceutical Ingredients Market Revenue (Million) Forecast, by Application 2019 & 2032
- Table 80: Nordics Active Pharmaceutical Ingredients Market Volume (k unit ) Forecast, by Application 2019 & 2032
- Table 81: Rest of Europe Active Pharmaceutical Ingredients Market Revenue (Million) Forecast, by Application 2019 & 2032
- Table 82: Rest of Europe Active Pharmaceutical Ingredients Market Volume (k unit ) Forecast, by Application 2019 & 2032
- Table 83: Global Active Pharmaceutical Ingredients Market Revenue Million Forecast, by Business Mode 2019 & 2032
- Table 84: Global Active Pharmaceutical Ingredients Market Volume k unit Forecast, by Business Mode 2019 & 2032
- Table 85: Global Active Pharmaceutical Ingredients Market Revenue Million Forecast, by Synthesis Type 2019 & 2032
- Table 86: Global Active Pharmaceutical Ingredients Market Volume k unit Forecast, by Synthesis Type 2019 & 2032
- Table 87: Global Active Pharmaceutical Ingredients Market Revenue Million Forecast, by Drug Type 2019 & 2032
- Table 88: Global Active Pharmaceutical Ingredients Market Volume k unit Forecast, by Drug Type 2019 & 2032
- Table 89: Global Active Pharmaceutical Ingredients Market Revenue Million Forecast, by Application 2019 & 2032
- Table 90: Global Active Pharmaceutical Ingredients Market Volume k unit Forecast, by Application 2019 & 2032
- Table 91: Global Active Pharmaceutical Ingredients Market Revenue Million Forecast, by Country 2019 & 2032
- Table 92: Global Active Pharmaceutical Ingredients Market Volume k unit Forecast, by Country 2019 & 2032
- Table 93: Turkey Active Pharmaceutical Ingredients Market Revenue (Million) Forecast, by Application 2019 & 2032
- Table 94: Turkey Active Pharmaceutical Ingredients Market Volume (k unit ) Forecast, by Application 2019 & 2032
- Table 95: Israel Active Pharmaceutical Ingredients Market Revenue (Million) Forecast, by Application 2019 & 2032
- Table 96: Israel Active Pharmaceutical Ingredients Market Volume (k unit ) Forecast, by Application 2019 & 2032
- Table 97: GCC Active Pharmaceutical Ingredients Market Revenue (Million) Forecast, by Application 2019 & 2032
- Table 98: GCC Active Pharmaceutical Ingredients Market Volume (k unit ) Forecast, by Application 2019 & 2032
- Table 99: North Africa Active Pharmaceutical Ingredients Market Revenue (Million) Forecast, by Application 2019 & 2032
- Table 100: North Africa Active Pharmaceutical Ingredients Market Volume (k unit ) Forecast, by Application 2019 & 2032
- Table 101: South Africa Active Pharmaceutical Ingredients Market Revenue (Million) Forecast, by Application 2019 & 2032
- Table 102: South Africa Active Pharmaceutical Ingredients Market Volume (k unit ) Forecast, by Application 2019 & 2032
- Table 103: Rest of Middle East & Africa Active Pharmaceutical Ingredients Market Revenue (Million) Forecast, by Application 2019 & 2032
- Table 104: Rest of Middle East & Africa Active Pharmaceutical Ingredients Market Volume (k unit ) Forecast, by Application 2019 & 2032
- Table 105: Global Active Pharmaceutical Ingredients Market Revenue Million Forecast, by Business Mode 2019 & 2032
- Table 106: Global Active Pharmaceutical Ingredients Market Volume k unit Forecast, by Business Mode 2019 & 2032
- Table 107: Global Active Pharmaceutical Ingredients Market Revenue Million Forecast, by Synthesis Type 2019 & 2032
- Table 108: Global Active Pharmaceutical Ingredients Market Volume k unit Forecast, by Synthesis Type 2019 & 2032
- Table 109: Global Active Pharmaceutical Ingredients Market Revenue Million Forecast, by Drug Type 2019 & 2032
- Table 110: Global Active Pharmaceutical Ingredients Market Volume k unit Forecast, by Drug Type 2019 & 2032
- Table 111: Global Active Pharmaceutical Ingredients Market Revenue Million Forecast, by Application 2019 & 2032
- Table 112: Global Active Pharmaceutical Ingredients Market Volume k unit Forecast, by Application 2019 & 2032
- Table 113: Global Active Pharmaceutical Ingredients Market Revenue Million Forecast, by Country 2019 & 2032
- Table 114: Global Active Pharmaceutical Ingredients Market Volume k unit Forecast, by Country 2019 & 2032
- Table 115: China Active Pharmaceutical Ingredients Market Revenue (Million) Forecast, by Application 2019 & 2032
- Table 116: China Active Pharmaceutical Ingredients Market Volume (k unit ) Forecast, by Application 2019 & 2032
- Table 117: India Active Pharmaceutical Ingredients Market Revenue (Million) Forecast, by Application 2019 & 2032
- Table 118: India Active Pharmaceutical Ingredients Market Volume (k unit ) Forecast, by Application 2019 & 2032
- Table 119: Japan Active Pharmaceutical Ingredients Market Revenue (Million) Forecast, by Application 2019 & 2032
- Table 120: Japan Active Pharmaceutical Ingredients Market Volume (k unit ) Forecast, by Application 2019 & 2032
- Table 121: South Korea Active Pharmaceutical Ingredients Market Revenue (Million) Forecast, by Application 2019 & 2032
- Table 122: South Korea Active Pharmaceutical Ingredients Market Volume (k unit ) Forecast, by Application 2019 & 2032
- Table 123: ASEAN Active Pharmaceutical Ingredients Market Revenue (Million) Forecast, by Application 2019 & 2032
- Table 124: ASEAN Active Pharmaceutical Ingredients Market Volume (k unit ) Forecast, by Application 2019 & 2032
- Table 125: Oceania Active Pharmaceutical Ingredients Market Revenue (Million) Forecast, by Application 2019 & 2032
- Table 126: Oceania Active Pharmaceutical Ingredients Market Volume (k unit ) Forecast, by Application 2019 & 2032
- Table 127: Rest of Asia Pacific Active Pharmaceutical Ingredients Market Revenue (Million) Forecast, by Application 2019 & 2032
- Table 128: Rest of Asia Pacific Active Pharmaceutical Ingredients Market Volume (k unit ) Forecast, by Application 2019 & 2032
Frequently Asked Questions
1. What is the projected Compound Annual Growth Rate (CAGR) of the Active Pharmaceutical Ingredients Market?
The projected CAGR is approximately 8.31%.
2. Which companies are prominent players in the Active Pharmaceutical Ingredients Market?
Key companies in the market include Boehringer Ingelheim GmbH, Novartis AG, Viatris Inc, Lupin Ltd, BASF SE, Sun Pharmaceutical Industries Ltd, Aurobindo Pharma, Sanofi Inc, Dr Reddy's Laboratories Ltd, GlaxoSmithKline PLC, Pfizer Inc.
3. What are the main segments of the Active Pharmaceutical Ingredients Market?
The market segments include Business Mode, Synthesis Type, Drug Type, Application.
4. Can you provide details about the market size?
The market size is estimated to be USD 13.64 Million as of 2022.
5. What are some drivers contributing to market growth?
Increasing Prevalence of Infectious. Genetic. Cardiovascular. and Other Chronic Disorders; Rising Research & Development Activities of Generic Drugs; Increasing Adoption of Biologicals and Biosimilars.
6. What are the notable trends driving market growth?
Oncology Segment Expects to Register a High CAGR.
7. Are there any restraints impacting market growth?
Drug Price Control Policies; Stringent Regulations and Drug Price Policies in the Country.
8. Can you provide examples of recent developments in the market?
July 2022: Piramal Pharma Limited's Pharma Solutions business, a leading Contract Development and Manufacturing Organization (CDMO), launched a new active pharmaceutical ingredient (API) plant at the company's site in Aurora, Ontario.
9. What pricing options are available for accessing the report?
Pricing options include single-user, multi-user, and enterprise licenses priced at USD 3800, USD 4500, and USD 5800 respectively.
10. Is the market size provided in terms of value or volume?
The market size is provided in terms of value, measured in Million and volume, measured in k unit .
11. Are there any specific market keywords associated with the report?
Yes, the market keyword associated with the report is "Active Pharmaceutical Ingredients Market," which aids in identifying and referencing the specific market segment covered.
12. How do I determine which pricing option suits my needs best?
The pricing options vary based on user requirements and access needs. Individual users may opt for single-user licenses, while businesses requiring broader access may choose multi-user or enterprise licenses for cost-effective access to the report.
13. Are there any additional resources or data provided in the Active Pharmaceutical Ingredients Market report?
While the report offers comprehensive insights, it's advisable to review the specific contents or supplementary materials provided to ascertain if additional resources or data are available.
14. How can I stay updated on further developments or reports in the Active Pharmaceutical Ingredients Market?
To stay informed about further developments, trends, and reports in the Active Pharmaceutical Ingredients Market, consider subscribing to industry newsletters, following relevant companies and organizations, or regularly checking reputable industry news sources and publications.
Methodology
Step 1 - Identification of Relevant Samples Size from Population Database


Step 2 - Approaches for Defining Global Market Size (Value, Volume* & Price*)

Note*: In applicable scenarios
Step 3 - Data Sources
Primary Research
- Web Analytics
- Survey Reports
- Research Institute
- Latest Research Reports
- Opinion Leaders
Secondary Research
- Annual Reports
- White Paper
- Latest Press Release
- Industry Association
- Paid Database
- Investor Presentations

Step 4 - Data Triangulation
Involves using different sources of information in order to increase the validity of a study
These sources are likely to be stakeholders in a program - participants, other researchers, program staff, other community members, and so on.
Then we put all data in single framework & apply various statistical tools to find out the dynamic on the market.
During the analysis stage, feedback from the stakeholder groups would be compared to determine areas of agreement as well as areas of divergence


