
Key Insights
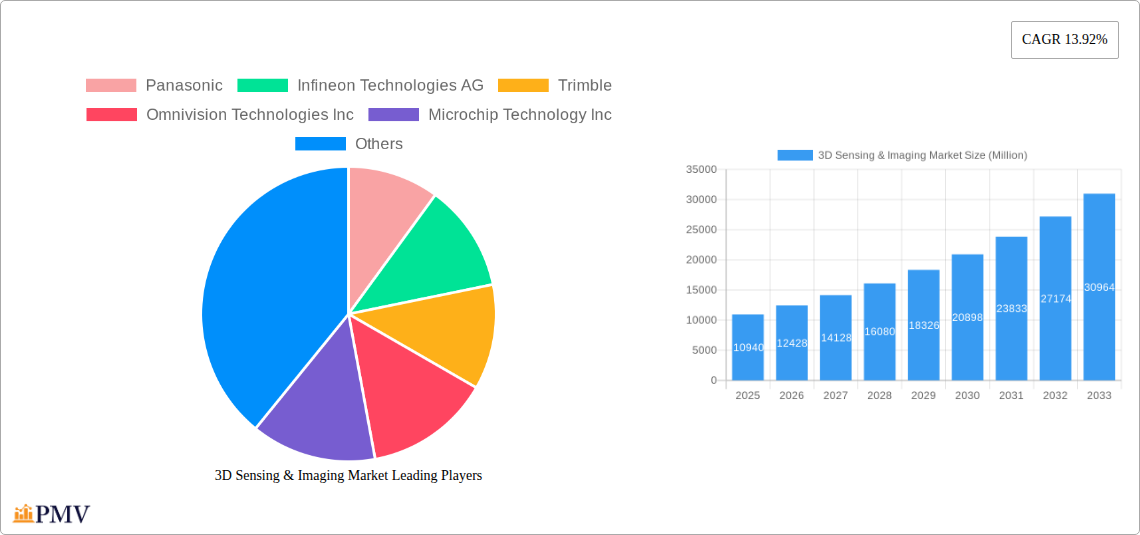
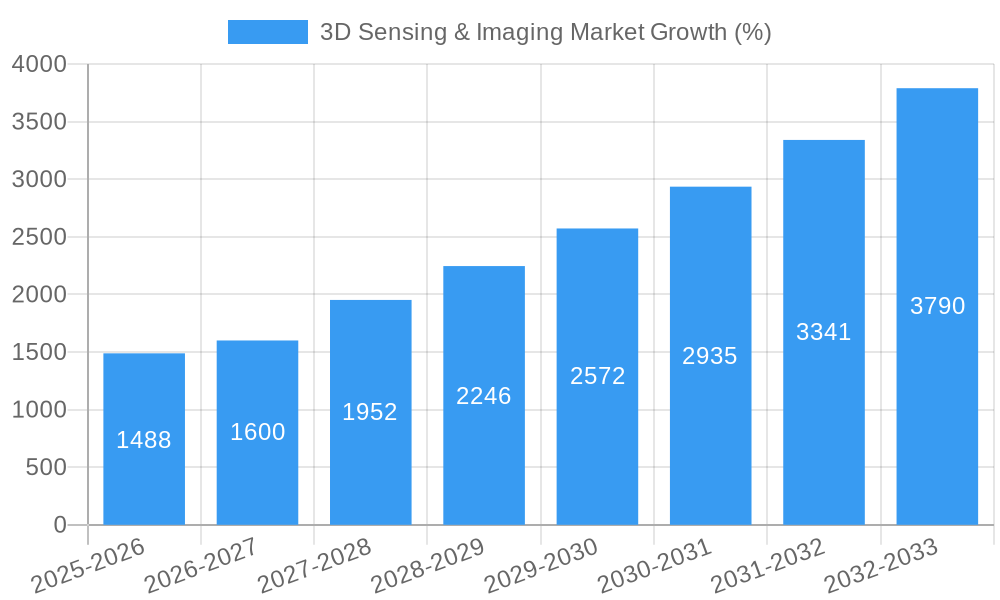
The 3D sensing and imaging market is experiencing robust growth, projected to reach \$10.94 billion in 2025 and exhibiting a compound annual growth rate (CAGR) of 13.92% from 2025 to 2033. This expansion is driven by several key factors. The increasing adoption of 3D sensing technologies across diverse end-user industries, including consumer electronics (driven by advanced smartphone features and augmented reality applications), automotive (for advanced driver-assistance systems and autonomous driving), and healthcare (for precise medical imaging and diagnostics), is a major catalyst. Furthermore, continuous advancements in component technologies like hardware, software, and services are enhancing the capabilities and affordability of 3D sensing solutions. The proliferation of various sensing technologies, including ultrasound, structured light, time-of-flight, and stereoscopic vision, caters to a wide range of applications and needs. The market is segmented by component (hardware, software, services), technology type, sensor type (position, image, temperature, accelerometer, proximity), and connectivity (wired and wireless). Strong growth is anticipated in the wireless connectivity segment, fueled by the rising demand for portable and mobile 3D sensing devices.
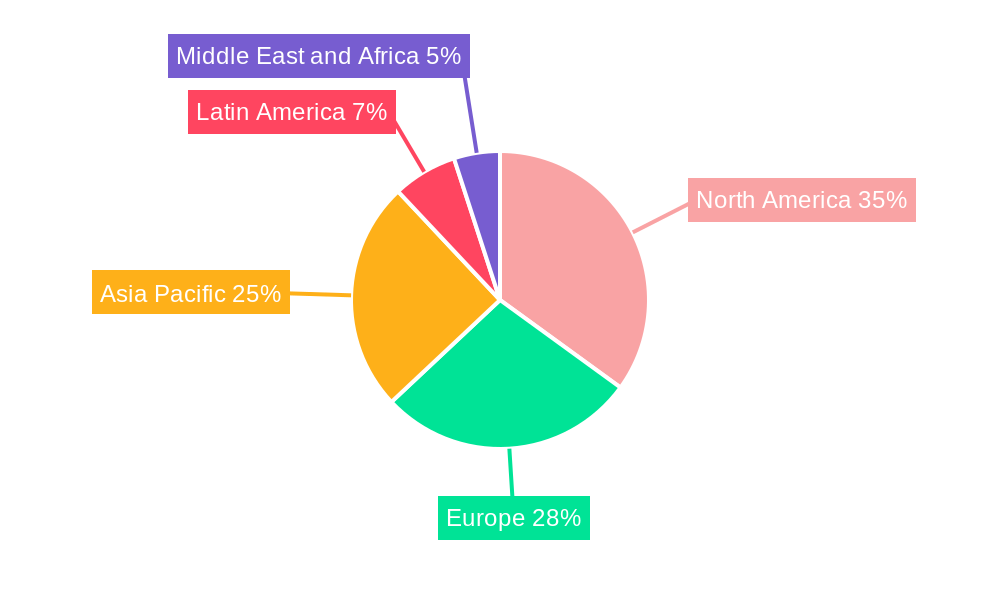
The major players in this market, including Panasonic, Infineon Technologies, Trimble, Omnivision, Microchip Technology, and others, are investing heavily in research and development to improve the accuracy, resolution, and processing speed of 3D sensing systems. Geographical distribution indicates significant market presence in North America and Asia Pacific, with Europe and other regions showing steady growth. While certain challenges like high initial investment costs and the complexity of integrating 3D sensing solutions into existing systems might act as restraints, the overall market outlook remains positive, driven by ongoing technological innovations and expanding application areas. The increasing demand for improved user experiences, enhanced safety features, and more efficient industrial processes will further fuel market growth in the coming years.
3D Sensing & Imaging Market: A Comprehensive Report (2019-2033)
This in-depth report provides a comprehensive analysis of the 3D Sensing & Imaging market, covering market size, growth drivers, competitive landscape, and future trends from 2019 to 2033. The study encompasses detailed segmentation across various parameters, offering actionable insights for stakeholders across the value chain. The base year for this analysis is 2025, with estimations for 2025 and forecasts extending to 2033. The historical period covered is 2019-2024.
3D Sensing & Imaging Market Market Structure & Competitive Dynamics
The 3D sensing and imaging market exhibits a moderately concentrated structure, with a few major players holding significant market share. However, the presence of numerous smaller, specialized firms fosters a dynamic competitive landscape. Innovation is crucial, driven by ongoing advancements in technologies like Time-of-Flight (ToF), structured light, and stereoscopic vision. Regulatory frameworks, particularly concerning data privacy and safety in applications like autonomous vehicles, significantly influence market dynamics. Product substitution, mainly among different 3D sensing technologies, is a continuous process, with newer technologies often offering advantages in terms of accuracy, cost, or power consumption. End-user trends, such as the increasing adoption of automation in various industries and the growing demand for immersive experiences in entertainment and gaming, are major growth drivers. Mergers and acquisitions (M&A) are frequent, with larger companies seeking to expand their product portfolios and market reach by acquiring smaller, innovative firms. For example, in the past few years, M&A deal values in the sector have totaled approximately xx Million, signifying substantial consolidation activity. Key players such as Panasonic, Infineon Technologies AG, and Qualcomm Inc., hold significant market share, estimated at xx% collectively in 2025.
3D Sensing & Imaging Market Industry Trends & Insights
The 3D sensing and imaging market is experiencing robust growth, with a projected Compound Annual Growth Rate (CAGR) of xx% during the forecast period (2025-2033). This growth is fueled by several key factors. Firstly, technological advancements in sensor technologies, processing power, and algorithms continuously improve the accuracy, speed, and cost-effectiveness of 3D sensing solutions. Secondly, increasing demand from key end-user industries, notably automotive (for advanced driver-assistance systems (ADAS) and autonomous driving), consumer electronics (for augmented reality (AR) and virtual reality (VR) applications), and healthcare (for medical imaging and diagnostics), is a major driver. Thirdly, consumer preferences are shifting towards more immersive and interactive experiences, further boosting the adoption of 3D sensing technologies in various applications. Market penetration in sectors such as automotive is projected to reach xx% by 2033, driven by stringent safety regulations and increasing consumer demand for advanced vehicle features. The competitive dynamics are characterized by intense innovation and strategic partnerships, with companies focusing on developing differentiated offerings and expanding their market reach. The market penetration for AR/VR applications is estimated to be at xx% in 2025 and is expected to grow to xx% by 2033.
Dominant Markets & Segments in 3D Sensing & Imaging Market
Dominant Region/Country: North America currently holds a dominant position in the 3D sensing and imaging market, driven by strong technological advancements, a robust consumer electronics market, and significant investments in the automotive and aerospace & defense sectors. Asia-Pacific is expected to show substantial growth owing to increasing manufacturing capabilities and growing investments in technology.
Dominant End-User Industry: The automotive industry is a major driver, with high demand for 3D sensing in ADAS and autonomous driving systems. Consumer electronics are also a significant segment, driven by the proliferation of AR/VR devices and smartphones with advanced 3D capabilities. The healthcare sector is also a growing market, driven by the need for advanced medical imaging and diagnostic tools.
Dominant Component: The hardware segment currently dominates the market due to the high demand for advanced sensors, cameras, and processing units. However, the software and services segments are expected to exhibit faster growth rates driven by increasing demand for sophisticated algorithms and data analytics.
Dominant Technology: Time-of-Flight (ToF) technology holds a leading position owing to its cost-effectiveness and relatively good accuracy. However, structured light technology remains competitive, offering high accuracy for certain applications. Stereoscopic vision, while more mature, continues to be used in niche applications.
Dominant Type: Image sensors represent the largest segment within the 3D sensing market, owing to their extensive use in various applications. However, the demand for other sensor types, such as position and proximity sensors, is growing, especially in robotics and automation.
Dominant Connectivity: Wireless network connectivity is increasingly preferred owing to its flexibility and ease of integration in mobile and portable devices.
Key drivers for the dominant segments include supportive government policies promoting technological innovation, robust infrastructure facilitating the deployment of 3D sensing technologies, and the presence of a skilled workforce in major technological hubs.
3D Sensing & Imaging Market Product Innovations
Recent product developments focus on miniaturization, improved accuracy, increased processing speed, and reduced power consumption. New products integrate advanced algorithms for improved depth perception, object recognition, and scene understanding. Companies are focusing on developing cost-effective solutions to broaden market reach and address diverse application requirements. Technological trends point towards increased integration of AI and machine learning capabilities to enhance the functionality and performance of 3D sensing systems, improving their suitability for applications demanding real-time processing and complex scene interpretation. This is improving market fit in multiple sectors.
Report Segmentation & Scope
The report provides a detailed segmentation of the 3D sensing and imaging market across multiple parameters:
End-user Industry: Consumer Electronics, Automotive, Healthcare, Aerospace & Defense, Security & Surveillance, Media and Entertainment, Other End-user Industries. Each segment is analyzed with respect to market size, growth projections, and competitive dynamics.
Component: Hardware, Software, Services. Each component’s market share, growth drivers, and competitive landscape are detailed.
Technology: Ultrasound, Structured Light, Time of Flight, Stereoscopic Vision, Other Technologies. The report assesses the market share and future prospects of each technology.
Type: Position Sensor, Image Sensor, Temperature Sensor, Accelerometer Sensor, Proximity Sensors, Others. Each sensor type is evaluated in terms of its market size and growth trajectory.
Connectivity: Wired Network Connectivity, Wireless Network Connectivity. Market trends and future growth projections for each connectivity type are analyzed.
Key Drivers of 3D Sensing & Imaging Market Growth
Technological advancements in sensor technologies and image processing algorithms are key growth drivers. The rising adoption of automation in various industries and the increasing demand for enhanced user experiences in consumer electronics are fueling market expansion. Government regulations and initiatives promoting the use of advanced technologies in key sectors (e.g., autonomous vehicles) further stimulate market growth. Economic growth and increased investment in research and development across various sectors also contribute significantly.
Challenges in the 3D Sensing & Imaging Market Sector
High initial costs associated with the implementation of 3D sensing systems can pose a challenge for smaller companies. Supply chain disruptions and component shortages can impact production and availability. Intense competition among established and emerging players necessitates continuous innovation and cost optimization. Regulatory hurdles and data privacy concerns also pose significant barriers to market entry and adoption in certain application areas. These factors can create price volatility and impact the overall market growth.
Leading Players in the 3D Sensing & Imaging Market Market
- Panasonic
- Infineon Technologies AG
- Trimble
- Omnivision Technologies Inc
- Microchip Technology Inc
- GE Healthcare
- Lockheed Martin
- Adobe
- STMicroelectronics
- Sick AG
- Faro
- Texas Instruments Incorporated
- Autodesk
- Keyence
- Dassault Systèmes
- Qualcomm Inc
Key Developments in 3D Sensing & Imaging Market Sector
- December 2021: LIPS Corporation unveiled new 3D structured light cameras, expanding its product portfolio and targeting various industries.
- January 2022: Pmdtechnologies AG launched the flexx2, a next-generation 3D time-of-flight development kit, offering improved depth-sensing performance.
- March 2022: LIPS Corporation and Newsight Imaging collaborated to develop eTOF-based 3D vision systems for Industry 4.0 and AIoT applications.
These developments highlight ongoing innovation and the expansion of 3D sensing applications across various industries.
Strategic 3D Sensing & Imaging Market Market Outlook
The 3D sensing and imaging market presents significant growth potential driven by the increasing demand for automation, advanced driver-assistance systems, augmented and virtual reality experiences, and advanced medical imaging. Strategic opportunities exist for companies focusing on developing cost-effective and high-performance solutions, integrating AI and machine learning capabilities, and forging strategic partnerships to expand market reach. The market is expected to witness continued technological advancements, increased adoption across diverse sectors, and significant revenue growth in the coming years.
3D Sensing & Imaging Market Segmentation
-
1. Component
- 1.1. Hardware
- 1.2. Software
- 1.3. Services
-
2. Technology
- 2.1. Ultrasound
- 2.2. Structured Light
- 2.3. Time of Flight
- 2.4. Stereoscopic Vision
- 2.5. Other Technologies
-
3. Type
- 3.1. Position Sensor
- 3.2. Image Sensor
- 3.3. Temperature Sensor
- 3.4. Accelerometer Sensor
- 3.5. Proximity Sensor
- 3.6. Other Types
-
4. Connectivity
- 4.1. Wired Network Connectivity
- 4.2. Wireless Network Connectivity
-
5. End-user Industry
- 5.1. Consumer Electronics
- 5.2. Automotive
- 5.3. Healthcare
- 5.4. Aerospace and Defense
- 5.5. Security and Surveillance
- 5.6. Media and Entertainment
- 5.7. Other End-user Industries
3D Sensing & Imaging Market Segmentation By Geography
- 1. North America
- 2. Europe
- 3. Asia Pacific
- 4. Middle East and Africa
- 5. Latin America
3D Sensing & Imaging Market REPORT HIGHLIGHTS
| Aspects | Details |
|---|---|
| Study Period | 2019-2033 |
| Base Year | 2024 |
| Estimated Year | 2025 |
| Forecast Period | 2025-2033 |
| Historical Period | 2019-2024 |
| Growth Rate | CAGR of 13.92% from 2019-2033 |
| Segmentation |
|
Table of Contents
- 1. Introduction
- 1.1. Research Scope
- 1.2. Market Segmentation
- 1.3. Research Methodology
- 1.4. Definitions and Assumptions
- 2. Executive Summary
- 2.1. Introduction
- 3. Market Dynamics
- 3.1. Introduction
- 3.2. Market Drivers
- 3.2.1. Integration of Optical and Electronic Components in Miniaturized Electronics Devices; Rising Demand for 3D-Enabled Devices in Consumer Electronics; Growing Penetration of Image Sensors in Automobiles; Growing Requirement of Security and Surveillance Systems
- 3.3. Market Restrains
- 3.3.1. High Manufacturing Cost of Image Sensors; Limited Integration With Other Devices; High Cost Required for the Maintenance of these Devices
- 3.4. Market Trends
- 3.4.1. Automotive Sector Expected to Drive Market Growth
- 4. Market Factor Analysis
- 4.1. Porters Five Forces
- 4.2. Supply/Value Chain
- 4.3. PESTEL analysis
- 4.4. Market Entropy
- 4.5. Patent/Trademark Analysis
- 5. Global 3D Sensing & Imaging Market Analysis, Insights and Forecast, 2019-2031
- 5.1. Market Analysis, Insights and Forecast - by Component
- 5.1.1. Hardware
- 5.1.2. Software
- 5.1.3. Services
- 5.2. Market Analysis, Insights and Forecast - by Technology
- 5.2.1. Ultrasound
- 5.2.2. Structured Light
- 5.2.3. Time of Flight
- 5.2.4. Stereoscopic Vision
- 5.2.5. Other Technologies
- 5.3. Market Analysis, Insights and Forecast - by Type
- 5.3.1. Position Sensor
- 5.3.2. Image Sensor
- 5.3.3. Temperature Sensor
- 5.3.4. Accelerometer Sensor
- 5.3.5. Proximity Sensor
- 5.3.6. Other Types
- 5.4. Market Analysis, Insights and Forecast - by Connectivity
- 5.4.1. Wired Network Connectivity
- 5.4.2. Wireless Network Connectivity
- 5.5. Market Analysis, Insights and Forecast - by End-user Industry
- 5.5.1. Consumer Electronics
- 5.5.2. Automotive
- 5.5.3. Healthcare
- 5.5.4. Aerospace and Defense
- 5.5.5. Security and Surveillance
- 5.5.6. Media and Entertainment
- 5.5.7. Other End-user Industries
- 5.6. Market Analysis, Insights and Forecast - by Region
- 5.6.1. North America
- 5.6.2. Europe
- 5.6.3. Asia Pacific
- 5.6.4. Middle East and Africa
- 5.6.5. Latin America
- 5.1. Market Analysis, Insights and Forecast - by Component
- 6. North America 3D Sensing & Imaging Market Analysis, Insights and Forecast, 2019-2031
- 6.1. Market Analysis, Insights and Forecast - by Component
- 6.1.1. Hardware
- 6.1.2. Software
- 6.1.3. Services
- 6.2. Market Analysis, Insights and Forecast - by Technology
- 6.2.1. Ultrasound
- 6.2.2. Structured Light
- 6.2.3. Time of Flight
- 6.2.4. Stereoscopic Vision
- 6.2.5. Other Technologies
- 6.3. Market Analysis, Insights and Forecast - by Type
- 6.3.1. Position Sensor
- 6.3.2. Image Sensor
- 6.3.3. Temperature Sensor
- 6.3.4. Accelerometer Sensor
- 6.3.5. Proximity Sensor
- 6.3.6. Other Types
- 6.4. Market Analysis, Insights and Forecast - by Connectivity
- 6.4.1. Wired Network Connectivity
- 6.4.2. Wireless Network Connectivity
- 6.5. Market Analysis, Insights and Forecast - by End-user Industry
- 6.5.1. Consumer Electronics
- 6.5.2. Automotive
- 6.5.3. Healthcare
- 6.5.4. Aerospace and Defense
- 6.5.5. Security and Surveillance
- 6.5.6. Media and Entertainment
- 6.5.7. Other End-user Industries
- 6.1. Market Analysis, Insights and Forecast - by Component
- 7. Europe 3D Sensing & Imaging Market Analysis, Insights and Forecast, 2019-2031
- 7.1. Market Analysis, Insights and Forecast - by Component
- 7.1.1. Hardware
- 7.1.2. Software
- 7.1.3. Services
- 7.2. Market Analysis, Insights and Forecast - by Technology
- 7.2.1. Ultrasound
- 7.2.2. Structured Light
- 7.2.3. Time of Flight
- 7.2.4. Stereoscopic Vision
- 7.2.5. Other Technologies
- 7.3. Market Analysis, Insights and Forecast - by Type
- 7.3.1. Position Sensor
- 7.3.2. Image Sensor
- 7.3.3. Temperature Sensor
- 7.3.4. Accelerometer Sensor
- 7.3.5. Proximity Sensor
- 7.3.6. Other Types
- 7.4. Market Analysis, Insights and Forecast - by Connectivity
- 7.4.1. Wired Network Connectivity
- 7.4.2. Wireless Network Connectivity
- 7.5. Market Analysis, Insights and Forecast - by End-user Industry
- 7.5.1. Consumer Electronics
- 7.5.2. Automotive
- 7.5.3. Healthcare
- 7.5.4. Aerospace and Defense
- 7.5.5. Security and Surveillance
- 7.5.6. Media and Entertainment
- 7.5.7. Other End-user Industries
- 7.1. Market Analysis, Insights and Forecast - by Component
- 8. Asia Pacific 3D Sensing & Imaging Market Analysis, Insights and Forecast, 2019-2031
- 8.1. Market Analysis, Insights and Forecast - by Component
- 8.1.1. Hardware
- 8.1.2. Software
- 8.1.3. Services
- 8.2. Market Analysis, Insights and Forecast - by Technology
- 8.2.1. Ultrasound
- 8.2.2. Structured Light
- 8.2.3. Time of Flight
- 8.2.4. Stereoscopic Vision
- 8.2.5. Other Technologies
- 8.3. Market Analysis, Insights and Forecast - by Type
- 8.3.1. Position Sensor
- 8.3.2. Image Sensor
- 8.3.3. Temperature Sensor
- 8.3.4. Accelerometer Sensor
- 8.3.5. Proximity Sensor
- 8.3.6. Other Types
- 8.4. Market Analysis, Insights and Forecast - by Connectivity
- 8.4.1. Wired Network Connectivity
- 8.4.2. Wireless Network Connectivity
- 8.5. Market Analysis, Insights and Forecast - by End-user Industry
- 8.5.1. Consumer Electronics
- 8.5.2. Automotive
- 8.5.3. Healthcare
- 8.5.4. Aerospace and Defense
- 8.5.5. Security and Surveillance
- 8.5.6. Media and Entertainment
- 8.5.7. Other End-user Industries
- 8.1. Market Analysis, Insights and Forecast - by Component
- 9. Middle East and Africa 3D Sensing & Imaging Market Analysis, Insights and Forecast, 2019-2031
- 9.1. Market Analysis, Insights and Forecast - by Component
- 9.1.1. Hardware
- 9.1.2. Software
- 9.1.3. Services
- 9.2. Market Analysis, Insights and Forecast - by Technology
- 9.2.1. Ultrasound
- 9.2.2. Structured Light
- 9.2.3. Time of Flight
- 9.2.4. Stereoscopic Vision
- 9.2.5. Other Technologies
- 9.3. Market Analysis, Insights and Forecast - by Type
- 9.3.1. Position Sensor
- 9.3.2. Image Sensor
- 9.3.3. Temperature Sensor
- 9.3.4. Accelerometer Sensor
- 9.3.5. Proximity Sensor
- 9.3.6. Other Types
- 9.4. Market Analysis, Insights and Forecast - by Connectivity
- 9.4.1. Wired Network Connectivity
- 9.4.2. Wireless Network Connectivity
- 9.5. Market Analysis, Insights and Forecast - by End-user Industry
- 9.5.1. Consumer Electronics
- 9.5.2. Automotive
- 9.5.3. Healthcare
- 9.5.4. Aerospace and Defense
- 9.5.5. Security and Surveillance
- 9.5.6. Media and Entertainment
- 9.5.7. Other End-user Industries
- 9.1. Market Analysis, Insights and Forecast - by Component
- 10. Latin America 3D Sensing & Imaging Market Analysis, Insights and Forecast, 2019-2031
- 10.1. Market Analysis, Insights and Forecast - by Component
- 10.1.1. Hardware
- 10.1.2. Software
- 10.1.3. Services
- 10.2. Market Analysis, Insights and Forecast - by Technology
- 10.2.1. Ultrasound
- 10.2.2. Structured Light
- 10.2.3. Time of Flight
- 10.2.4. Stereoscopic Vision
- 10.2.5. Other Technologies
- 10.3. Market Analysis, Insights and Forecast - by Type
- 10.3.1. Position Sensor
- 10.3.2. Image Sensor
- 10.3.3. Temperature Sensor
- 10.3.4. Accelerometer Sensor
- 10.3.5. Proximity Sensor
- 10.3.6. Other Types
- 10.4. Market Analysis, Insights and Forecast - by Connectivity
- 10.4.1. Wired Network Connectivity
- 10.4.2. Wireless Network Connectivity
- 10.5. Market Analysis, Insights and Forecast - by End-user Industry
- 10.5.1. Consumer Electronics
- 10.5.2. Automotive
- 10.5.3. Healthcare
- 10.5.4. Aerospace and Defense
- 10.5.5. Security and Surveillance
- 10.5.6. Media and Entertainment
- 10.5.7. Other End-user Industries
- 10.1. Market Analysis, Insights and Forecast - by Component
- 11. North America 3D Sensing & Imaging Market Analysis, Insights and Forecast, 2019-2031
- 11.1. Market Analysis, Insights and Forecast - By Country/Sub-region
- 11.1.1.
- 12. Europe 3D Sensing & Imaging Market Analysis, Insights and Forecast, 2019-2031
- 12.1. Market Analysis, Insights and Forecast - By Country/Sub-region
- 12.1.1.
- 13. Asia Pacific 3D Sensing & Imaging Market Analysis, Insights and Forecast, 2019-2031
- 13.1. Market Analysis, Insights and Forecast - By Country/Sub-region
- 13.1.1.
- 14. Latin America 3D Sensing & Imaging Market Analysis, Insights and Forecast, 2019-2031
- 14.1. Market Analysis, Insights and Forecast - By Country/Sub-region
- 14.1.1.
- 15. Middle East and Africa 3D Sensing & Imaging Market Analysis, Insights and Forecast, 2019-2031
- 15.1. Market Analysis, Insights and Forecast - By Country/Sub-region
- 15.1.1.
- 16. Competitive Analysis
- 16.1. Global Market Share Analysis 2024
- 16.2. Company Profiles
- 16.2.1 Panasonic
- 16.2.1.1. Overview
- 16.2.1.2. Products
- 16.2.1.3. SWOT Analysis
- 16.2.1.4. Recent Developments
- 16.2.1.5. Financials (Based on Availability)
- 16.2.2 Infineon Technologies AG
- 16.2.2.1. Overview
- 16.2.2.2. Products
- 16.2.2.3. SWOT Analysis
- 16.2.2.4. Recent Developments
- 16.2.2.5. Financials (Based on Availability)
- 16.2.3 Trimble
- 16.2.3.1. Overview
- 16.2.3.2. Products
- 16.2.3.3. SWOT Analysis
- 16.2.3.4. Recent Developments
- 16.2.3.5. Financials (Based on Availability)
- 16.2.4 Omnivision Technologies Inc
- 16.2.4.1. Overview
- 16.2.4.2. Products
- 16.2.4.3. SWOT Analysis
- 16.2.4.4. Recent Developments
- 16.2.4.5. Financials (Based on Availability)
- 16.2.5 Microchip Technology Inc
- 16.2.5.1. Overview
- 16.2.5.2. Products
- 16.2.5.3. SWOT Analysis
- 16.2.5.4. Recent Developments
- 16.2.5.5. Financials (Based on Availability)
- 16.2.6 GE Healthcare
- 16.2.6.1. Overview
- 16.2.6.2. Products
- 16.2.6.3. SWOT Analysis
- 16.2.6.4. Recent Developments
- 16.2.6.5. Financials (Based on Availability)
- 16.2.7 Lockheed Martin
- 16.2.7.1. Overview
- 16.2.7.2. Products
- 16.2.7.3. SWOT Analysis
- 16.2.7.4. Recent Developments
- 16.2.7.5. Financials (Based on Availability)
- 16.2.8 Adobe
- 16.2.8.1. Overview
- 16.2.8.2. Products
- 16.2.8.3. SWOT Analysis
- 16.2.8.4. Recent Developments
- 16.2.8.5. Financials (Based on Availability)
- 16.2.9 STMicroelectronics
- 16.2.9.1. Overview
- 16.2.9.2. Products
- 16.2.9.3. SWOT Analysis
- 16.2.9.4. Recent Developments
- 16.2.9.5. Financials (Based on Availability)
- 16.2.10 Google
- 16.2.10.1. Overview
- 16.2.10.2. Products
- 16.2.10.3. SWOT Analysis
- 16.2.10.4. Recent Developments
- 16.2.10.5. Financials (Based on Availability)
- 16.2.11 Sick AG
- 16.2.11.1. Overview
- 16.2.11.2. Products
- 16.2.11.3. SWOT Analysis
- 16.2.11.4. Recent Developments
- 16.2.11.5. Financials (Based on Availability)
- 16.2.12 Faro
- 16.2.12.1. Overview
- 16.2.12.2. Products
- 16.2.12.3. SWOT Analysis
- 16.2.12.4. Recent Developments
- 16.2.12.5. Financials (Based on Availability)
- 16.2.13 Texas Instruments Incorporated
- 16.2.13.1. Overview
- 16.2.13.2. Products
- 16.2.13.3. SWOT Analysis
- 16.2.13.4. Recent Developments
- 16.2.13.5. Financials (Based on Availability)
- 16.2.14 Autodesk
- 16.2.14.1. Overview
- 16.2.14.2. Products
- 16.2.14.3. SWOT Analysis
- 16.2.14.4. Recent Developments
- 16.2.14.5. Financials (Based on Availability)
- 16.2.15 Keyence
- 16.2.15.1. Overview
- 16.2.15.2. Products
- 16.2.15.3. SWOT Analysis
- 16.2.15.4. Recent Developments
- 16.2.15.5. Financials (Based on Availability)
- 16.2.16 Dassault Systems*List Not Exhaustive
- 16.2.16.1. Overview
- 16.2.16.2. Products
- 16.2.16.3. SWOT Analysis
- 16.2.16.4. Recent Developments
- 16.2.16.5. Financials (Based on Availability)
- 16.2.17 Qualcomm Inc
- 16.2.17.1. Overview
- 16.2.17.2. Products
- 16.2.17.3. SWOT Analysis
- 16.2.17.4. Recent Developments
- 16.2.17.5. Financials (Based on Availability)
- 16.2.1 Panasonic
List of Figures
- Figure 1: Global 3D Sensing & Imaging Market Revenue Breakdown (Million, %) by Region 2024 & 2032
- Figure 2: North America 3D Sensing & Imaging Market Revenue (Million), by Country 2024 & 2032
- Figure 3: North America 3D Sensing & Imaging Market Revenue Share (%), by Country 2024 & 2032
- Figure 4: Europe 3D Sensing & Imaging Market Revenue (Million), by Country 2024 & 2032
- Figure 5: Europe 3D Sensing & Imaging Market Revenue Share (%), by Country 2024 & 2032
- Figure 6: Asia Pacific 3D Sensing & Imaging Market Revenue (Million), by Country 2024 & 2032
- Figure 7: Asia Pacific 3D Sensing & Imaging Market Revenue Share (%), by Country 2024 & 2032
- Figure 8: Latin America 3D Sensing & Imaging Market Revenue (Million), by Country 2024 & 2032
- Figure 9: Latin America 3D Sensing & Imaging Market Revenue Share (%), by Country 2024 & 2032
- Figure 10: Middle East and Africa 3D Sensing & Imaging Market Revenue (Million), by Country 2024 & 2032
- Figure 11: Middle East and Africa 3D Sensing & Imaging Market Revenue Share (%), by Country 2024 & 2032
- Figure 12: North America 3D Sensing & Imaging Market Revenue (Million), by Component 2024 & 2032
- Figure 13: North America 3D Sensing & Imaging Market Revenue Share (%), by Component 2024 & 2032
- Figure 14: North America 3D Sensing & Imaging Market Revenue (Million), by Technology 2024 & 2032
- Figure 15: North America 3D Sensing & Imaging Market Revenue Share (%), by Technology 2024 & 2032
- Figure 16: North America 3D Sensing & Imaging Market Revenue (Million), by Type 2024 & 2032
- Figure 17: North America 3D Sensing & Imaging Market Revenue Share (%), by Type 2024 & 2032
- Figure 18: North America 3D Sensing & Imaging Market Revenue (Million), by Connectivity 2024 & 2032
- Figure 19: North America 3D Sensing & Imaging Market Revenue Share (%), by Connectivity 2024 & 2032
- Figure 20: North America 3D Sensing & Imaging Market Revenue (Million), by End-user Industry 2024 & 2032
- Figure 21: North America 3D Sensing & Imaging Market Revenue Share (%), by End-user Industry 2024 & 2032
- Figure 22: North America 3D Sensing & Imaging Market Revenue (Million), by Country 2024 & 2032
- Figure 23: North America 3D Sensing & Imaging Market Revenue Share (%), by Country 2024 & 2032
- Figure 24: Europe 3D Sensing & Imaging Market Revenue (Million), by Component 2024 & 2032
- Figure 25: Europe 3D Sensing & Imaging Market Revenue Share (%), by Component 2024 & 2032
- Figure 26: Europe 3D Sensing & Imaging Market Revenue (Million), by Technology 2024 & 2032
- Figure 27: Europe 3D Sensing & Imaging Market Revenue Share (%), by Technology 2024 & 2032
- Figure 28: Europe 3D Sensing & Imaging Market Revenue (Million), by Type 2024 & 2032
- Figure 29: Europe 3D Sensing & Imaging Market Revenue Share (%), by Type 2024 & 2032
- Figure 30: Europe 3D Sensing & Imaging Market Revenue (Million), by Connectivity 2024 & 2032
- Figure 31: Europe 3D Sensing & Imaging Market Revenue Share (%), by Connectivity 2024 & 2032
- Figure 32: Europe 3D Sensing & Imaging Market Revenue (Million), by End-user Industry 2024 & 2032
- Figure 33: Europe 3D Sensing & Imaging Market Revenue Share (%), by End-user Industry 2024 & 2032
- Figure 34: Europe 3D Sensing & Imaging Market Revenue (Million), by Country 2024 & 2032
- Figure 35: Europe 3D Sensing & Imaging Market Revenue Share (%), by Country 2024 & 2032
- Figure 36: Asia Pacific 3D Sensing & Imaging Market Revenue (Million), by Component 2024 & 2032
- Figure 37: Asia Pacific 3D Sensing & Imaging Market Revenue Share (%), by Component 2024 & 2032
- Figure 38: Asia Pacific 3D Sensing & Imaging Market Revenue (Million), by Technology 2024 & 2032
- Figure 39: Asia Pacific 3D Sensing & Imaging Market Revenue Share (%), by Technology 2024 & 2032
- Figure 40: Asia Pacific 3D Sensing & Imaging Market Revenue (Million), by Type 2024 & 2032
- Figure 41: Asia Pacific 3D Sensing & Imaging Market Revenue Share (%), by Type 2024 & 2032
- Figure 42: Asia Pacific 3D Sensing & Imaging Market Revenue (Million), by Connectivity 2024 & 2032
- Figure 43: Asia Pacific 3D Sensing & Imaging Market Revenue Share (%), by Connectivity 2024 & 2032
- Figure 44: Asia Pacific 3D Sensing & Imaging Market Revenue (Million), by End-user Industry 2024 & 2032
- Figure 45: Asia Pacific 3D Sensing & Imaging Market Revenue Share (%), by End-user Industry 2024 & 2032
- Figure 46: Asia Pacific 3D Sensing & Imaging Market Revenue (Million), by Country 2024 & 2032
- Figure 47: Asia Pacific 3D Sensing & Imaging Market Revenue Share (%), by Country 2024 & 2032
- Figure 48: Middle East and Africa 3D Sensing & Imaging Market Revenue (Million), by Component 2024 & 2032
- Figure 49: Middle East and Africa 3D Sensing & Imaging Market Revenue Share (%), by Component 2024 & 2032
- Figure 50: Middle East and Africa 3D Sensing & Imaging Market Revenue (Million), by Technology 2024 & 2032
- Figure 51: Middle East and Africa 3D Sensing & Imaging Market Revenue Share (%), by Technology 2024 & 2032
- Figure 52: Middle East and Africa 3D Sensing & Imaging Market Revenue (Million), by Type 2024 & 2032
- Figure 53: Middle East and Africa 3D Sensing & Imaging Market Revenue Share (%), by Type 2024 & 2032
- Figure 54: Middle East and Africa 3D Sensing & Imaging Market Revenue (Million), by Connectivity 2024 & 2032
- Figure 55: Middle East and Africa 3D Sensing & Imaging Market Revenue Share (%), by Connectivity 2024 & 2032
- Figure 56: Middle East and Africa 3D Sensing & Imaging Market Revenue (Million), by End-user Industry 2024 & 2032
- Figure 57: Middle East and Africa 3D Sensing & Imaging Market Revenue Share (%), by End-user Industry 2024 & 2032
- Figure 58: Middle East and Africa 3D Sensing & Imaging Market Revenue (Million), by Country 2024 & 2032
- Figure 59: Middle East and Africa 3D Sensing & Imaging Market Revenue Share (%), by Country 2024 & 2032
- Figure 60: Latin America 3D Sensing & Imaging Market Revenue (Million), by Component 2024 & 2032
- Figure 61: Latin America 3D Sensing & Imaging Market Revenue Share (%), by Component 2024 & 2032
- Figure 62: Latin America 3D Sensing & Imaging Market Revenue (Million), by Technology 2024 & 2032
- Figure 63: Latin America 3D Sensing & Imaging Market Revenue Share (%), by Technology 2024 & 2032
- Figure 64: Latin America 3D Sensing & Imaging Market Revenue (Million), by Type 2024 & 2032
- Figure 65: Latin America 3D Sensing & Imaging Market Revenue Share (%), by Type 2024 & 2032
- Figure 66: Latin America 3D Sensing & Imaging Market Revenue (Million), by Connectivity 2024 & 2032
- Figure 67: Latin America 3D Sensing & Imaging Market Revenue Share (%), by Connectivity 2024 & 2032
- Figure 68: Latin America 3D Sensing & Imaging Market Revenue (Million), by End-user Industry 2024 & 2032
- Figure 69: Latin America 3D Sensing & Imaging Market Revenue Share (%), by End-user Industry 2024 & 2032
- Figure 70: Latin America 3D Sensing & Imaging Market Revenue (Million), by Country 2024 & 2032
- Figure 71: Latin America 3D Sensing & Imaging Market Revenue Share (%), by Country 2024 & 2032
List of Tables
- Table 1: Global 3D Sensing & Imaging Market Revenue Million Forecast, by Region 2019 & 2032
- Table 2: Global 3D Sensing & Imaging Market Revenue Million Forecast, by Component 2019 & 2032
- Table 3: Global 3D Sensing & Imaging Market Revenue Million Forecast, by Technology 2019 & 2032
- Table 4: Global 3D Sensing & Imaging Market Revenue Million Forecast, by Type 2019 & 2032
- Table 5: Global 3D Sensing & Imaging Market Revenue Million Forecast, by Connectivity 2019 & 2032
- Table 6: Global 3D Sensing & Imaging Market Revenue Million Forecast, by End-user Industry 2019 & 2032
- Table 7: Global 3D Sensing & Imaging Market Revenue Million Forecast, by Region 2019 & 2032
- Table 8: Global 3D Sensing & Imaging Market Revenue Million Forecast, by Country 2019 & 2032
- Table 9: 3D Sensing & Imaging Market Revenue (Million) Forecast, by Application 2019 & 2032
- Table 10: Global 3D Sensing & Imaging Market Revenue Million Forecast, by Country 2019 & 2032
- Table 11: 3D Sensing & Imaging Market Revenue (Million) Forecast, by Application 2019 & 2032
- Table 12: Global 3D Sensing & Imaging Market Revenue Million Forecast, by Country 2019 & 2032
- Table 13: 3D Sensing & Imaging Market Revenue (Million) Forecast, by Application 2019 & 2032
- Table 14: Global 3D Sensing & Imaging Market Revenue Million Forecast, by Country 2019 & 2032
- Table 15: 3D Sensing & Imaging Market Revenue (Million) Forecast, by Application 2019 & 2032
- Table 16: Global 3D Sensing & Imaging Market Revenue Million Forecast, by Country 2019 & 2032
- Table 17: 3D Sensing & Imaging Market Revenue (Million) Forecast, by Application 2019 & 2032
- Table 18: Global 3D Sensing & Imaging Market Revenue Million Forecast, by Component 2019 & 2032
- Table 19: Global 3D Sensing & Imaging Market Revenue Million Forecast, by Technology 2019 & 2032
- Table 20: Global 3D Sensing & Imaging Market Revenue Million Forecast, by Type 2019 & 2032
- Table 21: Global 3D Sensing & Imaging Market Revenue Million Forecast, by Connectivity 2019 & 2032
- Table 22: Global 3D Sensing & Imaging Market Revenue Million Forecast, by End-user Industry 2019 & 2032
- Table 23: Global 3D Sensing & Imaging Market Revenue Million Forecast, by Country 2019 & 2032
- Table 24: Global 3D Sensing & Imaging Market Revenue Million Forecast, by Component 2019 & 2032
- Table 25: Global 3D Sensing & Imaging Market Revenue Million Forecast, by Technology 2019 & 2032
- Table 26: Global 3D Sensing & Imaging Market Revenue Million Forecast, by Type 2019 & 2032
- Table 27: Global 3D Sensing & Imaging Market Revenue Million Forecast, by Connectivity 2019 & 2032
- Table 28: Global 3D Sensing & Imaging Market Revenue Million Forecast, by End-user Industry 2019 & 2032
- Table 29: Global 3D Sensing & Imaging Market Revenue Million Forecast, by Country 2019 & 2032
- Table 30: Global 3D Sensing & Imaging Market Revenue Million Forecast, by Component 2019 & 2032
- Table 31: Global 3D Sensing & Imaging Market Revenue Million Forecast, by Technology 2019 & 2032
- Table 32: Global 3D Sensing & Imaging Market Revenue Million Forecast, by Type 2019 & 2032
- Table 33: Global 3D Sensing & Imaging Market Revenue Million Forecast, by Connectivity 2019 & 2032
- Table 34: Global 3D Sensing & Imaging Market Revenue Million Forecast, by End-user Industry 2019 & 2032
- Table 35: Global 3D Sensing & Imaging Market Revenue Million Forecast, by Country 2019 & 2032
- Table 36: Global 3D Sensing & Imaging Market Revenue Million Forecast, by Component 2019 & 2032
- Table 37: Global 3D Sensing & Imaging Market Revenue Million Forecast, by Technology 2019 & 2032
- Table 38: Global 3D Sensing & Imaging Market Revenue Million Forecast, by Type 2019 & 2032
- Table 39: Global 3D Sensing & Imaging Market Revenue Million Forecast, by Connectivity 2019 & 2032
- Table 40: Global 3D Sensing & Imaging Market Revenue Million Forecast, by End-user Industry 2019 & 2032
- Table 41: Global 3D Sensing & Imaging Market Revenue Million Forecast, by Country 2019 & 2032
- Table 42: Global 3D Sensing & Imaging Market Revenue Million Forecast, by Component 2019 & 2032
- Table 43: Global 3D Sensing & Imaging Market Revenue Million Forecast, by Technology 2019 & 2032
- Table 44: Global 3D Sensing & Imaging Market Revenue Million Forecast, by Type 2019 & 2032
- Table 45: Global 3D Sensing & Imaging Market Revenue Million Forecast, by Connectivity 2019 & 2032
- Table 46: Global 3D Sensing & Imaging Market Revenue Million Forecast, by End-user Industry 2019 & 2032
- Table 47: Global 3D Sensing & Imaging Market Revenue Million Forecast, by Country 2019 & 2032
Frequently Asked Questions
1. What is the projected Compound Annual Growth Rate (CAGR) of the 3D Sensing & Imaging Market?
The projected CAGR is approximately 13.92%.
2. Which companies are prominent players in the 3D Sensing & Imaging Market?
Key companies in the market include Panasonic, Infineon Technologies AG, Trimble, Omnivision Technologies Inc, Microchip Technology Inc, GE Healthcare, Lockheed Martin, Adobe, STMicroelectronics, Google, Sick AG, Faro, Texas Instruments Incorporated, Autodesk, Keyence, Dassault Systems*List Not Exhaustive, Qualcomm Inc.
3. What are the main segments of the 3D Sensing & Imaging Market?
The market segments include Component, Technology, Type, Connectivity, End-user Industry.
4. Can you provide details about the market size?
The market size is estimated to be USD 10.94 Million as of 2022.
5. What are some drivers contributing to market growth?
Integration of Optical and Electronic Components in Miniaturized Electronics Devices; Rising Demand for 3D-Enabled Devices in Consumer Electronics; Growing Penetration of Image Sensors in Automobiles; Growing Requirement of Security and Surveillance Systems.
6. What are the notable trends driving market growth?
Automotive Sector Expected to Drive Market Growth.
7. Are there any restraints impacting market growth?
High Manufacturing Cost of Image Sensors; Limited Integration With Other Devices; High Cost Required for the Maintenance of these Devices.
8. Can you provide examples of recent developments in the market?
March 2022 - LIPS Corporation and Newsight Imaging signed a Memorandum of Understanding (MoU) to develop, promote, and facilitate eTOF (enhanced-Time-Of-Flight) based 3D vision systems for industry 4.0 usage-cases and AIoT.
9. What pricing options are available for accessing the report?
Pricing options include single-user, multi-user, and enterprise licenses priced at USD 4750, USD 5250, and USD 8750 respectively.
10. Is the market size provided in terms of value or volume?
The market size is provided in terms of value, measured in Million.
11. Are there any specific market keywords associated with the report?
Yes, the market keyword associated with the report is "3D Sensing & Imaging Market," which aids in identifying and referencing the specific market segment covered.
12. How do I determine which pricing option suits my needs best?
The pricing options vary based on user requirements and access needs. Individual users may opt for single-user licenses, while businesses requiring broader access may choose multi-user or enterprise licenses for cost-effective access to the report.
13. Are there any additional resources or data provided in the 3D Sensing & Imaging Market report?
While the report offers comprehensive insights, it's advisable to review the specific contents or supplementary materials provided to ascertain if additional resources or data are available.
14. How can I stay updated on further developments or reports in the 3D Sensing & Imaging Market?
To stay informed about further developments, trends, and reports in the 3D Sensing & Imaging Market, consider subscribing to industry newsletters, following relevant companies and organizations, or regularly checking reputable industry news sources and publications.
Methodology
Step 1 - Identification of Relevant Samples Size from Population Database


Step 2 - Approaches for Defining Global Market Size (Value, Volume* & Price*)

Note*: In applicable scenarios
Step 3 - Data Sources
Primary Research
- Web Analytics
- Survey Reports
- Research Institute
- Latest Research Reports
- Opinion Leaders
Secondary Research
- Annual Reports
- White Paper
- Latest Press Release
- Industry Association
- Paid Database
- Investor Presentations

Step 4 - Data Triangulation
Involves using different sources of information in order to increase the validity of a study
These sources are likely to be stakeholders in a program - participants, other researchers, program staff, other community members, and so on.
Then we put all data in single framework & apply various statistical tools to find out the dynamic on the market.
During the analysis stage, feedback from the stakeholder groups would be compared to determine areas of agreement as well as areas of divergence


