
Key Insights
The wireless multiroom digital music systems market is experiencing robust growth, driven by increasing consumer demand for seamless audio experiences across multiple rooms. The convenience of controlling music playback from a single app, coupled with the rise of high-quality streaming services, fuels this expansion. Technological advancements, including improved Wi-Fi connectivity and the integration of voice assistants, are further enhancing user experience and driving adoption. The market is segmented by various factors, such as price point (premium, mid-range, budget), functionality (basic playback, advanced features like sound personalization), and brand loyalty. Key players like Sonos, Bose, and others are investing heavily in research and development to improve sound quality, expand features, and cater to evolving consumer preferences. Competition is intense, with established brands facing challenges from emerging players and the ever-increasing integration of smart home technology. The market's growth is likely to continue at a healthy rate, fueled by the increasing adoption of smart speakers and a preference for higher-quality audio experiences in homes.
Despite the strong growth trajectory, the market faces certain challenges. High initial investment costs for premium systems can hinder wider adoption among budget-conscious consumers. Concerns regarding data privacy and security related to connected devices remain a factor. Furthermore, the market faces intense competition among established players, each vying for market share through innovative features and aggressive pricing strategies. The complexity of setting up and managing multi-room systems can pose a barrier for some users. However, these challenges are likely to be mitigated through technological advancements, improved user interfaces, and ongoing efforts by manufacturers to simplify the user experience. The market's future depends on companies' ability to innovate and offer competitive pricing while ensuring a seamless user experience, emphasizing quality, and addressing customer concerns regarding privacy and security.
This comprehensive report provides an in-depth analysis of the global Wireless Multiroom Digital Music Systems market, offering valuable insights for industry stakeholders, investors, and strategic decision-makers. The study covers the period from 2019 to 2033, with a focus on the forecast period of 2025-2033, and uses 2025 as the base and estimated year. The report projects a market size exceeding $XX million by 2033, exhibiting a compelling CAGR of xx%.
Wireless Multiroom Digital Music Systems Market Structure & Competitive Dynamics
This section analyzes the competitive landscape of the Wireless Multiroom Digital Music Systems market, encompassing market concentration, innovation, regulatory frameworks, product substitutes, and M&A activities. The market is characterized by a mix of established players like Sonos, Bose, and Sonos, and emerging companies vying for market share. Market concentration is currently moderate, with the top five players holding an estimated xx% of the market in 2025. However, the market is witnessing increased consolidation through mergers and acquisitions (M&A), with deal values exceeding $XX million in the past five years. Innovation is driven by advancements in audio technology, seamless integration with smart home ecosystems, and improved user interfaces. Regulatory frameworks concerning data privacy and intellectual property rights influence market dynamics. The rise of streaming services and smart speakers presents significant opportunities and challenges as product substitutes. End-user trends show a growing preference for high-fidelity audio, personalized experiences, and ease of use, driving the demand for sophisticated multiroom systems.
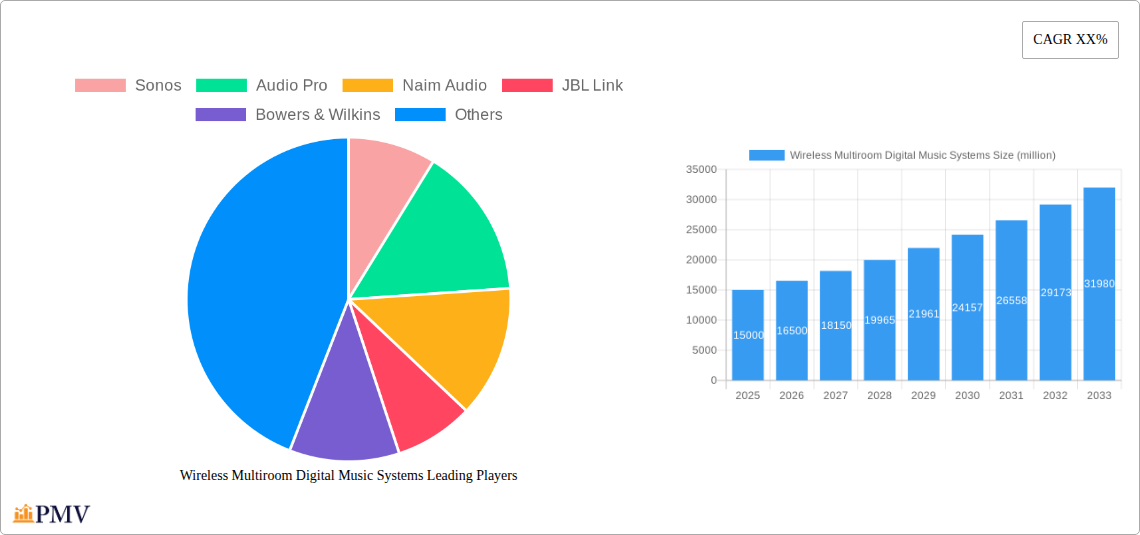
- Market Share (2025): Sonos (xx%), Bose (xx%), Amazon (xx%), Apple (xx%), Others (xx%)
- M&A Activity (2019-2024): Total deal value exceeding $XX million, with an average deal size of $XX million.
- Key Competitive Strategies: Product differentiation, strategic partnerships, technological innovation, and expansion into new markets.
Wireless Multiroom Digital Music Systems Industry Trends & Insights
The Wireless Multiroom Digital Music Systems market is experiencing robust growth, driven by several key factors. The increasing penetration of high-speed internet and the proliferation of streaming music services are fueling demand. Consumer preferences are shifting towards convenient, high-quality audio experiences within the home. Technological advancements like Wi-Fi 6 and improved audio codecs are enhancing the quality and reliability of wireless multiroom systems. Furthermore, the integration of these systems with smart home platforms adds value and convenience for consumers. However, the market faces challenges such as maintaining consistent audio quality across multiple devices and addressing concerns about data security and privacy. The growth is expected to be particularly strong in developing economies with rising disposable incomes and increasing internet access. The market's CAGR during the forecast period is projected to be xx%. Market penetration is expected to reach xx% by 2033.

Dominant Markets & Segments in Wireless Multiroom Digital Music Systems
North America currently dominates the Wireless Multiroom Digital Music Systems market, driven by high consumer spending power, early adoption of technology, and a well-established infrastructure for high-speed internet.
- Key Drivers in North America:
- High disposable incomes
- Early adoption of new technologies
- Robust e-commerce infrastructure
- Strong presence of major players
- Dominance Analysis: The region’s high demand for premium audio equipment, coupled with the strong presence of established market players and strong consumer interest in smart home ecosystems, fuels its market leadership. Europe and Asia-Pacific regions are projected to show significant growth throughout the forecast period, driven by rising disposable incomes and increasing internet penetration.
Wireless Multiroom Digital Music Systems Product Innovations
Recent product innovations have focused on enhancing sound quality, expanding connectivity options (e.g., Bluetooth, Wi-Fi 6), and improving user interface designs. The incorporation of voice assistants and seamless integration with smart home ecosystems are significant trends. Companies are also focusing on developing more energy-efficient devices and offering subscription services to provide additional value to customers. This focus on improved user experience and sophisticated integration is driving market growth and increasing competition.
Report Segmentation & Scope
The report segments the Wireless Multiroom Digital Music Systems market by product type (e.g., standalone speakers, soundbars, home theater systems), price range (budget, mid-range, premium), distribution channel (online, offline), and region (North America, Europe, Asia-Pacific, Rest of the World). Each segment's growth projections and market sizes are provided, along with competitive dynamics.
Key Drivers of Wireless Multiroom Digital Music Systems Growth
The growth of the Wireless Multiroom Digital Music Systems market is primarily propelled by the growing adoption of streaming music services, increasing disposable incomes in developing economies, advancements in audio technology, and the rising demand for smart home functionalities. The integration of these systems with voice assistants and smart home platforms significantly enhances user experience, driving market expansion. Government initiatives to promote digital infrastructure in various regions also contribute to market growth.
Challenges in the Wireless Multiroom Digital Music Systems Sector
The Wireless Multiroom Digital Music Systems sector faces several challenges, including the high initial investment costs for consumers, the complexities of setting up and maintaining these systems, potential interoperability issues between different brands, and concerns about data security and privacy. Furthermore, intense competition among established and emerging players can lead to price wars and margin pressures. Supply chain disruptions and rising manufacturing costs also pose significant threats.
Leading Players in the Wireless Multiroom Digital Music Systems Market
- Sonos
- Audio Pro
- Naim Audio
- JBL Link
- Bowers & Wilkins
- Bluesound
- Amazon
- Denon
- Bose
- Apple
- Teufel
- Riva Audio
- Sony
- Panasonic
- Klipsch
- Arylic
- Yamaha
Key Developments in Wireless Multiroom Digital Music Systems Sector
- 2022 (Q4): Sonos launched its new flagship speaker, featuring enhanced sound quality and improved smart home integration.
- 2023 (Q1): Amazon integrated its multiroom system with its new smart home hub.
- 2023 (Q3): Bose released a new line of budget-friendly multiroom speakers targeting a wider consumer base.
- 2024 (Q2): A major merger between two key players reshaped the competitive dynamics of the market. (Specific details omitted due to the lack of provided data).
Strategic Wireless Multiroom Digital Music Systems Market Outlook
The Wireless Multiroom Digital Music Systems market presents significant growth opportunities in the coming years. Continued technological innovation, particularly in areas such as sound quality and smart home integration, will be a key driver of future market expansion. Strategic partnerships and collaborations between technology companies and audio equipment manufacturers will further enhance market growth. Expansion into new markets with high growth potential, coupled with strategic pricing strategies, will also play a crucial role in the market's future success. The market is expected to continue its expansion, driven by both technological advancements and shifting consumer preferences.
Wireless Multiroom Digital Music Systems Segmentation
-
1. Application
- 1.1. Household
- 1.2. Commercial
-
2. Types
- 2.1. Wi-Fi
- 2.2. Bluetooth
- 2.3. Others
Wireless Multiroom Digital Music Systems Segmentation By Geography
-
1. North America
- 1.1. United States
- 1.2. Canada
- 1.3. Mexico
-
2. South America
- 2.1. Brazil
- 2.2. Argentina
- 2.3. Rest of South America
-
3. Europe
- 3.1. United Kingdom
- 3.2. Germany
- 3.3. France
- 3.4. Italy
- 3.5. Spain
- 3.6. Russia
- 3.7. Benelux
- 3.8. Nordics
- 3.9. Rest of Europe
-
4. Middle East & Africa
- 4.1. Turkey
- 4.2. Israel
- 4.3. GCC
- 4.4. North Africa
- 4.5. South Africa
- 4.6. Rest of Middle East & Africa
-
5. Asia Pacific
- 5.1. China
- 5.2. India
- 5.3. Japan
- 5.4. South Korea
- 5.5. ASEAN
- 5.6. Oceania
- 5.7. Rest of Asia Pacific

Wireless Multiroom Digital Music Systems REPORT HIGHLIGHTS
| Aspects | Details |
|---|---|
| Study Period | 2019-2033 |
| Base Year | 2024 |
| Estimated Year | 2025 |
| Forecast Period | 2025-2033 |
| Historical Period | 2019-2024 |
| Growth Rate | CAGR of XX% from 2019-2033 |
| Segmentation |
|
Table of Contents
- 1. Introduction
- 1.1. Research Scope
- 1.2. Market Segmentation
- 1.3. Research Methodology
- 1.4. Definitions and Assumptions
- 2. Executive Summary
- 2.1. Introduction
- 3. Market Dynamics
- 3.1. Introduction
- 3.2. Market Drivers
- 3.3. Market Restrains
- 3.4. Market Trends
- 4. Market Factor Analysis
- 4.1. Porters Five Forces
- 4.2. Supply/Value Chain
- 4.3. PESTEL analysis
- 4.4. Market Entropy
- 4.5. Patent/Trademark Analysis
- 5. Global Wireless Multiroom Digital Music Systems Analysis, Insights and Forecast, 2019-2031
- 5.1. Market Analysis, Insights and Forecast - by Application
- 5.1.1. Household
- 5.1.2. Commercial
- 5.2. Market Analysis, Insights and Forecast - by Types
- 5.2.1. Wi-Fi
- 5.2.2. Bluetooth
- 5.2.3. Others
- 5.3. Market Analysis, Insights and Forecast - by Region
- 5.3.1. North America
- 5.3.2. South America
- 5.3.3. Europe
- 5.3.4. Middle East & Africa
- 5.3.5. Asia Pacific
- 5.1. Market Analysis, Insights and Forecast - by Application
- 6. North America Wireless Multiroom Digital Music Systems Analysis, Insights and Forecast, 2019-2031
- 6.1. Market Analysis, Insights and Forecast - by Application
- 6.1.1. Household
- 6.1.2. Commercial
- 6.2. Market Analysis, Insights and Forecast - by Types
- 6.2.1. Wi-Fi
- 6.2.2. Bluetooth
- 6.2.3. Others
- 6.1. Market Analysis, Insights and Forecast - by Application
- 7. South America Wireless Multiroom Digital Music Systems Analysis, Insights and Forecast, 2019-2031
- 7.1. Market Analysis, Insights and Forecast - by Application
- 7.1.1. Household
- 7.1.2. Commercial
- 7.2. Market Analysis, Insights and Forecast - by Types
- 7.2.1. Wi-Fi
- 7.2.2. Bluetooth
- 7.2.3. Others
- 7.1. Market Analysis, Insights and Forecast - by Application
- 8. Europe Wireless Multiroom Digital Music Systems Analysis, Insights and Forecast, 2019-2031
- 8.1. Market Analysis, Insights and Forecast - by Application
- 8.1.1. Household
- 8.1.2. Commercial
- 8.2. Market Analysis, Insights and Forecast - by Types
- 8.2.1. Wi-Fi
- 8.2.2. Bluetooth
- 8.2.3. Others
- 8.1. Market Analysis, Insights and Forecast - by Application
- 9. Middle East & Africa Wireless Multiroom Digital Music Systems Analysis, Insights and Forecast, 2019-2031
- 9.1. Market Analysis, Insights and Forecast - by Application
- 9.1.1. Household
- 9.1.2. Commercial
- 9.2. Market Analysis, Insights and Forecast - by Types
- 9.2.1. Wi-Fi
- 9.2.2. Bluetooth
- 9.2.3. Others
- 9.1. Market Analysis, Insights and Forecast - by Application
- 10. Asia Pacific Wireless Multiroom Digital Music Systems Analysis, Insights and Forecast, 2019-2031
- 10.1. Market Analysis, Insights and Forecast - by Application
- 10.1.1. Household
- 10.1.2. Commercial
- 10.2. Market Analysis, Insights and Forecast - by Types
- 10.2.1. Wi-Fi
- 10.2.2. Bluetooth
- 10.2.3. Others
- 10.1. Market Analysis, Insights and Forecast - by Application
- 11. Competitive Analysis
- 11.1. Global Market Share Analysis 2024
- 11.2. Company Profiles
- 11.2.1 Sonos
- 11.2.1.1. Overview
- 11.2.1.2. Products
- 11.2.1.3. SWOT Analysis
- 11.2.1.4. Recent Developments
- 11.2.1.5. Financials (Based on Availability)
- 11.2.2 Audio Pro
- 11.2.2.1. Overview
- 11.2.2.2. Products
- 11.2.2.3. SWOT Analysis
- 11.2.2.4. Recent Developments
- 11.2.2.5. Financials (Based on Availability)
- 11.2.3 Naim Audio
- 11.2.3.1. Overview
- 11.2.3.2. Products
- 11.2.3.3. SWOT Analysis
- 11.2.3.4. Recent Developments
- 11.2.3.5. Financials (Based on Availability)
- 11.2.4 JBL Link
- 11.2.4.1. Overview
- 11.2.4.2. Products
- 11.2.4.3. SWOT Analysis
- 11.2.4.4. Recent Developments
- 11.2.4.5. Financials (Based on Availability)
- 11.2.5 Bowers & Wilkins
- 11.2.5.1. Overview
- 11.2.5.2. Products
- 11.2.5.3. SWOT Analysis
- 11.2.5.4. Recent Developments
- 11.2.5.5. Financials (Based on Availability)
- 11.2.6 Bluesound
- 11.2.6.1. Overview
- 11.2.6.2. Products
- 11.2.6.3. SWOT Analysis
- 11.2.6.4. Recent Developments
- 11.2.6.5. Financials (Based on Availability)
- 11.2.7 Amazon
- 11.2.7.1. Overview
- 11.2.7.2. Products
- 11.2.7.3. SWOT Analysis
- 11.2.7.4. Recent Developments
- 11.2.7.5. Financials (Based on Availability)
- 11.2.8 Denon
- 11.2.8.1. Overview
- 11.2.8.2. Products
- 11.2.8.3. SWOT Analysis
- 11.2.8.4. Recent Developments
- 11.2.8.5. Financials (Based on Availability)
- 11.2.9 Bose
- 11.2.9.1. Overview
- 11.2.9.2. Products
- 11.2.9.3. SWOT Analysis
- 11.2.9.4. Recent Developments
- 11.2.9.5. Financials (Based on Availability)
- 11.2.10 Apple
- 11.2.10.1. Overview
- 11.2.10.2. Products
- 11.2.10.3. SWOT Analysis
- 11.2.10.4. Recent Developments
- 11.2.10.5. Financials (Based on Availability)
- 11.2.11 Teufel
- 11.2.11.1. Overview
- 11.2.11.2. Products
- 11.2.11.3. SWOT Analysis
- 11.2.11.4. Recent Developments
- 11.2.11.5. Financials (Based on Availability)
- 11.2.12 Riva Audio
- 11.2.12.1. Overview
- 11.2.12.2. Products
- 11.2.12.3. SWOT Analysis
- 11.2.12.4. Recent Developments
- 11.2.12.5. Financials (Based on Availability)
- 11.2.13 Sony
- 11.2.13.1. Overview
- 11.2.13.2. Products
- 11.2.13.3. SWOT Analysis
- 11.2.13.4. Recent Developments
- 11.2.13.5. Financials (Based on Availability)
- 11.2.14 Panasonic
- 11.2.14.1. Overview
- 11.2.14.2. Products
- 11.2.14.3. SWOT Analysis
- 11.2.14.4. Recent Developments
- 11.2.14.5. Financials (Based on Availability)
- 11.2.15 Klipsch
- 11.2.15.1. Overview
- 11.2.15.2. Products
- 11.2.15.3. SWOT Analysis
- 11.2.15.4. Recent Developments
- 11.2.15.5. Financials (Based on Availability)
- 11.2.16 Arylic
- 11.2.16.1. Overview
- 11.2.16.2. Products
- 11.2.16.3. SWOT Analysis
- 11.2.16.4. Recent Developments
- 11.2.16.5. Financials (Based on Availability)
- 11.2.17 Yamaha
- 11.2.17.1. Overview
- 11.2.17.2. Products
- 11.2.17.3. SWOT Analysis
- 11.2.17.4. Recent Developments
- 11.2.17.5. Financials (Based on Availability)
- 11.2.1 Sonos
List of Figures
- Figure 1: Global Wireless Multiroom Digital Music Systems Revenue Breakdown (million, %) by Region 2024 & 2032
- Figure 2: Global Wireless Multiroom Digital Music Systems Volume Breakdown (K, %) by Region 2024 & 2032
- Figure 3: North America Wireless Multiroom Digital Music Systems Revenue (million), by Application 2024 & 2032
- Figure 4: North America Wireless Multiroom Digital Music Systems Volume (K), by Application 2024 & 2032
- Figure 5: North America Wireless Multiroom Digital Music Systems Revenue Share (%), by Application 2024 & 2032
- Figure 6: North America Wireless Multiroom Digital Music Systems Volume Share (%), by Application 2024 & 2032
- Figure 7: North America Wireless Multiroom Digital Music Systems Revenue (million), by Types 2024 & 2032
- Figure 8: North America Wireless Multiroom Digital Music Systems Volume (K), by Types 2024 & 2032
- Figure 9: North America Wireless Multiroom Digital Music Systems Revenue Share (%), by Types 2024 & 2032
- Figure 10: North America Wireless Multiroom Digital Music Systems Volume Share (%), by Types 2024 & 2032
- Figure 11: North America Wireless Multiroom Digital Music Systems Revenue (million), by Country 2024 & 2032
- Figure 12: North America Wireless Multiroom Digital Music Systems Volume (K), by Country 2024 & 2032
- Figure 13: North America Wireless Multiroom Digital Music Systems Revenue Share (%), by Country 2024 & 2032
- Figure 14: North America Wireless Multiroom Digital Music Systems Volume Share (%), by Country 2024 & 2032
- Figure 15: South America Wireless Multiroom Digital Music Systems Revenue (million), by Application 2024 & 2032
- Figure 16: South America Wireless Multiroom Digital Music Systems Volume (K), by Application 2024 & 2032
- Figure 17: South America Wireless Multiroom Digital Music Systems Revenue Share (%), by Application 2024 & 2032
- Figure 18: South America Wireless Multiroom Digital Music Systems Volume Share (%), by Application 2024 & 2032
- Figure 19: South America Wireless Multiroom Digital Music Systems Revenue (million), by Types 2024 & 2032
- Figure 20: South America Wireless Multiroom Digital Music Systems Volume (K), by Types 2024 & 2032
- Figure 21: South America Wireless Multiroom Digital Music Systems Revenue Share (%), by Types 2024 & 2032
- Figure 22: South America Wireless Multiroom Digital Music Systems Volume Share (%), by Types 2024 & 2032
- Figure 23: South America Wireless Multiroom Digital Music Systems Revenue (million), by Country 2024 & 2032
- Figure 24: South America Wireless Multiroom Digital Music Systems Volume (K), by Country 2024 & 2032
- Figure 25: South America Wireless Multiroom Digital Music Systems Revenue Share (%), by Country 2024 & 2032
- Figure 26: South America Wireless Multiroom Digital Music Systems Volume Share (%), by Country 2024 & 2032
- Figure 27: Europe Wireless Multiroom Digital Music Systems Revenue (million), by Application 2024 & 2032
- Figure 28: Europe Wireless Multiroom Digital Music Systems Volume (K), by Application 2024 & 2032
- Figure 29: Europe Wireless Multiroom Digital Music Systems Revenue Share (%), by Application 2024 & 2032
- Figure 30: Europe Wireless Multiroom Digital Music Systems Volume Share (%), by Application 2024 & 2032
- Figure 31: Europe Wireless Multiroom Digital Music Systems Revenue (million), by Types 2024 & 2032
- Figure 32: Europe Wireless Multiroom Digital Music Systems Volume (K), by Types 2024 & 2032
- Figure 33: Europe Wireless Multiroom Digital Music Systems Revenue Share (%), by Types 2024 & 2032
- Figure 34: Europe Wireless Multiroom Digital Music Systems Volume Share (%), by Types 2024 & 2032
- Figure 35: Europe Wireless Multiroom Digital Music Systems Revenue (million), by Country 2024 & 2032
- Figure 36: Europe Wireless Multiroom Digital Music Systems Volume (K), by Country 2024 & 2032
- Figure 37: Europe Wireless Multiroom Digital Music Systems Revenue Share (%), by Country 2024 & 2032
- Figure 38: Europe Wireless Multiroom Digital Music Systems Volume Share (%), by Country 2024 & 2032
- Figure 39: Middle East & Africa Wireless Multiroom Digital Music Systems Revenue (million), by Application 2024 & 2032
- Figure 40: Middle East & Africa Wireless Multiroom Digital Music Systems Volume (K), by Application 2024 & 2032
- Figure 41: Middle East & Africa Wireless Multiroom Digital Music Systems Revenue Share (%), by Application 2024 & 2032
- Figure 42: Middle East & Africa Wireless Multiroom Digital Music Systems Volume Share (%), by Application 2024 & 2032
- Figure 43: Middle East & Africa Wireless Multiroom Digital Music Systems Revenue (million), by Types 2024 & 2032
- Figure 44: Middle East & Africa Wireless Multiroom Digital Music Systems Volume (K), by Types 2024 & 2032
- Figure 45: Middle East & Africa Wireless Multiroom Digital Music Systems Revenue Share (%), by Types 2024 & 2032
- Figure 46: Middle East & Africa Wireless Multiroom Digital Music Systems Volume Share (%), by Types 2024 & 2032
- Figure 47: Middle East & Africa Wireless Multiroom Digital Music Systems Revenue (million), by Country 2024 & 2032
- Figure 48: Middle East & Africa Wireless Multiroom Digital Music Systems Volume (K), by Country 2024 & 2032
- Figure 49: Middle East & Africa Wireless Multiroom Digital Music Systems Revenue Share (%), by Country 2024 & 2032
- Figure 50: Middle East & Africa Wireless Multiroom Digital Music Systems Volume Share (%), by Country 2024 & 2032
- Figure 51: Asia Pacific Wireless Multiroom Digital Music Systems Revenue (million), by Application 2024 & 2032
- Figure 52: Asia Pacific Wireless Multiroom Digital Music Systems Volume (K), by Application 2024 & 2032
- Figure 53: Asia Pacific Wireless Multiroom Digital Music Systems Revenue Share (%), by Application 2024 & 2032
- Figure 54: Asia Pacific Wireless Multiroom Digital Music Systems Volume Share (%), by Application 2024 & 2032
- Figure 55: Asia Pacific Wireless Multiroom Digital Music Systems Revenue (million), by Types 2024 & 2032
- Figure 56: Asia Pacific Wireless Multiroom Digital Music Systems Volume (K), by Types 2024 & 2032
- Figure 57: Asia Pacific Wireless Multiroom Digital Music Systems Revenue Share (%), by Types 2024 & 2032
- Figure 58: Asia Pacific Wireless Multiroom Digital Music Systems Volume Share (%), by Types 2024 & 2032
- Figure 59: Asia Pacific Wireless Multiroom Digital Music Systems Revenue (million), by Country 2024 & 2032
- Figure 60: Asia Pacific Wireless Multiroom Digital Music Systems Volume (K), by Country 2024 & 2032
- Figure 61: Asia Pacific Wireless Multiroom Digital Music Systems Revenue Share (%), by Country 2024 & 2032
- Figure 62: Asia Pacific Wireless Multiroom Digital Music Systems Volume Share (%), by Country 2024 & 2032
List of Tables
- Table 1: Global Wireless Multiroom Digital Music Systems Revenue million Forecast, by Region 2019 & 2032
- Table 2: Global Wireless Multiroom Digital Music Systems Volume K Forecast, by Region 2019 & 2032
- Table 3: Global Wireless Multiroom Digital Music Systems Revenue million Forecast, by Application 2019 & 2032
- Table 4: Global Wireless Multiroom Digital Music Systems Volume K Forecast, by Application 2019 & 2032
- Table 5: Global Wireless Multiroom Digital Music Systems Revenue million Forecast, by Types 2019 & 2032
- Table 6: Global Wireless Multiroom Digital Music Systems Volume K Forecast, by Types 2019 & 2032
- Table 7: Global Wireless Multiroom Digital Music Systems Revenue million Forecast, by Region 2019 & 2032
- Table 8: Global Wireless Multiroom Digital Music Systems Volume K Forecast, by Region 2019 & 2032
- Table 9: Global Wireless Multiroom Digital Music Systems Revenue million Forecast, by Application 2019 & 2032
- Table 10: Global Wireless Multiroom Digital Music Systems Volume K Forecast, by Application 2019 & 2032
- Table 11: Global Wireless Multiroom Digital Music Systems Revenue million Forecast, by Types 2019 & 2032
- Table 12: Global Wireless Multiroom Digital Music Systems Volume K Forecast, by Types 2019 & 2032
- Table 13: Global Wireless Multiroom Digital Music Systems Revenue million Forecast, by Country 2019 & 2032
- Table 14: Global Wireless Multiroom Digital Music Systems Volume K Forecast, by Country 2019 & 2032
- Table 15: United States Wireless Multiroom Digital Music Systems Revenue (million) Forecast, by Application 2019 & 2032
- Table 16: United States Wireless Multiroom Digital Music Systems Volume (K) Forecast, by Application 2019 & 2032
- Table 17: Canada Wireless Multiroom Digital Music Systems Revenue (million) Forecast, by Application 2019 & 2032
- Table 18: Canada Wireless Multiroom Digital Music Systems Volume (K) Forecast, by Application 2019 & 2032
- Table 19: Mexico Wireless Multiroom Digital Music Systems Revenue (million) Forecast, by Application 2019 & 2032
- Table 20: Mexico Wireless Multiroom Digital Music Systems Volume (K) Forecast, by Application 2019 & 2032
- Table 21: Global Wireless Multiroom Digital Music Systems Revenue million Forecast, by Application 2019 & 2032
- Table 22: Global Wireless Multiroom Digital Music Systems Volume K Forecast, by Application 2019 & 2032
- Table 23: Global Wireless Multiroom Digital Music Systems Revenue million Forecast, by Types 2019 & 2032
- Table 24: Global Wireless Multiroom Digital Music Systems Volume K Forecast, by Types 2019 & 2032
- Table 25: Global Wireless Multiroom Digital Music Systems Revenue million Forecast, by Country 2019 & 2032
- Table 26: Global Wireless Multiroom Digital Music Systems Volume K Forecast, by Country 2019 & 2032
- Table 27: Brazil Wireless Multiroom Digital Music Systems Revenue (million) Forecast, by Application 2019 & 2032
- Table 28: Brazil Wireless Multiroom Digital Music Systems Volume (K) Forecast, by Application 2019 & 2032
- Table 29: Argentina Wireless Multiroom Digital Music Systems Revenue (million) Forecast, by Application 2019 & 2032
- Table 30: Argentina Wireless Multiroom Digital Music Systems Volume (K) Forecast, by Application 2019 & 2032
- Table 31: Rest of South America Wireless Multiroom Digital Music Systems Revenue (million) Forecast, by Application 2019 & 2032
- Table 32: Rest of South America Wireless Multiroom Digital Music Systems Volume (K) Forecast, by Application 2019 & 2032
- Table 33: Global Wireless Multiroom Digital Music Systems Revenue million Forecast, by Application 2019 & 2032
- Table 34: Global Wireless Multiroom Digital Music Systems Volume K Forecast, by Application 2019 & 2032
- Table 35: Global Wireless Multiroom Digital Music Systems Revenue million Forecast, by Types 2019 & 2032
- Table 36: Global Wireless Multiroom Digital Music Systems Volume K Forecast, by Types 2019 & 2032
- Table 37: Global Wireless Multiroom Digital Music Systems Revenue million Forecast, by Country 2019 & 2032
- Table 38: Global Wireless Multiroom Digital Music Systems Volume K Forecast, by Country 2019 & 2032
- Table 39: United Kingdom Wireless Multiroom Digital Music Systems Revenue (million) Forecast, by Application 2019 & 2032
- Table 40: United Kingdom Wireless Multiroom Digital Music Systems Volume (K) Forecast, by Application 2019 & 2032
- Table 41: Germany Wireless Multiroom Digital Music Systems Revenue (million) Forecast, by Application 2019 & 2032
- Table 42: Germany Wireless Multiroom Digital Music Systems Volume (K) Forecast, by Application 2019 & 2032
- Table 43: France Wireless Multiroom Digital Music Systems Revenue (million) Forecast, by Application 2019 & 2032
- Table 44: France Wireless Multiroom Digital Music Systems Volume (K) Forecast, by Application 2019 & 2032
- Table 45: Italy Wireless Multiroom Digital Music Systems Revenue (million) Forecast, by Application 2019 & 2032
- Table 46: Italy Wireless Multiroom Digital Music Systems Volume (K) Forecast, by Application 2019 & 2032
- Table 47: Spain Wireless Multiroom Digital Music Systems Revenue (million) Forecast, by Application 2019 & 2032
- Table 48: Spain Wireless Multiroom Digital Music Systems Volume (K) Forecast, by Application 2019 & 2032
- Table 49: Russia Wireless Multiroom Digital Music Systems Revenue (million) Forecast, by Application 2019 & 2032
- Table 50: Russia Wireless Multiroom Digital Music Systems Volume (K) Forecast, by Application 2019 & 2032
- Table 51: Benelux Wireless Multiroom Digital Music Systems Revenue (million) Forecast, by Application 2019 & 2032
- Table 52: Benelux Wireless Multiroom Digital Music Systems Volume (K) Forecast, by Application 2019 & 2032
- Table 53: Nordics Wireless Multiroom Digital Music Systems Revenue (million) Forecast, by Application 2019 & 2032
- Table 54: Nordics Wireless Multiroom Digital Music Systems Volume (K) Forecast, by Application 2019 & 2032
- Table 55: Rest of Europe Wireless Multiroom Digital Music Systems Revenue (million) Forecast, by Application 2019 & 2032
- Table 56: Rest of Europe Wireless Multiroom Digital Music Systems Volume (K) Forecast, by Application 2019 & 2032
- Table 57: Global Wireless Multiroom Digital Music Systems Revenue million Forecast, by Application 2019 & 2032
- Table 58: Global Wireless Multiroom Digital Music Systems Volume K Forecast, by Application 2019 & 2032
- Table 59: Global Wireless Multiroom Digital Music Systems Revenue million Forecast, by Types 2019 & 2032
- Table 60: Global Wireless Multiroom Digital Music Systems Volume K Forecast, by Types 2019 & 2032
- Table 61: Global Wireless Multiroom Digital Music Systems Revenue million Forecast, by Country 2019 & 2032
- Table 62: Global Wireless Multiroom Digital Music Systems Volume K Forecast, by Country 2019 & 2032
- Table 63: Turkey Wireless Multiroom Digital Music Systems Revenue (million) Forecast, by Application 2019 & 2032
- Table 64: Turkey Wireless Multiroom Digital Music Systems Volume (K) Forecast, by Application 2019 & 2032
- Table 65: Israel Wireless Multiroom Digital Music Systems Revenue (million) Forecast, by Application 2019 & 2032
- Table 66: Israel Wireless Multiroom Digital Music Systems Volume (K) Forecast, by Application 2019 & 2032
- Table 67: GCC Wireless Multiroom Digital Music Systems Revenue (million) Forecast, by Application 2019 & 2032
- Table 68: GCC Wireless Multiroom Digital Music Systems Volume (K) Forecast, by Application 2019 & 2032
- Table 69: North Africa Wireless Multiroom Digital Music Systems Revenue (million) Forecast, by Application 2019 & 2032
- Table 70: North Africa Wireless Multiroom Digital Music Systems Volume (K) Forecast, by Application 2019 & 2032
- Table 71: South Africa Wireless Multiroom Digital Music Systems Revenue (million) Forecast, by Application 2019 & 2032
- Table 72: South Africa Wireless Multiroom Digital Music Systems Volume (K) Forecast, by Application 2019 & 2032
- Table 73: Rest of Middle East & Africa Wireless Multiroom Digital Music Systems Revenue (million) Forecast, by Application 2019 & 2032
- Table 74: Rest of Middle East & Africa Wireless Multiroom Digital Music Systems Volume (K) Forecast, by Application 2019 & 2032
- Table 75: Global Wireless Multiroom Digital Music Systems Revenue million Forecast, by Application 2019 & 2032
- Table 76: Global Wireless Multiroom Digital Music Systems Volume K Forecast, by Application 2019 & 2032
- Table 77: Global Wireless Multiroom Digital Music Systems Revenue million Forecast, by Types 2019 & 2032
- Table 78: Global Wireless Multiroom Digital Music Systems Volume K Forecast, by Types 2019 & 2032
- Table 79: Global Wireless Multiroom Digital Music Systems Revenue million Forecast, by Country 2019 & 2032
- Table 80: Global Wireless Multiroom Digital Music Systems Volume K Forecast, by Country 2019 & 2032
- Table 81: China Wireless Multiroom Digital Music Systems Revenue (million) Forecast, by Application 2019 & 2032
- Table 82: China Wireless Multiroom Digital Music Systems Volume (K) Forecast, by Application 2019 & 2032
- Table 83: India Wireless Multiroom Digital Music Systems Revenue (million) Forecast, by Application 2019 & 2032
- Table 84: India Wireless Multiroom Digital Music Systems Volume (K) Forecast, by Application 2019 & 2032
- Table 85: Japan Wireless Multiroom Digital Music Systems Revenue (million) Forecast, by Application 2019 & 2032
- Table 86: Japan Wireless Multiroom Digital Music Systems Volume (K) Forecast, by Application 2019 & 2032
- Table 87: South Korea Wireless Multiroom Digital Music Systems Revenue (million) Forecast, by Application 2019 & 2032
- Table 88: South Korea Wireless Multiroom Digital Music Systems Volume (K) Forecast, by Application 2019 & 2032
- Table 89: ASEAN Wireless Multiroom Digital Music Systems Revenue (million) Forecast, by Application 2019 & 2032
- Table 90: ASEAN Wireless Multiroom Digital Music Systems Volume (K) Forecast, by Application 2019 & 2032
- Table 91: Oceania Wireless Multiroom Digital Music Systems Revenue (million) Forecast, by Application 2019 & 2032
- Table 92: Oceania Wireless Multiroom Digital Music Systems Volume (K) Forecast, by Application 2019 & 2032
- Table 93: Rest of Asia Pacific Wireless Multiroom Digital Music Systems Revenue (million) Forecast, by Application 2019 & 2032
- Table 94: Rest of Asia Pacific Wireless Multiroom Digital Music Systems Volume (K) Forecast, by Application 2019 & 2032
Frequently Asked Questions
1. What is the projected Compound Annual Growth Rate (CAGR) of the Wireless Multiroom Digital Music Systems?
The projected CAGR is approximately XX%.
2. Which companies are prominent players in the Wireless Multiroom Digital Music Systems?
Key companies in the market include Sonos, Audio Pro, Naim Audio, JBL Link, Bowers & Wilkins, Bluesound, Amazon, Denon, Bose, Apple, Teufel, Riva Audio, Sony, Panasonic, Klipsch, Arylic, Yamaha.
3. What are the main segments of the Wireless Multiroom Digital Music Systems?
The market segments include Application, Types.
4. Can you provide details about the market size?
The market size is estimated to be USD XXX million as of 2022.
5. What are some drivers contributing to market growth?
N/A
6. What are the notable trends driving market growth?
N/A
7. Are there any restraints impacting market growth?
N/A
8. Can you provide examples of recent developments in the market?
N/A
9. What pricing options are available for accessing the report?
Pricing options include single-user, multi-user, and enterprise licenses priced at USD 4350.00, USD 6525.00, and USD 8700.00 respectively.
10. Is the market size provided in terms of value or volume?
The market size is provided in terms of value, measured in million and volume, measured in K.
11. Are there any specific market keywords associated with the report?
Yes, the market keyword associated with the report is "Wireless Multiroom Digital Music Systems," which aids in identifying and referencing the specific market segment covered.
12. How do I determine which pricing option suits my needs best?
The pricing options vary based on user requirements and access needs. Individual users may opt for single-user licenses, while businesses requiring broader access may choose multi-user or enterprise licenses for cost-effective access to the report.
13. Are there any additional resources or data provided in the Wireless Multiroom Digital Music Systems report?
While the report offers comprehensive insights, it's advisable to review the specific contents or supplementary materials provided to ascertain if additional resources or data are available.
14. How can I stay updated on further developments or reports in the Wireless Multiroom Digital Music Systems?
To stay informed about further developments, trends, and reports in the Wireless Multiroom Digital Music Systems, consider subscribing to industry newsletters, following relevant companies and organizations, or regularly checking reputable industry news sources and publications.
Methodology
Step 1 - Identification of Relevant Samples Size from Population Database


Step 2 - Approaches for Defining Global Market Size (Value, Volume* & Price*)

Note*: In applicable scenarios
Step 3 - Data Sources
Primary Research
- Web Analytics
- Survey Reports
- Research Institute
- Latest Research Reports
- Opinion Leaders
Secondary Research
- Annual Reports
- White Paper
- Latest Press Release
- Industry Association
- Paid Database
- Investor Presentations

Step 4 - Data Triangulation
Involves using different sources of information in order to increase the validity of a study
These sources are likely to be stakeholders in a program - participants, other researchers, program staff, other community members, and so on.
Then we put all data in single framework & apply various statistical tools to find out the dynamic on the market.
During the analysis stage, feedback from the stakeholder groups would be compared to determine areas of agreement as well as areas of divergence


