

Key Insights
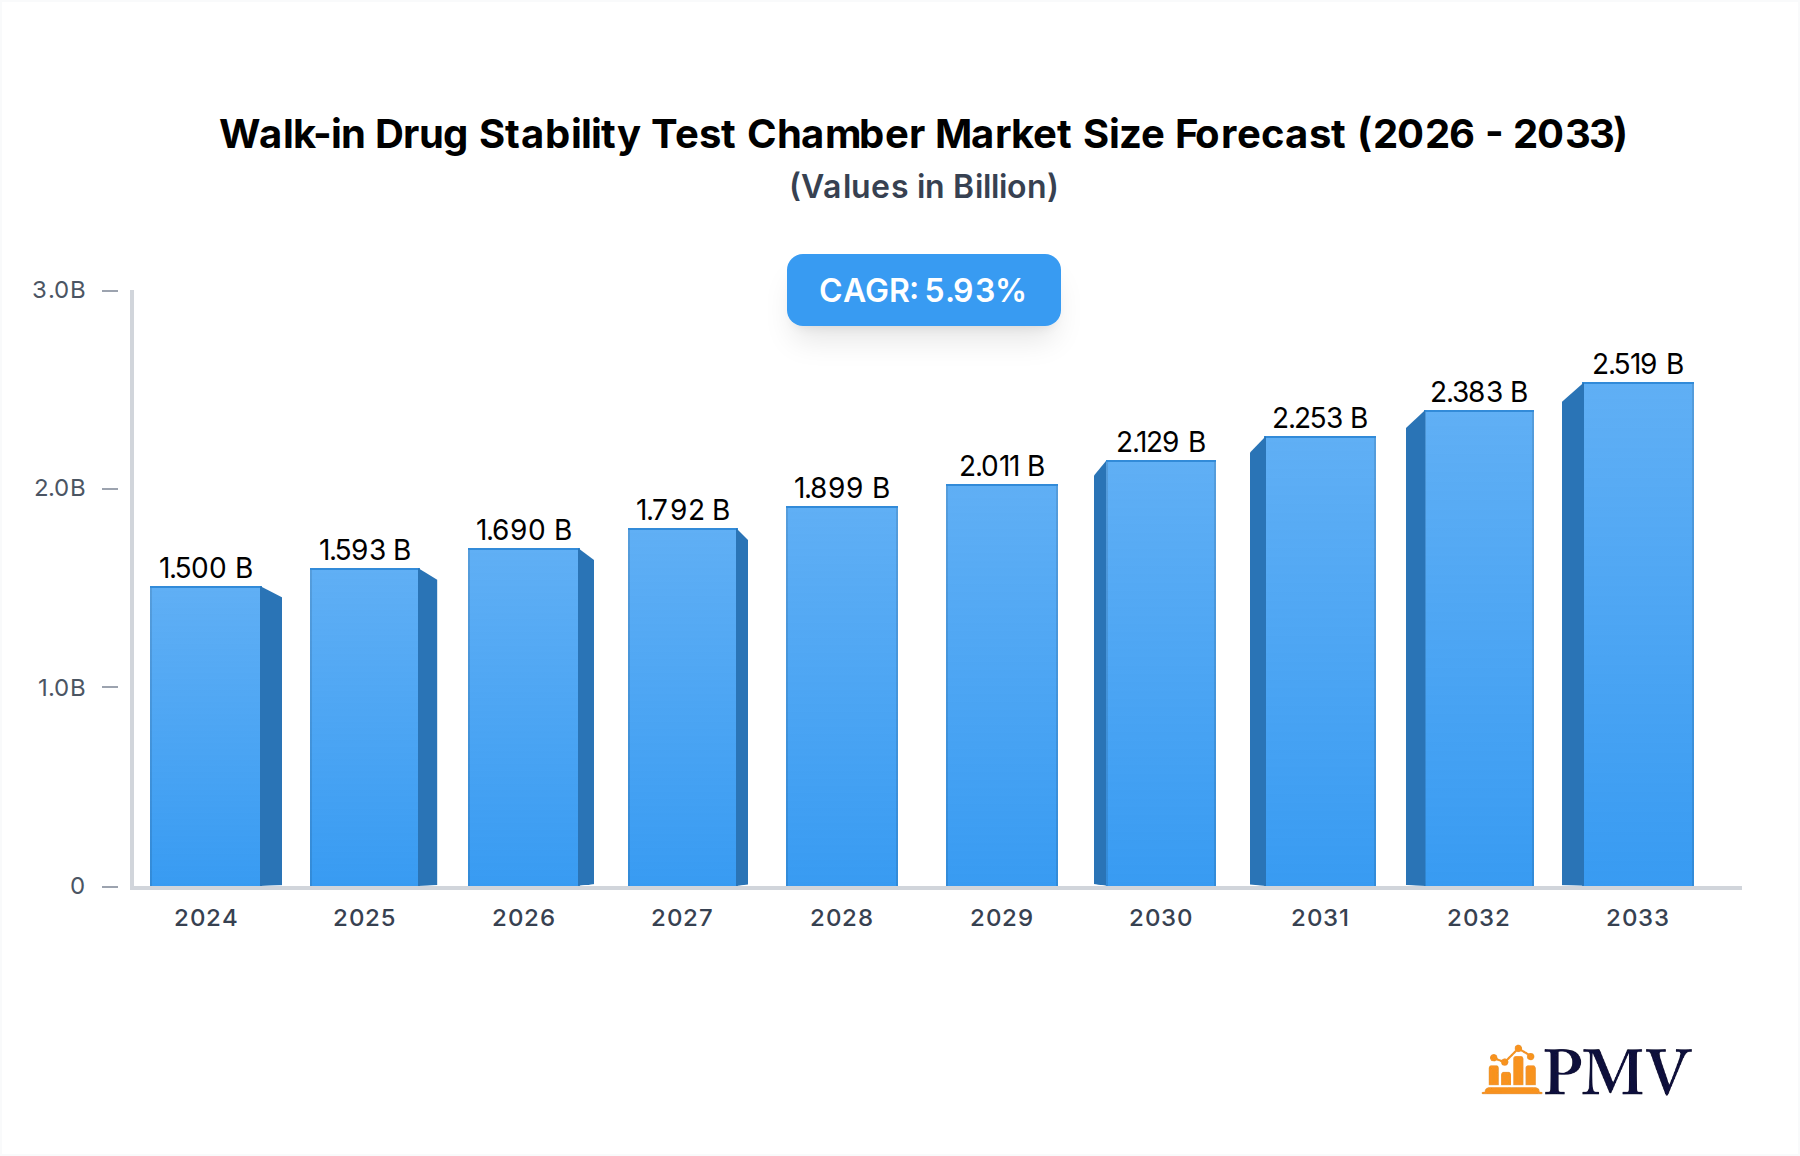
The global Walk-in Drug Stability Test Chamber market is poised for significant expansion, projected to reach an estimated USD 1.5 billion in 2024, demonstrating a robust compound annual growth rate (CAGR) of 6.2% from 2025 to 2033. This substantial growth is primarily fueled by the escalating demand for stringent drug quality and safety regulations worldwide, necessitating extensive stability testing throughout the pharmaceutical product lifecycle. The increasing complexity of drug formulations, including biologics and biosimilars, further amplifies the need for advanced and large-scale stability testing solutions offered by walk-in chambers. Life science research institutions are also contributing to market expansion, utilizing these chambers for comprehensive environmental simulations crucial for scientific discovery and development. The market is characterized by a growing preference for sophisticated chambers with advanced control systems, data logging capabilities, and validation support, reflecting the industry's commitment to compliance and data integrity.

Walk-in Drug Stability Test Chamber Market Size (In Billion)
Key market drivers include the continuous innovation in pharmaceutical research and development, leading to a pipeline of new drugs requiring extensive stability studies. Stringent regulatory guidelines from bodies like the FDA and EMA mandate thorough testing to ensure drug efficacy and safety over their intended shelf life, directly boosting demand for walk-in stability chambers. Furthermore, the expanding global pharmaceutical market, particularly in emerging economies, presents a substantial opportunity for growth. While the market benefits from these favorable trends, certain restraints such as the high initial investment cost of advanced chambers and the need for skilled personnel for operation and maintenance could moderate the pace of growth in specific segments. However, the increasing emphasis on product quality and the long-term cost-effectiveness of robust stability testing are expected to outweigh these challenges, ensuring a dynamic and expanding market landscape.
Walk-in Drug Stability Test Chamber Company Market Share
Comprehensive Walk-in Drug Stability Test Chamber Market Report: Forecasts, Trends, and Competitive Landscape (2019-2033)
This in-depth report delivers a granular analysis of the global Walk-in Drug Stability Test Chamber market, a critical component for pharmaceutical and life science industries ensuring product efficacy and shelf-life. Covering a comprehensive study period from 2019–2033, with a base year of 2025, this report provides unparalleled insights into market dynamics, competitive strategies, and future growth trajectories. We analyze the market's structure, identify dominant segments, explore groundbreaking product innovations, and highlight key growth drivers and challenges. With detailed segmentation across applications (Pharmaceuticals, Life Science Research) and types (Fixed, Mobile), this report is an indispensable resource for stakeholders seeking to navigate and capitalize on this evolving market.
Walk-in Drug Stability Test Chamber Market Structure & Competitive Dynamics
The Walk-in Drug Stability Test Chamber market exhibits a moderate to high level of concentration, with several key players like ESPEC, Thermotron, Weiss Technik, CSZ, CME, Russells Technical Products, TPS, Scientific Climate Systems, Binder, Memmert, Hastest Solutions, Kalstein, CRS Pharma Solutions, Beijing Labonce Thermostatic Technology Company, Parameter, Labtron, and BIOBASE vying for market share. Innovation ecosystems are robust, driven by the continuous need for advanced temperature and humidity control for pharmaceutical stability testing. Regulatory frameworks, particularly those from the FDA and EMA, significantly shape market entry and product development, emphasizing compliance with ICH guidelines. Product substitutes are limited due to the specialized nature of these chambers, though advanced climatic chambers and smaller-scale stability units present some indirect competition. End-user trends indicate a growing demand for larger capacity, highly automated, and energy-efficient walk-in chambers. Mergers and acquisitions (M&A) activities, though not always at billion-dollar valuations for individual deals, contribute to market consolidation. For instance, strategic acquisitions within the last five years have involved companies specializing in specialized environmental control technologies, with estimated deal values ranging from tens of millions to over 1 billion for significant integrations. The overall market share distribution sees established players holding a significant portion, with emerging companies gaining traction through niche offerings and competitive pricing, projected to be a multi-billion dollar industry by 2030.
Walk-in Drug Stability Test Chamber Industry Trends & Insights
The global Walk-in Drug Stability Test Chamber market is experiencing a robust growth trajectory, driven by an increasing global pharmaceutical production volume and a heightened emphasis on drug quality and regulatory compliance. The Compound Annual Growth Rate (CAGR) for this sector is estimated to be approximately 7.5% to 9.0% over the forecast period of 2025–2033. A primary market growth driver is the escalating demand for biologics and biosimilars, which require stringent and prolonged stability testing under controlled environmental conditions. Technological disruptions are also playing a pivotal role. Advancements in sensor technology, IoT integration for remote monitoring and data logging, and sophisticated climate control algorithms are enhancing the precision, reliability, and efficiency of walk-in chambers. Energy efficiency is another key trend, with manufacturers increasingly incorporating features like advanced insulation and optimized cooling systems to reduce operational costs for end-users. Consumer preferences are shifting towards chambers that offer greater customization, compliance with global regulatory standards (e.g., FDA 21 CFR Part 11), and enhanced data integrity. The competitive landscape is characterized by innovation in user interface design, precision environmental control, and scalability. Market penetration of advanced features is steadily increasing across both established and emerging markets. The rise of contract research organizations (CROs) and contract development and manufacturing organizations (CDMOs) also fuels demand, as these entities require extensive stability testing capabilities to serve their diverse client base. The total market value is anticipated to surpass 5 billion by 2030, reflecting sustained expansion.
Dominant Markets & Segments in Walk-in Drug Stability Test Chamber
The Pharmaceuticals segment, within the Application category, is the undisputed dominant force in the Walk-in Drug Stability Test Chamber market. This dominance is underscored by the sheer volume of drug development, manufacturing, and post-market surveillance that necessitates rigorous stability testing to ensure product safety, efficacy, and shelf-life. Economic policies globally are increasingly focused on bolstering domestic pharmaceutical manufacturing, further amplifying the demand for these critical testing chambers. Infrastructure development, particularly in emerging economies, is facilitating the establishment of new pharmaceutical R&D centers and manufacturing facilities, creating a sustained need for walk-in stability chambers.
Within the Types category, Fixed walk-in drug stability test chambers represent the larger share of the market. This preference is driven by their permanent installation, offering greater stability, larger capacity for simultaneous testing of numerous batches, and often, more robust control systems for long-term, continuous operation. The initial investment in fixed chambers is substantial, often running into several hundred thousand to over 1 billion for very large installations, but the long-term operational benefits and reliability make them the preferred choice for major pharmaceutical manufacturers and research institutions.
- Key Drivers for Pharmaceutical Dominance:
- Stringent global regulatory requirements for drug stability.
- Growing R&D investment in new drug formulations and generics.
- Increased production of biologics and vaccines requiring extensive stability studies.
- Globalization of pharmaceutical supply chains demanding consistent product quality.
- Dominance Analysis of Fixed Type:
- Higher capacity and scalability for large-scale pharmaceutical operations.
- Superior environmental control precision and long-term stability.
- Lower per-batch testing costs over the operational life of the chamber.
- Greater integration possibilities with existing manufacturing infrastructure.
Walk-in Drug Stability Test Chamber Product Innovations
Recent product innovations in the Walk-in Drug Stability Test Chamber market center on enhanced precision, energy efficiency, and smart connectivity. Manufacturers are integrating advanced PID controllers, high-accuracy sensors, and redundant systems to achieve extremely tight temperature and humidity control (e.g., ±0.5°C and ±2% RH). IoT capabilities are becoming standard, enabling remote monitoring, real-time data logging, and predictive maintenance, offering significant competitive advantages. Furthermore, the development of modular and scalable chamber designs allows pharmaceutical companies to adapt their testing facilities as their needs evolve. The competitive advantage lies in offering chambers that not only meet regulatory requirements but also optimize operational efficiency and reduce the total cost of ownership, with some advanced systems representing an investment upwards of 1 billion.
Report Segmentation & Scope
This report segments the Walk-in Drug Stability Test Chamber market into key areas for detailed analysis. The Application segmentation includes Pharmaceuticals, which encompasses drug development, quality control, and post-market surveillance, and Life Science Research, covering academic research, biotechnology, and medical device testing. The Types segmentation distinguishes between Fixed chambers, which are permanently installed and offer high capacity, and Mobile chambers, which provide flexibility for varying needs. Each segment's growth is projected based on current market penetration and anticipated demand. For the Pharmaceuticals segment, growth projections are robust, estimated at over 8.0% CAGR, driven by ongoing drug development pipelines. The Life Science Research segment, while smaller, is expected to grow at a CAGR of approximately 6.5%. The Fixed type segment is predicted to maintain a larger market share, projected at over 75% of the total market value by 2030, while Mobile units are expected to see higher percentage growth due to their flexibility.
Key Drivers of Walk-in Drug Stability Test Chamber Growth
The growth of the Walk-in Drug Stability Test Chamber market is propelled by a confluence of factors. Foremost among these is the stringent and evolving regulatory landscape governing pharmaceutical product quality and safety worldwide. Agencies like the FDA and EMA mandate comprehensive stability testing, directly increasing the demand for advanced chambers. Technological advancements, including the integration of IoT for real-time monitoring, enhanced precision in environmental control, and energy-efficient designs, are also significant drivers. Furthermore, the burgeoning global pharmaceutical market, particularly the rise of biologics and personalized medicine, necessitates extensive stability studies, contributing substantially to market expansion. The increasing outsourcing of stability testing to CROs and CDMOs also fuels demand for these specialized chambers, as these organizations expand their capabilities to meet client needs.
Challenges in the Walk-in Drug Stability Test Chamber Sector
Despite robust growth, the Walk-in Drug Stability Test Chamber sector faces several challenges. High initial capital investment remains a significant barrier for smaller research institutions and emerging pharmaceutical companies, with advanced systems costing upwards of 1 billion. Stringent regulatory compliance, while a driver, also presents a hurdle, requiring continuous investment in validation and re-validation of chambers. Supply chain disruptions, particularly for specialized components and materials, can impact manufacturing timelines and lead to increased costs. Fierce competition among established players and new entrants can also lead to price pressures. Moreover, the rapid pace of technological advancement necessitates continuous upgrades and retraining, adding to the operational burden for users.
Leading Players in the Walk-in Drug Stability Test Chamber Market
- ESPEC
- Thermotron
- Weiss Technik
- CSZ
- CME
- Russells Technical Products
- TPS
- Scientific Climate Systems
- Binder
- Memmert
- Hastest Solutions
- Kalstein
- CRS Pharma Solutions
- Beijing Labonce Thermostatic Technology Company
- Parameter
- Labtron
- BIOBASE
Key Developments in Walk-in Drug Stability Test Chamber Sector
- 2023: Launch of advanced IoT-enabled walk-in chambers offering predictive maintenance capabilities and enhanced data security features.
- 2022: Increased adoption of modular and scalable chamber designs to accommodate evolving research and manufacturing needs.
- 2021: Development of ultra-low temperature and high humidity control systems to meet the demands of novel biologic stability testing.
- 2020: Strategic partnerships between chamber manufacturers and software providers to integrate cloud-based data management solutions, facilitating global compliance.
- 2019: Introduction of enhanced energy-efficient insulation materials and refrigerant technologies to reduce operational costs and environmental impact.
Strategic Walk-in Drug Stability Test Chamber Market Outlook
The strategic outlook for the Walk-in Drug Stability Test Chamber market remains highly positive, driven by sustained global healthcare investments and a persistent focus on drug quality and safety. Growth accelerators include the expanding biologics and personalized medicine markets, which demand sophisticated and extended stability testing. Furthermore, the increasing digitalization of pharmaceutical R&D and manufacturing will drive demand for chambers with advanced connectivity and data analytics capabilities. Strategic opportunities lie in developing highly customizable solutions, offering integrated services from installation to validation, and focusing on emerging markets with growing pharmaceutical sectors. Companies that can demonstrate superior precision, reliability, and compliance with international standards, while also offering competitive total cost of ownership, are poised for significant success, with the market projected to reach valuations well into the billions.
Walk-in Drug Stability Test Chamber Segmentation
-
1. Application
- 1.1. Pharmaceuticals
- 1.2. Life Science Research
-
2. Types
- 2.1. Fixed
- 2.2. Mobile
Walk-in Drug Stability Test Chamber Segmentation By Geography
-
1. North America
- 1.1. United States
- 1.2. Canada
- 1.3. Mexico
-
2. South America
- 2.1. Brazil
- 2.2. Argentina
- 2.3. Rest of South America
-
3. Europe
- 3.1. United Kingdom
- 3.2. Germany
- 3.3. France
- 3.4. Italy
- 3.5. Spain
- 3.6. Russia
- 3.7. Benelux
- 3.8. Nordics
- 3.9. Rest of Europe
-
4. Middle East & Africa
- 4.1. Turkey
- 4.2. Israel
- 4.3. GCC
- 4.4. North Africa
- 4.5. South Africa
- 4.6. Rest of Middle East & Africa
-
5. Asia Pacific
- 5.1. China
- 5.2. India
- 5.3. Japan
- 5.4. South Korea
- 5.5. ASEAN
- 5.6. Oceania
- 5.7. Rest of Asia Pacific
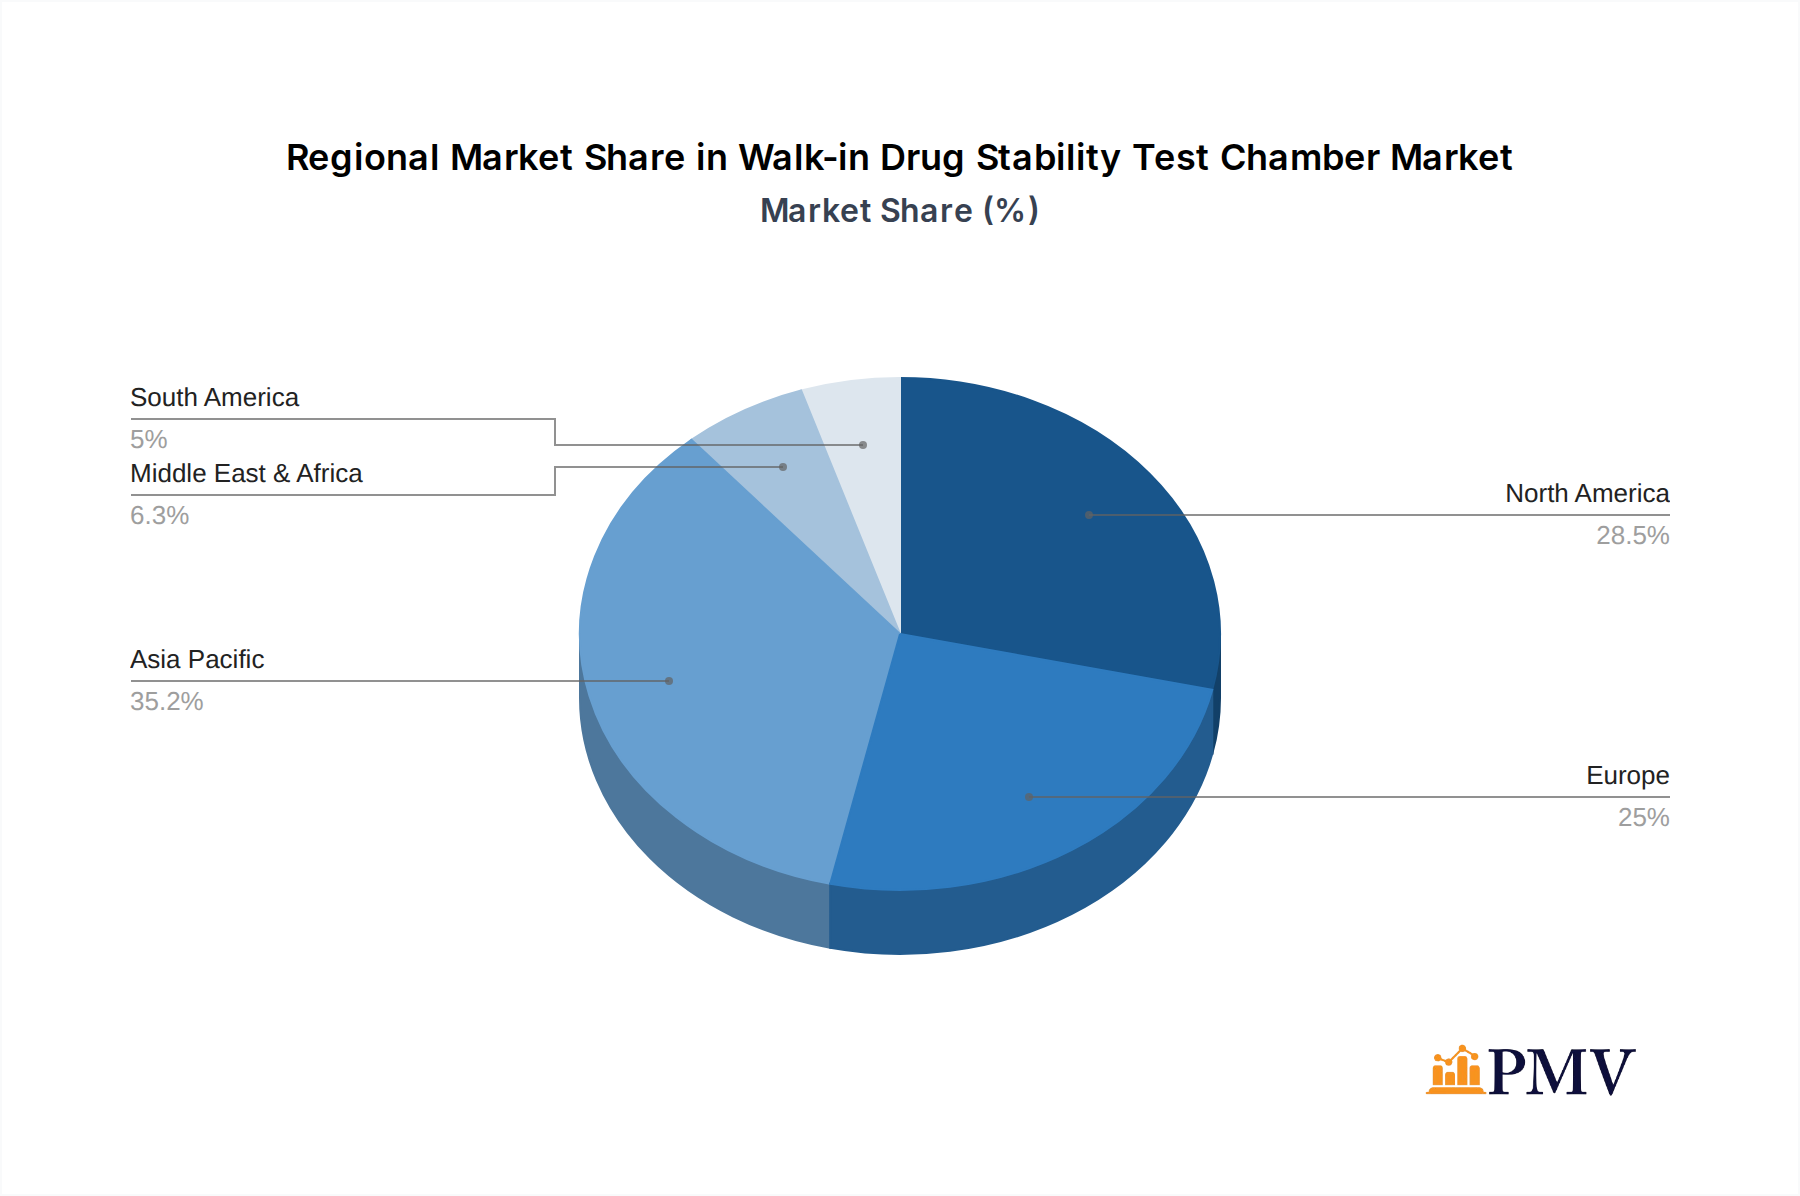
Walk-in Drug Stability Test Chamber Regional Market Share
Geographic Coverage of Walk-in Drug Stability Test Chamber
Walk-in Drug Stability Test Chamber REPORT HIGHLIGHTS
| Aspects | Details |
|---|---|
| Study Period | 2020-2034 |
| Base Year | 2025 |
| Estimated Year | 2026 |
| Forecast Period | 2026-2034 |
| Historical Period | 2020-2025 |
| Growth Rate | CAGR of 6.2% from 2020-2034 |
| Segmentation |
|
Table of Contents
- 1. Introduction
- 1.1. Research Scope
- 1.2. Market Segmentation
- 1.3. Research Objective
- 1.4. Definitions and Assumptions
- 2. Executive Summary
- 2.1. Market Snapshot
- 3. Market Dynamics
- 3.1. Market Drivers
- 3.2. Market Restrains
- 3.3. Market Trends
- 3.4. Market Opportunities
- 4. Market Factor Analysis
- 4.1. Porters Five Forces
- 4.1.1. Bargaining Power of Suppliers
- 4.1.2. Bargaining Power of Buyers
- 4.1.3. Threat of New Entrants
- 4.1.4. Threat of Substitutes
- 4.1.5. Competitive Rivalry
- 4.2. PESTEL analysis
- 4.3. BCG Analysis
- 4.3.1. Stars (High Growth, High Market Share)
- 4.3.2. Cash Cows (Low Growth, High Market Share)
- 4.3.3. Question Mark (High Growth, Low Market Share)
- 4.3.4. Dogs (Low Growth, Low Market Share)
- 4.4. Ansoff Matrix Analysis
- 4.5. Supply Chain Analysis
- 4.6. Regulatory Landscape
- 4.7. Current Market Potential and Opportunity Assessment (TAM–SAM–SOM Framework)
- 4.8. PMV Analyst Note
- 4.1. Porters Five Forces
- 5. Market Analysis, Insights and Forecast 2021-2033
- 5.1. Market Analysis, Insights and Forecast - by Application
- 5.1.1. Pharmaceuticals
- 5.1.2. Life Science Research
- 5.2. Market Analysis, Insights and Forecast - by Types
- 5.2.1. Fixed
- 5.2.2. Mobile
- 5.3. Market Analysis, Insights and Forecast - by Region
- 5.3.1. North America
- 5.3.2. South America
- 5.3.3. Europe
- 5.3.4. Middle East & Africa
- 5.3.5. Asia Pacific
- 5.1. Market Analysis, Insights and Forecast - by Application
- 6. Global Walk-in Drug Stability Test Chamber Analysis, Insights and Forecast, 2021-2033
- 6.1. Market Analysis, Insights and Forecast - by Application
- 6.1.1. Pharmaceuticals
- 6.1.2. Life Science Research
- 6.2. Market Analysis, Insights and Forecast - by Types
- 6.2.1. Fixed
- 6.2.2. Mobile
- 6.1. Market Analysis, Insights and Forecast - by Application
- 7. North America Walk-in Drug Stability Test Chamber Analysis, Insights and Forecast, 2020-2032
- 7.1. Market Analysis, Insights and Forecast - by Application
- 7.1.1. Pharmaceuticals
- 7.1.2. Life Science Research
- 7.2. Market Analysis, Insights and Forecast - by Types
- 7.2.1. Fixed
- 7.2.2. Mobile
- 7.1. Market Analysis, Insights and Forecast - by Application
- 8. South America Walk-in Drug Stability Test Chamber Analysis, Insights and Forecast, 2020-2032
- 8.1. Market Analysis, Insights and Forecast - by Application
- 8.1.1. Pharmaceuticals
- 8.1.2. Life Science Research
- 8.2. Market Analysis, Insights and Forecast - by Types
- 8.2.1. Fixed
- 8.2.2. Mobile
- 8.1. Market Analysis, Insights and Forecast - by Application
- 9. Europe Walk-in Drug Stability Test Chamber Analysis, Insights and Forecast, 2020-2032
- 9.1. Market Analysis, Insights and Forecast - by Application
- 9.1.1. Pharmaceuticals
- 9.1.2. Life Science Research
- 9.2. Market Analysis, Insights and Forecast - by Types
- 9.2.1. Fixed
- 9.2.2. Mobile
- 9.1. Market Analysis, Insights and Forecast - by Application
- 10. Middle East & Africa Walk-in Drug Stability Test Chamber Analysis, Insights and Forecast, 2020-2032
- 10.1. Market Analysis, Insights and Forecast - by Application
- 10.1.1. Pharmaceuticals
- 10.1.2. Life Science Research
- 10.2. Market Analysis, Insights and Forecast - by Types
- 10.2.1. Fixed
- 10.2.2. Mobile
- 10.1. Market Analysis, Insights and Forecast - by Application
- 11. Asia Pacific Walk-in Drug Stability Test Chamber Analysis, Insights and Forecast, 2020-2032
- 11.1. Market Analysis, Insights and Forecast - by Application
- 11.1.1. Pharmaceuticals
- 11.1.2. Life Science Research
- 11.2. Market Analysis, Insights and Forecast - by Types
- 11.2.1. Fixed
- 11.2.2. Mobile
- 11.1. Market Analysis, Insights and Forecast - by Application
- 12. Competitive Analysis
- 12.1. Company Profiles
- 12.1.1 ESPEC
- 12.1.1.1. Company Overview
- 12.1.1.2. Products
- 12.1.1.3. Company Financials
- 12.1.1.4. SWOT Analysis
- 12.1.2 Thermotron
- 12.1.2.1. Company Overview
- 12.1.2.2. Products
- 12.1.2.3. Company Financials
- 12.1.2.4. SWOT Analysis
- 12.1.3 Weiss Technik
- 12.1.3.1. Company Overview
- 12.1.3.2. Products
- 12.1.3.3. Company Financials
- 12.1.3.4. SWOT Analysis
- 12.1.4 CSZ
- 12.1.4.1. Company Overview
- 12.1.4.2. Products
- 12.1.4.3. Company Financials
- 12.1.4.4. SWOT Analysis
- 12.1.5 CME
- 12.1.5.1. Company Overview
- 12.1.5.2. Products
- 12.1.5.3. Company Financials
- 12.1.5.4. SWOT Analysis
- 12.1.6 Russells Technical Products
- 12.1.6.1. Company Overview
- 12.1.6.2. Products
- 12.1.6.3. Company Financials
- 12.1.6.4. SWOT Analysis
- 12.1.7 TPS
- 12.1.7.1. Company Overview
- 12.1.7.2. Products
- 12.1.7.3. Company Financials
- 12.1.7.4. SWOT Analysis
- 12.1.8 Scientific Climate Systems
- 12.1.8.1. Company Overview
- 12.1.8.2. Products
- 12.1.8.3. Company Financials
- 12.1.8.4. SWOT Analysis
- 12.1.9 Binder
- 12.1.9.1. Company Overview
- 12.1.9.2. Products
- 12.1.9.3. Company Financials
- 12.1.9.4. SWOT Analysis
- 12.1.10 Memmert
- 12.1.10.1. Company Overview
- 12.1.10.2. Products
- 12.1.10.3. Company Financials
- 12.1.10.4. SWOT Analysis
- 12.1.11 Hastest Solutions
- 12.1.11.1. Company Overview
- 12.1.11.2. Products
- 12.1.11.3. Company Financials
- 12.1.11.4. SWOT Analysis
- 12.1.12 Kalstein
- 12.1.12.1. Company Overview
- 12.1.12.2. Products
- 12.1.12.3. Company Financials
- 12.1.12.4. SWOT Analysis
- 12.1.13 CRS Pharma Solutions
- 12.1.13.1. Company Overview
- 12.1.13.2. Products
- 12.1.13.3. Company Financials
- 12.1.13.4. SWOT Analysis
- 12.1.14 Beijing Labonce Thermostatic Technology Company
- 12.1.14.1. Company Overview
- 12.1.14.2. Products
- 12.1.14.3. Company Financials
- 12.1.14.4. SWOT Analysis
- 12.1.15 Parameter
- 12.1.15.1. Company Overview
- 12.1.15.2. Products
- 12.1.15.3. Company Financials
- 12.1.15.4. SWOT Analysis
- 12.1.16 Labtron
- 12.1.16.1. Company Overview
- 12.1.16.2. Products
- 12.1.16.3. Company Financials
- 12.1.16.4. SWOT Analysis
- 12.1.17 BIOBASE
- 12.1.17.1. Company Overview
- 12.1.17.2. Products
- 12.1.17.3. Company Financials
- 12.1.17.4. SWOT Analysis
- 12.1.1 ESPEC
- 12.2. Market Entropy
- 12.2.1 Company's Key Areas Served
- 12.2.2 Recent Developments
- 12.3. Company Market Share Analysis 2025
- 12.3.1 Top 5 Companies Market Share Analysis
- 12.3.2 Top 3 Companies Market Share Analysis
- 12.4. List of Potential Customers
- 13. Research Methodology
List of Figures
- Figure 1: Global Walk-in Drug Stability Test Chamber Revenue Breakdown (undefined, %) by Region 2025 & 2033
- Figure 2: North America Walk-in Drug Stability Test Chamber Revenue (undefined), by Application 2025 & 2033
- Figure 3: North America Walk-in Drug Stability Test Chamber Revenue Share (%), by Application 2025 & 2033
- Figure 4: North America Walk-in Drug Stability Test Chamber Revenue (undefined), by Types 2025 & 2033
- Figure 5: North America Walk-in Drug Stability Test Chamber Revenue Share (%), by Types 2025 & 2033
- Figure 6: North America Walk-in Drug Stability Test Chamber Revenue (undefined), by Country 2025 & 2033
- Figure 7: North America Walk-in Drug Stability Test Chamber Revenue Share (%), by Country 2025 & 2033
- Figure 8: South America Walk-in Drug Stability Test Chamber Revenue (undefined), by Application 2025 & 2033
- Figure 9: South America Walk-in Drug Stability Test Chamber Revenue Share (%), by Application 2025 & 2033
- Figure 10: South America Walk-in Drug Stability Test Chamber Revenue (undefined), by Types 2025 & 2033
- Figure 11: South America Walk-in Drug Stability Test Chamber Revenue Share (%), by Types 2025 & 2033
- Figure 12: South America Walk-in Drug Stability Test Chamber Revenue (undefined), by Country 2025 & 2033
- Figure 13: South America Walk-in Drug Stability Test Chamber Revenue Share (%), by Country 2025 & 2033
- Figure 14: Europe Walk-in Drug Stability Test Chamber Revenue (undefined), by Application 2025 & 2033
- Figure 15: Europe Walk-in Drug Stability Test Chamber Revenue Share (%), by Application 2025 & 2033
- Figure 16: Europe Walk-in Drug Stability Test Chamber Revenue (undefined), by Types 2025 & 2033
- Figure 17: Europe Walk-in Drug Stability Test Chamber Revenue Share (%), by Types 2025 & 2033
- Figure 18: Europe Walk-in Drug Stability Test Chamber Revenue (undefined), by Country 2025 & 2033
- Figure 19: Europe Walk-in Drug Stability Test Chamber Revenue Share (%), by Country 2025 & 2033
- Figure 20: Middle East & Africa Walk-in Drug Stability Test Chamber Revenue (undefined), by Application 2025 & 2033
- Figure 21: Middle East & Africa Walk-in Drug Stability Test Chamber Revenue Share (%), by Application 2025 & 2033
- Figure 22: Middle East & Africa Walk-in Drug Stability Test Chamber Revenue (undefined), by Types 2025 & 2033
- Figure 23: Middle East & Africa Walk-in Drug Stability Test Chamber Revenue Share (%), by Types 2025 & 2033
- Figure 24: Middle East & Africa Walk-in Drug Stability Test Chamber Revenue (undefined), by Country 2025 & 2033
- Figure 25: Middle East & Africa Walk-in Drug Stability Test Chamber Revenue Share (%), by Country 2025 & 2033
- Figure 26: Asia Pacific Walk-in Drug Stability Test Chamber Revenue (undefined), by Application 2025 & 2033
- Figure 27: Asia Pacific Walk-in Drug Stability Test Chamber Revenue Share (%), by Application 2025 & 2033
- Figure 28: Asia Pacific Walk-in Drug Stability Test Chamber Revenue (undefined), by Types 2025 & 2033
- Figure 29: Asia Pacific Walk-in Drug Stability Test Chamber Revenue Share (%), by Types 2025 & 2033
- Figure 30: Asia Pacific Walk-in Drug Stability Test Chamber Revenue (undefined), by Country 2025 & 2033
- Figure 31: Asia Pacific Walk-in Drug Stability Test Chamber Revenue Share (%), by Country 2025 & 2033
List of Tables
- Table 1: Global Walk-in Drug Stability Test Chamber Revenue undefined Forecast, by Application 2020 & 2033
- Table 2: Global Walk-in Drug Stability Test Chamber Revenue undefined Forecast, by Types 2020 & 2033
- Table 3: Global Walk-in Drug Stability Test Chamber Revenue undefined Forecast, by Region 2020 & 2033
- Table 4: Global Walk-in Drug Stability Test Chamber Revenue undefined Forecast, by Application 2020 & 2033
- Table 5: Global Walk-in Drug Stability Test Chamber Revenue undefined Forecast, by Types 2020 & 2033
- Table 6: Global Walk-in Drug Stability Test Chamber Revenue undefined Forecast, by Country 2020 & 2033
- Table 7: United States Walk-in Drug Stability Test Chamber Revenue (undefined) Forecast, by Application 2020 & 2033
- Table 8: Canada Walk-in Drug Stability Test Chamber Revenue (undefined) Forecast, by Application 2020 & 2033
- Table 9: Mexico Walk-in Drug Stability Test Chamber Revenue (undefined) Forecast, by Application 2020 & 2033
- Table 10: Global Walk-in Drug Stability Test Chamber Revenue undefined Forecast, by Application 2020 & 2033
- Table 11: Global Walk-in Drug Stability Test Chamber Revenue undefined Forecast, by Types 2020 & 2033
- Table 12: Global Walk-in Drug Stability Test Chamber Revenue undefined Forecast, by Country 2020 & 2033
- Table 13: Brazil Walk-in Drug Stability Test Chamber Revenue (undefined) Forecast, by Application 2020 & 2033
- Table 14: Argentina Walk-in Drug Stability Test Chamber Revenue (undefined) Forecast, by Application 2020 & 2033
- Table 15: Rest of South America Walk-in Drug Stability Test Chamber Revenue (undefined) Forecast, by Application 2020 & 2033
- Table 16: Global Walk-in Drug Stability Test Chamber Revenue undefined Forecast, by Application 2020 & 2033
- Table 17: Global Walk-in Drug Stability Test Chamber Revenue undefined Forecast, by Types 2020 & 2033
- Table 18: Global Walk-in Drug Stability Test Chamber Revenue undefined Forecast, by Country 2020 & 2033
- Table 19: United Kingdom Walk-in Drug Stability Test Chamber Revenue (undefined) Forecast, by Application 2020 & 2033
- Table 20: Germany Walk-in Drug Stability Test Chamber Revenue (undefined) Forecast, by Application 2020 & 2033
- Table 21: France Walk-in Drug Stability Test Chamber Revenue (undefined) Forecast, by Application 2020 & 2033
- Table 22: Italy Walk-in Drug Stability Test Chamber Revenue (undefined) Forecast, by Application 2020 & 2033
- Table 23: Spain Walk-in Drug Stability Test Chamber Revenue (undefined) Forecast, by Application 2020 & 2033
- Table 24: Russia Walk-in Drug Stability Test Chamber Revenue (undefined) Forecast, by Application 2020 & 2033
- Table 25: Benelux Walk-in Drug Stability Test Chamber Revenue (undefined) Forecast, by Application 2020 & 2033
- Table 26: Nordics Walk-in Drug Stability Test Chamber Revenue (undefined) Forecast, by Application 2020 & 2033
- Table 27: Rest of Europe Walk-in Drug Stability Test Chamber Revenue (undefined) Forecast, by Application 2020 & 2033
- Table 28: Global Walk-in Drug Stability Test Chamber Revenue undefined Forecast, by Application 2020 & 2033
- Table 29: Global Walk-in Drug Stability Test Chamber Revenue undefined Forecast, by Types 2020 & 2033
- Table 30: Global Walk-in Drug Stability Test Chamber Revenue undefined Forecast, by Country 2020 & 2033
- Table 31: Turkey Walk-in Drug Stability Test Chamber Revenue (undefined) Forecast, by Application 2020 & 2033
- Table 32: Israel Walk-in Drug Stability Test Chamber Revenue (undefined) Forecast, by Application 2020 & 2033
- Table 33: GCC Walk-in Drug Stability Test Chamber Revenue (undefined) Forecast, by Application 2020 & 2033
- Table 34: North Africa Walk-in Drug Stability Test Chamber Revenue (undefined) Forecast, by Application 2020 & 2033
- Table 35: South Africa Walk-in Drug Stability Test Chamber Revenue (undefined) Forecast, by Application 2020 & 2033
- Table 36: Rest of Middle East & Africa Walk-in Drug Stability Test Chamber Revenue (undefined) Forecast, by Application 2020 & 2033
- Table 37: Global Walk-in Drug Stability Test Chamber Revenue undefined Forecast, by Application 2020 & 2033
- Table 38: Global Walk-in Drug Stability Test Chamber Revenue undefined Forecast, by Types 2020 & 2033
- Table 39: Global Walk-in Drug Stability Test Chamber Revenue undefined Forecast, by Country 2020 & 2033
- Table 40: China Walk-in Drug Stability Test Chamber Revenue (undefined) Forecast, by Application 2020 & 2033
- Table 41: India Walk-in Drug Stability Test Chamber Revenue (undefined) Forecast, by Application 2020 & 2033
- Table 42: Japan Walk-in Drug Stability Test Chamber Revenue (undefined) Forecast, by Application 2020 & 2033
- Table 43: South Korea Walk-in Drug Stability Test Chamber Revenue (undefined) Forecast, by Application 2020 & 2033
- Table 44: ASEAN Walk-in Drug Stability Test Chamber Revenue (undefined) Forecast, by Application 2020 & 2033
- Table 45: Oceania Walk-in Drug Stability Test Chamber Revenue (undefined) Forecast, by Application 2020 & 2033
- Table 46: Rest of Asia Pacific Walk-in Drug Stability Test Chamber Revenue (undefined) Forecast, by Application 2020 & 2033
Frequently Asked Questions
1. What is the projected Compound Annual Growth Rate (CAGR) of the Walk-in Drug Stability Test Chamber?
The projected CAGR is approximately 6.2%.
2. Which companies are prominent players in the Walk-in Drug Stability Test Chamber?
Key companies in the market include ESPEC, Thermotron, Weiss Technik, CSZ, CME, Russells Technical Products, TPS, Scientific Climate Systems, Binder, Memmert, Hastest Solutions, Kalstein, CRS Pharma Solutions, Beijing Labonce Thermostatic Technology Company, Parameter, Labtron, BIOBASE.
3. What are the main segments of the Walk-in Drug Stability Test Chamber?
The market segments include Application, Types.
4. Can you provide details about the market size?
The market size is estimated to be USD XXX N/A as of 2022.
5. What are some drivers contributing to market growth?
N/A
6. What are the notable trends driving market growth?
N/A
7. Are there any restraints impacting market growth?
N/A
8. Can you provide examples of recent developments in the market?
N/A
9. What pricing options are available for accessing the report?
Pricing options include single-user, multi-user, and enterprise licenses priced at USD 4900.00, USD 7350.00, and USD 9800.00 respectively.
10. Is the market size provided in terms of value or volume?
The market size is provided in terms of value, measured in N/A.
11. Are there any specific market keywords associated with the report?
Yes, the market keyword associated with the report is "Walk-in Drug Stability Test Chamber," which aids in identifying and referencing the specific market segment covered.
12. How do I determine which pricing option suits my needs best?
The pricing options vary based on user requirements and access needs. Individual users may opt for single-user licenses, while businesses requiring broader access may choose multi-user or enterprise licenses for cost-effective access to the report.
13. Are there any additional resources or data provided in the Walk-in Drug Stability Test Chamber report?
While the report offers comprehensive insights, it's advisable to review the specific contents or supplementary materials provided to ascertain if additional resources or data are available.
14. How can I stay updated on further developments or reports in the Walk-in Drug Stability Test Chamber?
To stay informed about further developments, trends, and reports in the Walk-in Drug Stability Test Chamber, consider subscribing to industry newsletters, following relevant companies and organizations, or regularly checking reputable industry news sources and publications.
Methodology
Step 1 - Identification of Relevant Samples Size from Population Database


Step 2 - Approaches for Defining Global Market Size (Value, Volume* & Price*)

Note*: In applicable scenarios
Step 3 - Data Sources
Primary Research
- Web Analytics
- Survey Reports
- Research Institute
- Latest Research Reports
- Opinion Leaders
Secondary Research
- Annual Reports
- White Paper
- Latest Press Release
- Industry Association
- Paid Database
- Investor Presentations

Step 4 - Data Triangulation
Involves using different sources of information in order to increase the validity of a study
These sources are likely to be stakeholders in a program - participants, other researchers, program staff, other community members, and so on.
Then we put all data in single framework & apply various statistical tools to find out the dynamic on the market.
During the analysis stage, feedback from the stakeholder groups would be compared to determine areas of agreement as well as areas of divergence