

Key Insights
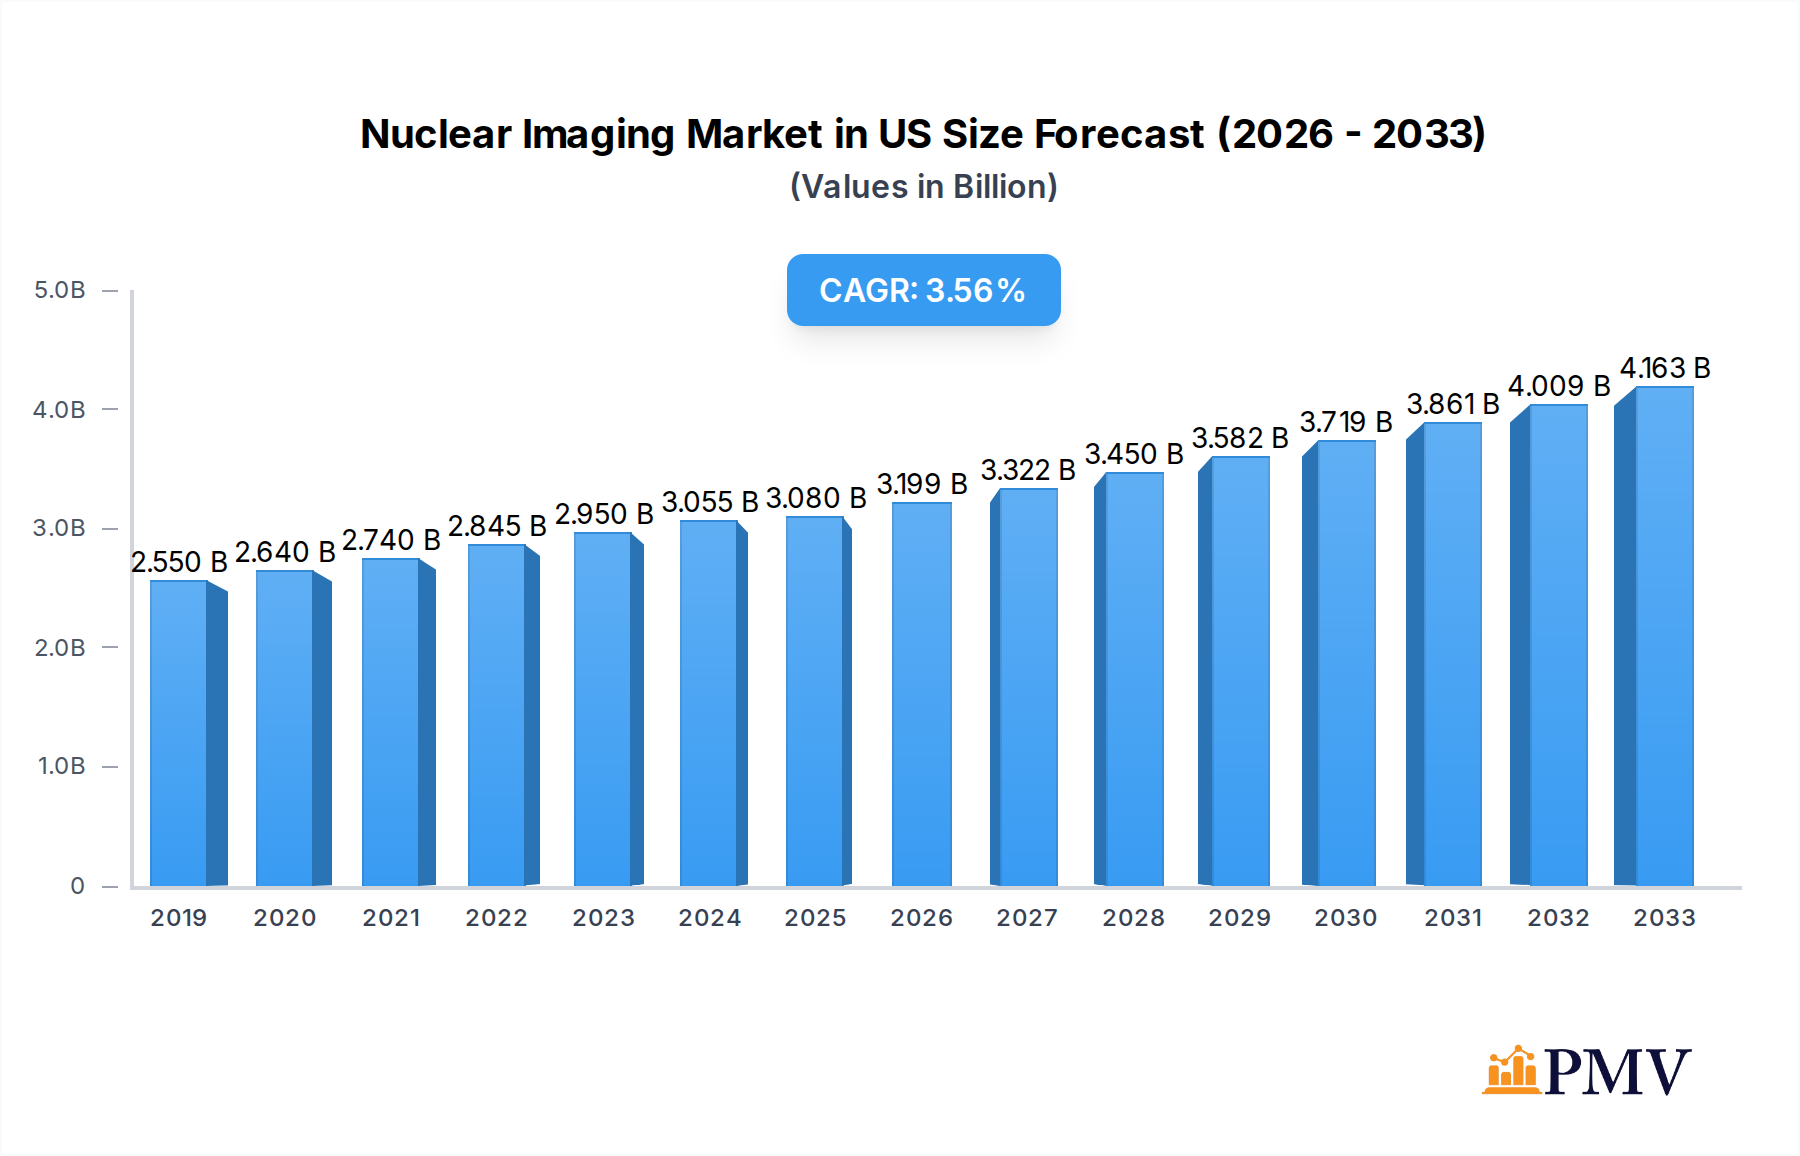
The global Nuclear Imaging market is poised for significant expansion, projected to reach a market size of $3.08 Million by 2025, with a robust Compound Annual Growth Rate (CAGR) of 3.94% throughout the forecast period of 2025-2033. This growth is primarily fueled by the increasing prevalence of chronic diseases such as cancer, cardiovascular conditions, and neurological disorders, all of which benefit immensely from the diagnostic precision offered by nuclear imaging techniques. Advancements in radiopharmaceutical development, including the creation of novel radiotracers with improved targeting capabilities and reduced radiation exposure, are also acting as significant catalysts. Furthermore, the growing adoption of hybrid imaging modalities like PET/CT and SPECT/CT, which combine anatomical and functional information for more accurate diagnoses and treatment monitoring, is driving market demand. The expansion of healthcare infrastructure, particularly in emerging economies, and increased healthcare expenditure are further bolstering market penetration.

Nuclear Imaging Market in US Market Size (In Billion)
Despite these positive drivers, certain factors could temper the market's ascent. High initial investment costs for nuclear imaging equipment and the limited availability of skilled nuclear medicine professionals in some regions may present challenges. Stringent regulatory frameworks governing the use of radioactive materials and the disposal of nuclear waste also necessitate careful compliance, adding to operational complexities. However, ongoing technological innovations, such as the development of more compact and affordable cyclotrons for on-site radioisotope production, are expected to mitigate some of these restraints. The increasing focus on personalized medicine and theranostics, where diagnostic imaging guides therapeutic interventions, represents a key emerging trend that will likely shape the future landscape of nuclear imaging. The market is segmented into equipment and diagnostic radioisotopes, with SPECT and PET radioisotopes driving advancements, and applications spanning cardiology, neurology, thyroid disorders, and oncology.
Nuclear Imaging Market in US Company Market Share
This in-depth report provides a detailed analysis of the Nuclear Imaging Market in the US, offering critical insights into market structure, industry trends, dominant segments, product innovations, key drivers, challenges, leading players, and strategic outlook. Spanning the historical period from 2019-2024, with a base year of 2025 and a forecast period extending to 2033, this report is an essential resource for stakeholders seeking to understand the dynamics of nuclear medicine, molecular imaging, and diagnostic radioisotopes within the United States.
Nuclear Imaging Market in US Market Structure & Competitive Dynamics
The US Nuclear Imaging Market is characterized by a moderately concentrated structure, with key players like Siemens Healthineers AG, GE Healthcare, and Koninklijke Philips N.V. holding significant market share. Innovation ecosystems are driven by substantial R&D investments in advanced imaging technologies, including SPECT and PET systems. Regulatory frameworks, overseen by bodies like the FDA, play a crucial role in approving new radiopharmaceuticals and imaging devices, influencing market entry and product adoption. Product substitutes, while present in broader diagnostic imaging, are less direct for the unique insights provided by nuclear imaging. End-user trends showcase a growing demand for minimally invasive diagnostic procedures and personalized medicine, directly benefiting the nuclear imaging sector. Merger and acquisition (M&A) activities, while not extensively reported for all sub-segments, are crucial for consolidation and expanding portfolios. For instance, strategic acquisitions aim to integrate advanced imaging hardware with novel diagnostic radioisotopes and AI-powered software solutions, enhancing diagnostic accuracy and efficiency. The market for SPECT radioisotopes and PET radioisotopes is particularly dynamic, driven by ongoing research into new therapeutic and diagnostic agents.
Nuclear Imaging Market in US Industry Trends & Insights
The US Nuclear Imaging Market is experiencing robust growth, projected to achieve a Compound Annual Growth Rate (CAGR) of approximately 7.5% during the forecast period of 2025-2033. This expansion is primarily fueled by an increasing prevalence of chronic diseases such as cancer, cardiovascular disorders, and neurological conditions, all of which benefit significantly from precise nuclear imaging diagnostics. Technological advancements are a major catalyst, with the development of more sensitive SPECT and PET scanners, along with novel diagnostic radioisotopes, leading to earlier and more accurate disease detection. The integration of Artificial Intelligence (AI) and machine learning in image analysis further enhances diagnostic capabilities, improving workflow efficiency and reducing interpretation times. Growing awareness among healthcare professionals and patients about the benefits of nuclear imaging for diagnosis, staging, and treatment monitoring is also a significant driver. Furthermore, favorable reimbursement policies for nuclear medicine procedures in the US contribute to increased market penetration. The shift towards personalized medicine and targeted therapies necessitates advanced imaging techniques like molecular imaging, which is intrinsically linked to the nuclear imaging market. The market for SPECT applications in cardiology and neurology, and PET applications in oncology, are witnessing substantial demand due to their proven efficacy in patient management. The growing emphasis on preventative healthcare and early disease intervention further bolsters the demand for advanced diagnostic tools, solidifying the trajectory of the US nuclear imaging market.
Dominant Markets & Segments in Nuclear Imaging Market in US
Within the Nuclear Imaging Market in the US, the Product: Equipment segment currently holds the largest market share, driven by the substantial capital investment required for advanced SPECT and PET scanners. This segment is anticipated to continue its dominance throughout the forecast period. The Diagnostic Radioisotope segment is also experiencing significant growth, particularly PET Radioisotopes like Fluorodeoxyglucose (FDG), which are integral to oncology diagnostics.
- SPECT Application (Cardiology): This sub-segment exhibits strong growth due to the high incidence of cardiovascular diseases in the US. Advanced SPECT imaging allows for non-invasive assessment of myocardial perfusion and function, crucial for diagnosing and managing heart conditions. Favorable reimbursement and the availability of advanced SPECT cameras contribute to its dominance.
- PET Application (Oncology): Oncology remains the primary application for PET imaging, with PET Radioisotopes like 18F-FDG widely used for cancer detection, staging, treatment response assessment, and recurrence monitoring. The increasing diagnosis of various cancers and the demand for precise treatment planning drive the growth of this segment. The development of novel PET tracers targeting specific cancer biomarkers further strengthens its market position.
- PET Radioisotopes: The demand for advanced PET Radioisotopes is on an upward trajectory, fueled by ongoing research into new radiotracers for various oncological, neurological, and cardiovascular applications. The development of cyclotron-based radioisotope production facilities and improved logistics for radiotracer delivery are key factors supporting this growth.
- Neurology Applications: The increasing understanding of neurological disorders and the need for early diagnosis and monitoring of conditions like Alzheimer's disease and Parkinson's disease are driving the growth of SPECT and PET applications in neurology. Advanced imaging techniques help in assessing brain metabolism and receptor binding, aiding in differential diagnosis and therapeutic interventions.
The competitive landscape within these segments is shaped by technological innovation, strategic partnerships, and regulatory approvals. The development of more sophisticated imaging equipment and targeted radiopharmaceuticals are key differentiators.
Nuclear Imaging Market in US Product Innovations
Product innovations in the US Nuclear Imaging Market are primarily focused on enhancing image resolution, reducing scan times, and developing novel radiopharmaceuticals for more targeted diagnostics. The integration of AI for image reconstruction and analysis is a significant trend, leading to improved diagnostic accuracy and workflow efficiency. advancements in detector technology and signal processing are enabling the development of hybrid imaging systems that combine PET or SPECT with CT or MRI, providing comprehensive anatomical and functional information in a single scan. The development of novel radiotracers targeting specific biomarkers for diseases like Alzheimer's and various cancers is also a key area of innovation, offering the potential for earlier and more precise diagnoses.
Report Segmentation & Scope
This report segments the Nuclear Imaging Market in the US based on Product and Application.
- Product: Equipment encompasses the advanced SPECT and PET scanners, including integrated hybrid systems, that form the backbone of nuclear imaging procedures. Growth in this segment is driven by the need for higher resolution, faster scanning, and improved patient comfort.
- Product: Diagnostic Radioisotope is further divided into SPECT Radioisotopes and PET Radioisotopes. SPECT radioisotopes, such as Technetium-99m and Iodine-123, are widely used in cardiology and neurology. PET radioisotopes, with 18F-FDG being the most prominent, are crucial for oncology and neurology. The demand for these isotopes is projected to grow due to expanding applications and the development of new radiotracers.
- Application: SPECT Application includes Cardiology, Neurology, Thyroid, and Other SPECT Applications. Cardiology and Neurology are significant growth areas, driven by the increasing burden of these diseases.
- Application: PET Application includes Oncology and Other PET Applications. Oncology remains the largest application, with continued growth expected due to advancements in cancer diagnosis and treatment.
Key Drivers of Nuclear Imaging Market in US Growth
Several factors are propelling the growth of the Nuclear Imaging Market in the US.
- Increasing prevalence of chronic diseases: The rising incidence of cancer, cardiovascular diseases, and neurological disorders necessitates advanced diagnostic tools, with nuclear imaging playing a pivotal role.
- Technological advancements: Continuous innovation in imaging hardware, software, and radiopharmaceuticals leads to improved diagnostic accuracy, earlier disease detection, and enhanced patient outcomes.
- Growing demand for personalized medicine: Nuclear imaging's ability to provide functional and metabolic information aligns perfectly with the trend towards personalized treatment strategies.
- Favorable reimbursement policies: Government and private payers in the US generally provide adequate reimbursement for nuclear imaging procedures, encouraging their adoption.
- Rising healthcare expenditure: Increased spending on healthcare infrastructure and advanced medical technologies further fuels market growth.
Challenges in the Nuclear Imaging Market in US Sector
Despite the promising growth, the US Nuclear Imaging Market faces certain challenges.
- High cost of equipment and radiopharmaceuticals: The significant capital investment required for advanced nuclear imaging systems and the complex manufacturing of radiopharmaceuticals can be a barrier for smaller healthcare providers.
- Limited availability of skilled personnel: A shortage of trained nuclear medicine technologists and radiologists can hinder the widespread adoption and efficient utilization of nuclear imaging services.
- Regulatory hurdles and complex approval processes: Obtaining regulatory approval for new radiopharmaceuticals and imaging devices can be a lengthy and resource-intensive process.
- Supply chain complexities for radiopharmaceuticals: The short half-lives of many radioisotopes require robust and efficient supply chain management, which can be challenging.
- Competition from alternative imaging modalities: While offering unique insights, nuclear imaging faces competition from other diagnostic imaging techniques like MRI and CT, particularly in certain indications.
Leading Players in the Nuclear Imaging Market in US Market
- BWX Technologies Inc
- Canon Inc (Canon Medical Systems Corporation)
- Bracco Group
- Koninklijke Philips N V
- Cardinal Health Inc
- Siemens Healthineers AG
- Novartis AG (Advanced Accelerator Applications)
- GE Healthcare
- Curium
- Fujifilm Holdings Corporation
Key Developments in Nuclear Imaging Market in US Sector
- June 2022: The Society of Nuclear Medicine and Molecular Imaging (SNMMI) established The Mars Shot Fund with a goal of generating USD 100 million to support nuclear medicine, molecular imaging, and therapeutic research. As of this development, USD 600,000 in grants and pledges had been made, with ongoing efforts to increase federal spending in this critical area.
- March 2022: Canon Medical Systems USA, Inc. (CMSU) launched the "Canon Across America" mobile tour, the first of its kind in the United States, running from March 24 to December 2, 2022. This initiative aimed to showcase cutting-edge AI medical gadgets and foster community engagement by bringing advanced diagnostic technology to hospitals and regional healthcare providers for hands-on experiences.
Strategic Nuclear Imaging Market in US Market Outlook
The strategic outlook for the Nuclear Imaging Market in the US is exceptionally positive, driven by ongoing advancements in technology and an expanding clinical utility. The increasing focus on early disease detection, personalized treatment, and theranostics will continue to fuel demand for SPECT and PET imaging. Investment in the development of novel radiotracers targeting a wider range of diseases, coupled with the widespread adoption of AI in image analysis, will further enhance diagnostic capabilities and market penetration. The growing emphasis on value-based healthcare will also favor nuclear imaging, given its ability to provide crucial diagnostic information that can lead to more effective and cost-efficient treatment decisions. Strategic collaborations between equipment manufacturers, radiopharmaceutical providers, and research institutions will be instrumental in driving innovation and expanding access to these vital diagnostic tools, ensuring sustained growth in the coming years.
Nuclear Imaging Market in US Segmentation
-
1. Product
- 1.1. Equipment
-
1.2. Diagnostic Radioisotope
- 1.2.1. SPECT Radioisotopes
- 1.2.2. PET Radioisotopes
-
2. Application
-
2.1. SPECT Application
- 2.1.1. Cardiology
- 2.1.2. Neurology
- 2.1.3. Thyroid
- 2.1.4. Other SPECT Applications
-
2.2. PET Application
- 2.2.1. Oncology
- 2.2.2. Other PET Applications
-
2.1. SPECT Application
Nuclear Imaging Market in US Segmentation By Geography
-
1. North America
- 1.1. United States
- 1.2. Canada
- 1.3. Mexico
-
2. South America
- 2.1. Brazil
- 2.2. Argentina
- 2.3. Rest of South America
-
3. Europe
- 3.1. United Kingdom
- 3.2. Germany
- 3.3. France
- 3.4. Italy
- 3.5. Spain
- 3.6. Russia
- 3.7. Benelux
- 3.8. Nordics
- 3.9. Rest of Europe
-
4. Middle East & Africa
- 4.1. Turkey
- 4.2. Israel
- 4.3. GCC
- 4.4. North Africa
- 4.5. South Africa
- 4.6. Rest of Middle East & Africa
-
5. Asia Pacific
- 5.1. China
- 5.2. India
- 5.3. Japan
- 5.4. South Korea
- 5.5. ASEAN
- 5.6. Oceania
- 5.7. Rest of Asia Pacific
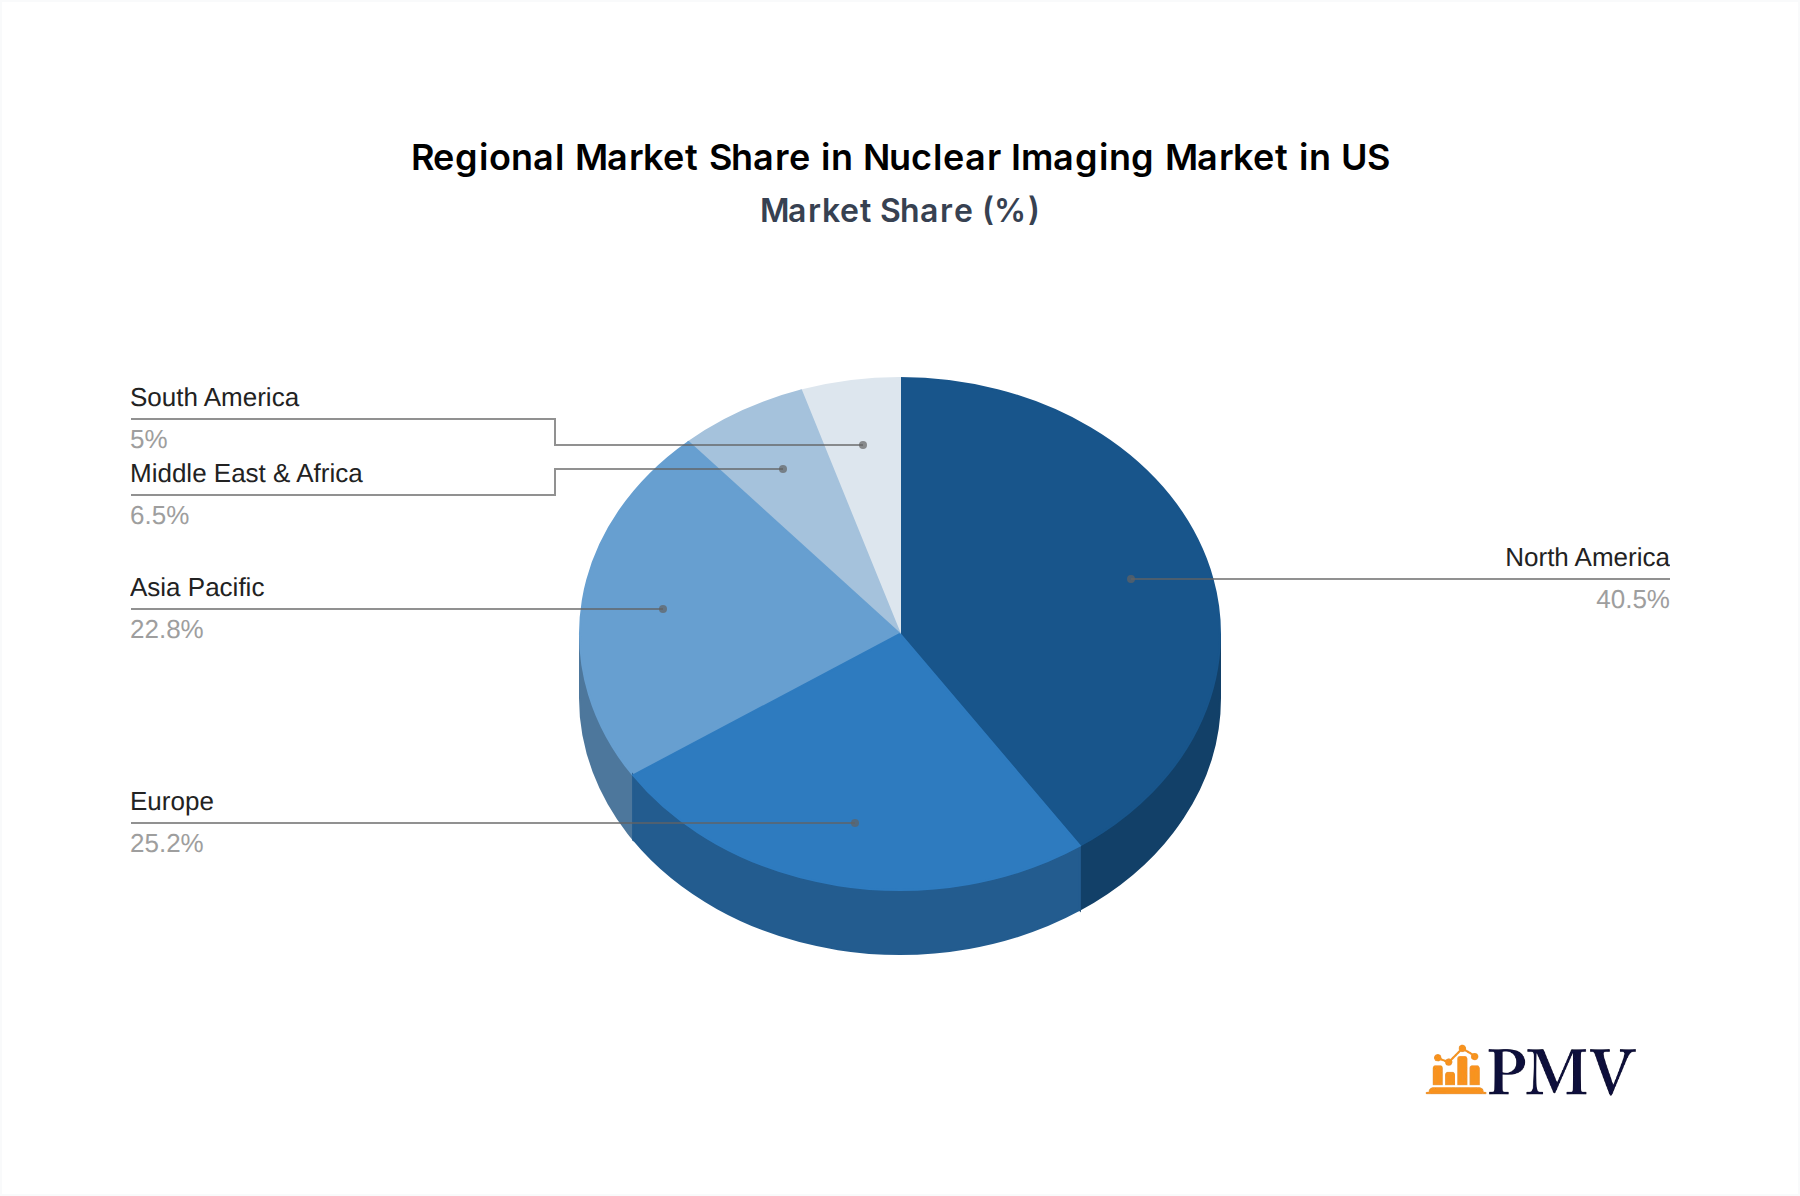
Nuclear Imaging Market in US Regional Market Share
Geographic Coverage of Nuclear Imaging Market in US
Nuclear Imaging Market in US REPORT HIGHLIGHTS
| Aspects | Details |
|---|---|
| Study Period | 2020-2034 |
| Base Year | 2025 |
| Estimated Year | 2026 |
| Forecast Period | 2026-2034 |
| Historical Period | 2020-2025 |
| Growth Rate | CAGR of 3.94% from 2020-2034 |
| Segmentation |
|
Table of Contents
- 1. Introduction
- 1.1. Research Scope
- 1.2. Market Segmentation
- 1.3. Research Objective
- 1.4. Definitions and Assumptions
- 2. Executive Summary
- 2.1. Market Snapshot
- 3. Market Dynamics
- 3.1. Market Drivers
- 3.2. Market Restrains
- 3.3. Market Trends
- 3.4. Market Opportunities
- 4. Market Factor Analysis
- 4.1. Porters Five Forces
- 4.1.1. Bargaining Power of Suppliers
- 4.1.2. Bargaining Power of Buyers
- 4.1.3. Threat of New Entrants
- 4.1.4. Threat of Substitutes
- 4.1.5. Competitive Rivalry
- 4.2. PESTEL analysis
- 4.3. BCG Analysis
- 4.3.1. Stars (High Growth, High Market Share)
- 4.3.2. Cash Cows (Low Growth, High Market Share)
- 4.3.3. Question Mark (High Growth, Low Market Share)
- 4.3.4. Dogs (Low Growth, Low Market Share)
- 4.4. Ansoff Matrix Analysis
- 4.5. Supply Chain Analysis
- 4.6. Regulatory Landscape
- 4.7. Current Market Potential and Opportunity Assessment (TAM–SAM–SOM Framework)
- 4.8. PMV Analyst Note
- 4.1. Porters Five Forces
- 5. Market Analysis, Insights and Forecast 2021-2033
- 5.1. Market Analysis, Insights and Forecast - by Product
- 5.1.1. Equipment
- 5.1.2. Diagnostic Radioisotope
- 5.1.2.1. SPECT Radioisotopes
- 5.1.2.2. PET Radioisotopes
- 5.2. Market Analysis, Insights and Forecast - by Application
- 5.2.1. SPECT Application
- 5.2.1.1. Cardiology
- 5.2.1.2. Neurology
- 5.2.1.3. Thyroid
- 5.2.1.4. Other SPECT Applications
- 5.2.2. PET Application
- 5.2.2.1. Oncology
- 5.2.2.2. Other PET Applications
- 5.2.1. SPECT Application
- 5.3. Market Analysis, Insights and Forecast - by Region
- 5.3.1. North America
- 5.3.2. South America
- 5.3.3. Europe
- 5.3.4. Middle East & Africa
- 5.3.5. Asia Pacific
- 5.1. Market Analysis, Insights and Forecast - by Product
- 6. Global Nuclear Imaging Market in US Analysis, Insights and Forecast, 2021-2033
- 6.1. Market Analysis, Insights and Forecast - by Product
- 6.1.1. Equipment
- 6.1.2. Diagnostic Radioisotope
- 6.1.2.1. SPECT Radioisotopes
- 6.1.2.2. PET Radioisotopes
- 6.2. Market Analysis, Insights and Forecast - by Application
- 6.2.1. SPECT Application
- 6.2.1.1. Cardiology
- 6.2.1.2. Neurology
- 6.2.1.3. Thyroid
- 6.2.1.4. Other SPECT Applications
- 6.2.2. PET Application
- 6.2.2.1. Oncology
- 6.2.2.2. Other PET Applications
- 6.2.1. SPECT Application
- 6.1. Market Analysis, Insights and Forecast - by Product
- 7. North America Nuclear Imaging Market in US Analysis, Insights and Forecast, 2020-2032
- 7.1. Market Analysis, Insights and Forecast - by Product
- 7.1.1. Equipment
- 7.1.2. Diagnostic Radioisotope
- 7.1.2.1. SPECT Radioisotopes
- 7.1.2.2. PET Radioisotopes
- 7.2. Market Analysis, Insights and Forecast - by Application
- 7.2.1. SPECT Application
- 7.2.1.1. Cardiology
- 7.2.1.2. Neurology
- 7.2.1.3. Thyroid
- 7.2.1.4. Other SPECT Applications
- 7.2.2. PET Application
- 7.2.2.1. Oncology
- 7.2.2.2. Other PET Applications
- 7.2.1. SPECT Application
- 7.1. Market Analysis, Insights and Forecast - by Product
- 8. South America Nuclear Imaging Market in US Analysis, Insights and Forecast, 2020-2032
- 8.1. Market Analysis, Insights and Forecast - by Product
- 8.1.1. Equipment
- 8.1.2. Diagnostic Radioisotope
- 8.1.2.1. SPECT Radioisotopes
- 8.1.2.2. PET Radioisotopes
- 8.2. Market Analysis, Insights and Forecast - by Application
- 8.2.1. SPECT Application
- 8.2.1.1. Cardiology
- 8.2.1.2. Neurology
- 8.2.1.3. Thyroid
- 8.2.1.4. Other SPECT Applications
- 8.2.2. PET Application
- 8.2.2.1. Oncology
- 8.2.2.2. Other PET Applications
- 8.2.1. SPECT Application
- 8.1. Market Analysis, Insights and Forecast - by Product
- 9. Europe Nuclear Imaging Market in US Analysis, Insights and Forecast, 2020-2032
- 9.1. Market Analysis, Insights and Forecast - by Product
- 9.1.1. Equipment
- 9.1.2. Diagnostic Radioisotope
- 9.1.2.1. SPECT Radioisotopes
- 9.1.2.2. PET Radioisotopes
- 9.2. Market Analysis, Insights and Forecast - by Application
- 9.2.1. SPECT Application
- 9.2.1.1. Cardiology
- 9.2.1.2. Neurology
- 9.2.1.3. Thyroid
- 9.2.1.4. Other SPECT Applications
- 9.2.2. PET Application
- 9.2.2.1. Oncology
- 9.2.2.2. Other PET Applications
- 9.2.1. SPECT Application
- 9.1. Market Analysis, Insights and Forecast - by Product
- 10. Middle East & Africa Nuclear Imaging Market in US Analysis, Insights and Forecast, 2020-2032
- 10.1. Market Analysis, Insights and Forecast - by Product
- 10.1.1. Equipment
- 10.1.2. Diagnostic Radioisotope
- 10.1.2.1. SPECT Radioisotopes
- 10.1.2.2. PET Radioisotopes
- 10.2. Market Analysis, Insights and Forecast - by Application
- 10.2.1. SPECT Application
- 10.2.1.1. Cardiology
- 10.2.1.2. Neurology
- 10.2.1.3. Thyroid
- 10.2.1.4. Other SPECT Applications
- 10.2.2. PET Application
- 10.2.2.1. Oncology
- 10.2.2.2. Other PET Applications
- 10.2.1. SPECT Application
- 10.1. Market Analysis, Insights and Forecast - by Product
- 11. Asia Pacific Nuclear Imaging Market in US Analysis, Insights and Forecast, 2020-2032
- 11.1. Market Analysis, Insights and Forecast - by Product
- 11.1.1. Equipment
- 11.1.2. Diagnostic Radioisotope
- 11.1.2.1. SPECT Radioisotopes
- 11.1.2.2. PET Radioisotopes
- 11.2. Market Analysis, Insights and Forecast - by Application
- 11.2.1. SPECT Application
- 11.2.1.1. Cardiology
- 11.2.1.2. Neurology
- 11.2.1.3. Thyroid
- 11.2.1.4. Other SPECT Applications
- 11.2.2. PET Application
- 11.2.2.1. Oncology
- 11.2.2.2. Other PET Applications
- 11.2.1. SPECT Application
- 11.1. Market Analysis, Insights and Forecast - by Product
- 12. Competitive Analysis
- 12.1. Company Profiles
- 12.1.1 BWX Technologies Inc
- 12.1.1.1. Company Overview
- 12.1.1.2. Products
- 12.1.1.3. Company Financials
- 12.1.1.4. SWOT Analysis
- 12.1.2 Canon Inc (Canon Medical Systems Corporation)
- 12.1.2.1. Company Overview
- 12.1.2.2. Products
- 12.1.2.3. Company Financials
- 12.1.2.4. SWOT Analysis
- 12.1.3 Bracco Group
- 12.1.3.1. Company Overview
- 12.1.3.2. Products
- 12.1.3.3. Company Financials
- 12.1.3.4. SWOT Analysis
- 12.1.4 Koninklijke Philips N V
- 12.1.4.1. Company Overview
- 12.1.4.2. Products
- 12.1.4.3. Company Financials
- 12.1.4.4. SWOT Analysis
- 12.1.5 Cardinal Health Inc
- 12.1.5.1. Company Overview
- 12.1.5.2. Products
- 12.1.5.3. Company Financials
- 12.1.5.4. SWOT Analysis
- 12.1.6 Siemens Healthineers AG
- 12.1.6.1. Company Overview
- 12.1.6.2. Products
- 12.1.6.3. Company Financials
- 12.1.6.4. SWOT Analysis
- 12.1.7 Novartis AG (Advanced Accelerator Applications)
- 12.1.7.1. Company Overview
- 12.1.7.2. Products
- 12.1.7.3. Company Financials
- 12.1.7.4. SWOT Analysis
- 12.1.8 GE Healthcare
- 12.1.8.1. Company Overview
- 12.1.8.2. Products
- 12.1.8.3. Company Financials
- 12.1.8.4. SWOT Analysis
- 12.1.9 Curium
- 12.1.9.1. Company Overview
- 12.1.9.2. Products
- 12.1.9.3. Company Financials
- 12.1.9.4. SWOT Analysis
- 12.1.10 Fujifilm Holdings Corporation
- 12.1.10.1. Company Overview
- 12.1.10.2. Products
- 12.1.10.3. Company Financials
- 12.1.10.4. SWOT Analysis
- 12.1.1 BWX Technologies Inc
- 12.2. Market Entropy
- 12.2.1 Company's Key Areas Served
- 12.2.2 Recent Developments
- 12.3. Company Market Share Analysis 2025
- 12.3.1 Top 5 Companies Market Share Analysis
- 12.3.2 Top 3 Companies Market Share Analysis
- 12.4. List of Potential Customers
- 13. Research Methodology
List of Figures
- Figure 1: Global Nuclear Imaging Market in US Revenue Breakdown (Million, %) by Region 2025 & 2033
- Figure 2: North America Nuclear Imaging Market in US Revenue (Million), by Product 2025 & 2033
- Figure 3: North America Nuclear Imaging Market in US Revenue Share (%), by Product 2025 & 2033
- Figure 4: North America Nuclear Imaging Market in US Revenue (Million), by Application 2025 & 2033
- Figure 5: North America Nuclear Imaging Market in US Revenue Share (%), by Application 2025 & 2033
- Figure 6: North America Nuclear Imaging Market in US Revenue (Million), by Country 2025 & 2033
- Figure 7: North America Nuclear Imaging Market in US Revenue Share (%), by Country 2025 & 2033
- Figure 8: South America Nuclear Imaging Market in US Revenue (Million), by Product 2025 & 2033
- Figure 9: South America Nuclear Imaging Market in US Revenue Share (%), by Product 2025 & 2033
- Figure 10: South America Nuclear Imaging Market in US Revenue (Million), by Application 2025 & 2033
- Figure 11: South America Nuclear Imaging Market in US Revenue Share (%), by Application 2025 & 2033
- Figure 12: South America Nuclear Imaging Market in US Revenue (Million), by Country 2025 & 2033
- Figure 13: South America Nuclear Imaging Market in US Revenue Share (%), by Country 2025 & 2033
- Figure 14: Europe Nuclear Imaging Market in US Revenue (Million), by Product 2025 & 2033
- Figure 15: Europe Nuclear Imaging Market in US Revenue Share (%), by Product 2025 & 2033
- Figure 16: Europe Nuclear Imaging Market in US Revenue (Million), by Application 2025 & 2033
- Figure 17: Europe Nuclear Imaging Market in US Revenue Share (%), by Application 2025 & 2033
- Figure 18: Europe Nuclear Imaging Market in US Revenue (Million), by Country 2025 & 2033
- Figure 19: Europe Nuclear Imaging Market in US Revenue Share (%), by Country 2025 & 2033
- Figure 20: Middle East & Africa Nuclear Imaging Market in US Revenue (Million), by Product 2025 & 2033
- Figure 21: Middle East & Africa Nuclear Imaging Market in US Revenue Share (%), by Product 2025 & 2033
- Figure 22: Middle East & Africa Nuclear Imaging Market in US Revenue (Million), by Application 2025 & 2033
- Figure 23: Middle East & Africa Nuclear Imaging Market in US Revenue Share (%), by Application 2025 & 2033
- Figure 24: Middle East & Africa Nuclear Imaging Market in US Revenue (Million), by Country 2025 & 2033
- Figure 25: Middle East & Africa Nuclear Imaging Market in US Revenue Share (%), by Country 2025 & 2033
- Figure 26: Asia Pacific Nuclear Imaging Market in US Revenue (Million), by Product 2025 & 2033
- Figure 27: Asia Pacific Nuclear Imaging Market in US Revenue Share (%), by Product 2025 & 2033
- Figure 28: Asia Pacific Nuclear Imaging Market in US Revenue (Million), by Application 2025 & 2033
- Figure 29: Asia Pacific Nuclear Imaging Market in US Revenue Share (%), by Application 2025 & 2033
- Figure 30: Asia Pacific Nuclear Imaging Market in US Revenue (Million), by Country 2025 & 2033
- Figure 31: Asia Pacific Nuclear Imaging Market in US Revenue Share (%), by Country 2025 & 2033
List of Tables
- Table 1: Global Nuclear Imaging Market in US Revenue Million Forecast, by Product 2020 & 2033
- Table 2: Global Nuclear Imaging Market in US Revenue Million Forecast, by Application 2020 & 2033
- Table 3: Global Nuclear Imaging Market in US Revenue Million Forecast, by Region 2020 & 2033
- Table 4: Global Nuclear Imaging Market in US Revenue Million Forecast, by Product 2020 & 2033
- Table 5: Global Nuclear Imaging Market in US Revenue Million Forecast, by Application 2020 & 2033
- Table 6: Global Nuclear Imaging Market in US Revenue Million Forecast, by Country 2020 & 2033
- Table 7: United States Nuclear Imaging Market in US Revenue (Million) Forecast, by Application 2020 & 2033
- Table 8: Canada Nuclear Imaging Market in US Revenue (Million) Forecast, by Application 2020 & 2033
- Table 9: Mexico Nuclear Imaging Market in US Revenue (Million) Forecast, by Application 2020 & 2033
- Table 10: Global Nuclear Imaging Market in US Revenue Million Forecast, by Product 2020 & 2033
- Table 11: Global Nuclear Imaging Market in US Revenue Million Forecast, by Application 2020 & 2033
- Table 12: Global Nuclear Imaging Market in US Revenue Million Forecast, by Country 2020 & 2033
- Table 13: Brazil Nuclear Imaging Market in US Revenue (Million) Forecast, by Application 2020 & 2033
- Table 14: Argentina Nuclear Imaging Market in US Revenue (Million) Forecast, by Application 2020 & 2033
- Table 15: Rest of South America Nuclear Imaging Market in US Revenue (Million) Forecast, by Application 2020 & 2033
- Table 16: Global Nuclear Imaging Market in US Revenue Million Forecast, by Product 2020 & 2033
- Table 17: Global Nuclear Imaging Market in US Revenue Million Forecast, by Application 2020 & 2033
- Table 18: Global Nuclear Imaging Market in US Revenue Million Forecast, by Country 2020 & 2033
- Table 19: United Kingdom Nuclear Imaging Market in US Revenue (Million) Forecast, by Application 2020 & 2033
- Table 20: Germany Nuclear Imaging Market in US Revenue (Million) Forecast, by Application 2020 & 2033
- Table 21: France Nuclear Imaging Market in US Revenue (Million) Forecast, by Application 2020 & 2033
- Table 22: Italy Nuclear Imaging Market in US Revenue (Million) Forecast, by Application 2020 & 2033
- Table 23: Spain Nuclear Imaging Market in US Revenue (Million) Forecast, by Application 2020 & 2033
- Table 24: Russia Nuclear Imaging Market in US Revenue (Million) Forecast, by Application 2020 & 2033
- Table 25: Benelux Nuclear Imaging Market in US Revenue (Million) Forecast, by Application 2020 & 2033
- Table 26: Nordics Nuclear Imaging Market in US Revenue (Million) Forecast, by Application 2020 & 2033
- Table 27: Rest of Europe Nuclear Imaging Market in US Revenue (Million) Forecast, by Application 2020 & 2033
- Table 28: Global Nuclear Imaging Market in US Revenue Million Forecast, by Product 2020 & 2033
- Table 29: Global Nuclear Imaging Market in US Revenue Million Forecast, by Application 2020 & 2033
- Table 30: Global Nuclear Imaging Market in US Revenue Million Forecast, by Country 2020 & 2033
- Table 31: Turkey Nuclear Imaging Market in US Revenue (Million) Forecast, by Application 2020 & 2033
- Table 32: Israel Nuclear Imaging Market in US Revenue (Million) Forecast, by Application 2020 & 2033
- Table 33: GCC Nuclear Imaging Market in US Revenue (Million) Forecast, by Application 2020 & 2033
- Table 34: North Africa Nuclear Imaging Market in US Revenue (Million) Forecast, by Application 2020 & 2033
- Table 35: South Africa Nuclear Imaging Market in US Revenue (Million) Forecast, by Application 2020 & 2033
- Table 36: Rest of Middle East & Africa Nuclear Imaging Market in US Revenue (Million) Forecast, by Application 2020 & 2033
- Table 37: Global Nuclear Imaging Market in US Revenue Million Forecast, by Product 2020 & 2033
- Table 38: Global Nuclear Imaging Market in US Revenue Million Forecast, by Application 2020 & 2033
- Table 39: Global Nuclear Imaging Market in US Revenue Million Forecast, by Country 2020 & 2033
- Table 40: China Nuclear Imaging Market in US Revenue (Million) Forecast, by Application 2020 & 2033
- Table 41: India Nuclear Imaging Market in US Revenue (Million) Forecast, by Application 2020 & 2033
- Table 42: Japan Nuclear Imaging Market in US Revenue (Million) Forecast, by Application 2020 & 2033
- Table 43: South Korea Nuclear Imaging Market in US Revenue (Million) Forecast, by Application 2020 & 2033
- Table 44: ASEAN Nuclear Imaging Market in US Revenue (Million) Forecast, by Application 2020 & 2033
- Table 45: Oceania Nuclear Imaging Market in US Revenue (Million) Forecast, by Application 2020 & 2033
- Table 46: Rest of Asia Pacific Nuclear Imaging Market in US Revenue (Million) Forecast, by Application 2020 & 2033
Frequently Asked Questions
1. What is the projected Compound Annual Growth Rate (CAGR) of the Nuclear Imaging Market in US?
The projected CAGR is approximately 3.94%.
2. Which companies are prominent players in the Nuclear Imaging Market in US?
Key companies in the market include BWX Technologies Inc, Canon Inc (Canon Medical Systems Corporation), Bracco Group, Koninklijke Philips N V, Cardinal Health Inc, Siemens Healthineers AG, Novartis AG (Advanced Accelerator Applications), GE Healthcare, Curium, Fujifilm Holdings Corporation.
3. What are the main segments of the Nuclear Imaging Market in US?
The market segments include Product, Application.
4. Can you provide details about the market size?
The market size is estimated to be USD 3.08 Million as of 2022.
5. What are some drivers contributing to market growth?
Increasing Prevalence of Chronic Diseases; Rising Geriatric Population; Increasing Technological Advancements.
6. What are the notable trends driving market growth?
Equipment Segment is Expected to Hold a Significant Market Share Over the Forecast Period.
7. Are there any restraints impacting market growth?
Lack Of Proper Reimbursement And Stringent Regulatory Approval Procedures; High Cost of Equipment.
8. Can you provide examples of recent developments in the market?
In June 2022, The Mars Shot Fund was established by the Society of Nuclear Medicine and Molecular Imaging (SNMMI) as a campaign to generate USD 100 million to support nuclear medicine, molecular imaging, and therapeutic research. Grants and pledges of USD 600,000 have been made to the fund so far, and efforts are being made to boost federal spending on this problem.
9. What pricing options are available for accessing the report?
Pricing options include single-user, multi-user, and enterprise licenses priced at USD 3800, USD 4500, and USD 5800 respectively.
10. Is the market size provided in terms of value or volume?
The market size is provided in terms of value, measured in Million.
11. Are there any specific market keywords associated with the report?
Yes, the market keyword associated with the report is "Nuclear Imaging Market in US," which aids in identifying and referencing the specific market segment covered.
12. How do I determine which pricing option suits my needs best?
The pricing options vary based on user requirements and access needs. Individual users may opt for single-user licenses, while businesses requiring broader access may choose multi-user or enterprise licenses for cost-effective access to the report.
13. Are there any additional resources or data provided in the Nuclear Imaging Market in US report?
While the report offers comprehensive insights, it's advisable to review the specific contents or supplementary materials provided to ascertain if additional resources or data are available.
14. How can I stay updated on further developments or reports in the Nuclear Imaging Market in US?
To stay informed about further developments, trends, and reports in the Nuclear Imaging Market in US, consider subscribing to industry newsletters, following relevant companies and organizations, or regularly checking reputable industry news sources and publications.
Methodology
Step 1 - Identification of Relevant Samples Size from Population Database


Step 2 - Approaches for Defining Global Market Size (Value, Volume* & Price*)

Note*: In applicable scenarios
Step 3 - Data Sources
Primary Research
- Web Analytics
- Survey Reports
- Research Institute
- Latest Research Reports
- Opinion Leaders
Secondary Research
- Annual Reports
- White Paper
- Latest Press Release
- Industry Association
- Paid Database
- Investor Presentations

Step 4 - Data Triangulation
Involves using different sources of information in order to increase the validity of a study
These sources are likely to be stakeholders in a program - participants, other researchers, program staff, other community members, and so on.
Then we put all data in single framework & apply various statistical tools to find out the dynamic on the market.
During the analysis stage, feedback from the stakeholder groups would be compared to determine areas of agreement as well as areas of divergence