

Key Insights
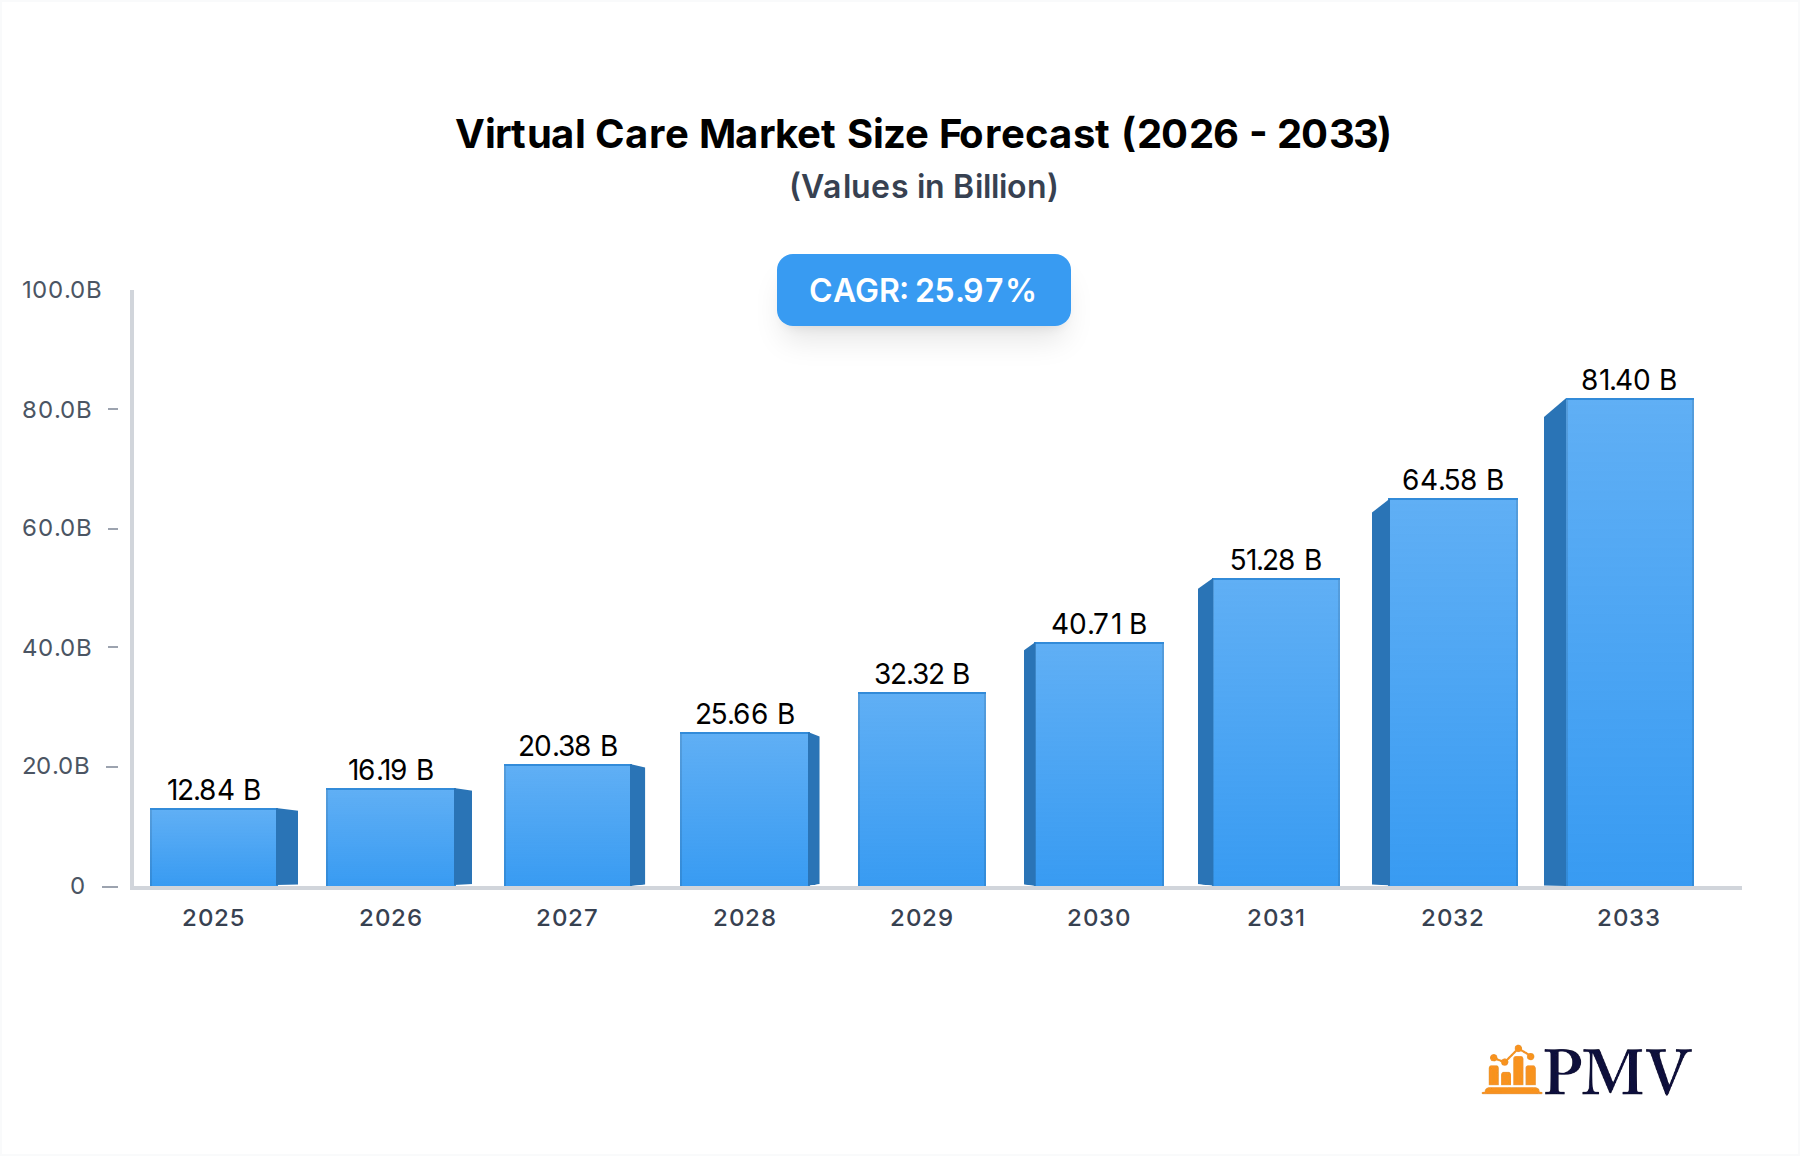
The Virtual Care Market is poised for explosive growth, projected to reach a substantial $12.84 billion by 2025, driven by a remarkable Compound Annual Growth Rate (CAGR) of 26.10% through 2033. This rapid expansion is fueled by an increasing demand for accessible, convenient, and cost-effective healthcare solutions. Key market drivers include the growing adoption of telehealth platforms by both providers and patients, advancements in digital health technologies, and the rising prevalence of chronic diseases necessitating continuous monitoring and remote consultations. The shift towards value-based care models further incentivizes the adoption of virtual care to improve patient outcomes and reduce healthcare expenditures. The COVID-19 pandemic acted as a significant catalyst, accelerating the integration of virtual care into mainstream healthcare delivery and fostering greater acceptance among all stakeholders. Emerging technologies like artificial intelligence (AI) and the Internet of Medical Things (IoMT) are expected to further enhance the capabilities of virtual care, enabling more sophisticated remote diagnostics, personalized treatment plans, and proactive health management.

Virtual Care Market Market Size (In Billion)
The market is segmented across various modes of delivery, including video, audio, and messaging, with solutions and services forming the core components. Home healthcare, hospitals, and other healthcare settings represent the primary end-user segments, all benefiting from the enhanced reach and efficiency of virtual care. Geographically, North America is anticipated to lead the market, owing to well-established healthcare infrastructure, high internet penetration, and supportive regulatory frameworks. However, the Asia Pacific region is projected to witness the fastest growth, propelled by increasing investments in digital health infrastructure, a large and growing population, and a rising awareness of remote healthcare options. While the market benefits from numerous opportunities, challenges such as data privacy concerns, regulatory hurdles in certain regions, and the digital divide may present some restraints. Nevertheless, the overarching trend towards digitalization in healthcare and the inherent advantages of virtual care in expanding access and improving efficiency are expected to propel sustained, robust market expansion.
Virtual Care Market Company Market Share
This detailed report offers an in-depth analysis of the global Virtual Care Market, providing critical insights into market dynamics, growth trajectories, and competitive landscapes. Covering the period from 2019 to 2033, with a base year of 2025, this research is essential for stakeholders seeking to understand the evolving telehealth market, remote patient monitoring, and digital health solutions. The report examines virtual consultations, telemedicine services, and the integration of AI in healthcare.
Virtual Care Market Market Structure & Competitive Dynamics
The Virtual Care Market is characterized by a dynamic and evolving structure, with increasing market concentration driven by strategic acquisitions and partnerships. Key players like Teladoc Health Inc., American Well Corporation, and CVS Health are at the forefront, leveraging their expansive service portfolios and technological advancements. Innovation ecosystems are thriving, fueled by significant investments in digital health startups and the development of advanced virtual care platforms. Regulatory frameworks, while becoming more supportive of telehealth, continue to shape market entry and operational strategies. Product substitutes, such as traditional in-person healthcare, are being increasingly challenged by the convenience and cost-effectiveness of virtual care solutions. End-user trends highlight a growing demand for accessible, on-demand healthcare, particularly in home healthcare settings. M&A activities are robust, with deal values often in the hundreds of millions of dollars, as larger entities seek to consolidate market share and acquire innovative technologies. For example, the acquisition of Livongo by Teladoc Health Inc. for approximately $18.5 Billion underscored the consolidation trend. Market share is fragmented but consolidating around major providers.
Virtual Care Market Industry Trends & Insights
The Virtual Care Market is poised for exponential growth, driven by a confluence of factors including technological advancements, evolving consumer preferences, and supportive regulatory environments. The Compound Annual Growth Rate (CAGR) is projected to be significant, estimated at xx% for the forecast period. Market penetration is rapidly increasing as healthcare providers and payers recognize the efficiency and scalability of telehealth solutions. Key growth drivers include the increasing prevalence of chronic diseases, the need for remote patient monitoring, and the demand for convenient healthcare access, especially in underserved areas. Technological disruptions, such as the integration of Artificial Intelligence (AI) for diagnostics and personalized treatment plans, are transforming the virtual care experience. Consumer preferences are shifting towards services that offer immediate access to care, reduced wait times, and improved management of health conditions from the comfort of their homes. The COVID-19 pandemic acted as a major catalyst, accelerating the adoption of virtual health services and paving the way for sustained growth. The market's expansion is also fueled by investments in advanced telemedicine platforms and the development of integrated digital health ecosystems. The ongoing digital transformation within the healthcare industry is a fundamental trend supporting the widespread adoption of virtual care services.
Dominant Markets & Segments in Virtual Care Market
The Virtual Care Market exhibits distinct regional and segmental dominance. North America, particularly the United States, remains the leading region due to early adoption rates, robust technological infrastructure, and favorable reimbursement policies. Within North America, the Video mode of delivery holds significant market share, offering the most comprehensive virtual interaction and diagnostic capabilities, followed by Audio and Messaging. In terms of Components, Solutions encompassing software platforms and AI-driven tools are driving market expansion, closely trailed by Services such as remote monitoring and virtual consultations. The Home Healthcare end-user segment is experiencing rapid growth, driven by the increasing aging population, the desire for convenient care, and the benefits of remote patient monitoring. However, Hospitals are also increasingly integrating virtual care into their service offerings to enhance patient reach and manage resources effectively. Economic policies that incentivize telehealth adoption and infrastructure development supporting broadband connectivity are critical drivers for regional dominance. The increasing demand for chronic care management and post-operative care delivered remotely further solidifies the position of the Home Healthcare segment. The integration of AI-powered diagnostic tools within virtual care solutions is also contributing to the dominance of the Solutions segment.
Virtual Care Market Product Innovations
Product innovations in the Virtual Care Market are focused on enhancing patient experience, improving diagnostic accuracy, and increasing operational efficiency. This includes the development of AI-powered diagnostic tools, advanced remote patient monitoring devices, and integrated telehealth platforms that offer seamless patient-provider communication. Applications range from chronic disease management and mental health support to urgent care and post-operative follow-ups. These innovations provide a significant competitive advantage by offering personalized care, reducing healthcare costs, and improving patient outcomes.
Report Segmentation & Scope
The Virtual Care Market is segmented across various dimensions to provide a granular understanding of its landscape.
- Mode of Delivery: This includes Video, offering rich interaction; Audio, for consultations where visual cues are less critical; and Messaging, for asynchronous communication and quick queries.
- Component: This encompasses Solutions, such as software platforms and AI tools, and Services, including virtual consultations and remote monitoring.
- End Users: Key segments are Home Healthcare, catering to patients at home; Hospitals, integrating virtual care into clinical workflows; and Others, including clinics, employer wellness programs, and direct-to-consumer services.
Each segment is projected to experience significant growth, with specific market sizes and competitive dynamics detailed within the report.
Key Drivers of Virtual Care Market Growth
Several pivotal factors are propelling the Virtual Care Market forward.
- Technological Advancements: The proliferation of high-speed internet, smartphones, and wearable devices facilitates seamless telehealth delivery. AI and machine learning are enhancing diagnostic capabilities and personalizing patient care.
- Increasing Healthcare Costs: Virtual care offers a cost-effective alternative to traditional in-person visits, making healthcare more accessible.
- Growing Demand for Convenience and Accessibility: Patients increasingly prefer the ease and flexibility of receiving care remotely, avoiding travel and long wait times.
- Favorable Regulatory Landscape: Evolving government policies and reimbursement models are supporting the widespread adoption and integration of telemedicine services.
- Prevalence of Chronic Diseases: The need for continuous monitoring and management of chronic conditions makes virtual care an ideal solution for ongoing patient support.
Challenges in the Virtual Care Market Sector
Despite its rapid growth, the Virtual Care Market faces several challenges.
- Regulatory Hurdles: Variations in state and federal regulations regarding licensing, prescribing, and reimbursement can create complexities for providers operating across different jurisdictions.
- Data Security and Privacy Concerns: Ensuring the robust security of sensitive patient data transmitted and stored through virtual platforms is paramount and requires continuous investment in cybersecurity measures.
- Digital Divide: Limited access to reliable internet connectivity and digital literacy among certain populations can hinder equitable access to virtual care services.
- Reimbursement Uncertainty: While improving, inconsistencies in reimbursement rates and policies across different payers can impact the financial sustainability of virtual care providers.
- Integration with Existing Healthcare Infrastructure: Seamless integration of virtual care platforms with existing electronic health records (EHRs) and hospital systems remains a technical and operational challenge.
Leading Players in the Virtual Care Market Market
- American Well Corporation
- Oracle Corporation (Cerner)
- Teladoc Health Inc.
- United HealthCare Services Inc.
- MDLIVE
- Medocity Inc.
- Amazon com Inc.
- General Electric Company
- VirtualHealth
- CVS Health
Key Developments in Virtual Care Market Sector
- May 2022: CVS Health launched CVS Health Virtual Primary Care for its CVS Caremark members, offering on-demand virtual links to primary care providers, urgent care, chronic care management, and behavioral care services.
- November 2021: TalktoMira, Inc. launched four new virtual care services via the Mira Health App, enabling members 24/7/365 access to virtual urgent care and connecting with providers nationwide.
Strategic Virtual Care Market Market Outlook
The future outlook for the Virtual Care Market is exceptionally bright, characterized by continuous innovation and strategic expansion. Growth accelerators include the increasing integration of AI for predictive analytics and personalized medicine, the expansion of virtual reality (VR) and augmented reality (AR) in healthcare training and remote procedures, and the growing demand for specialized virtual care services in areas like mental health and chronic disease management. Partnerships between technology providers, healthcare systems, and insurance companies will further drive market penetration. The ongoing shift towards value-based care models will also favor the efficiency and cost-effectiveness of virtual solutions. This robust ecosystem is set to redefine healthcare delivery, making it more accessible, efficient, and patient-centric globally.
Virtual Care Market Segmentation
-
1. Mode of Delivery
- 1.1. Video
- 1.2. Audio
- 1.3. Messaging
-
2. Component
- 2.1. Solutions
- 2.2. Services
-
3. End Users
- 3.1. Home Healthcare
- 3.2. Hospitals
- 3.3. Others
Virtual Care Market Segmentation By Geography
-
1. North America
- 1.1. United States
- 1.2. Canada
- 1.3. Mexico
-
2. Europe
- 2.1. Germany
- 2.2. United Kingdom
- 2.3. France
- 2.4. Italy
- 2.5. Spain
- 2.6. Rest of Europe
-
3. Asia Pacific
- 3.1. China
- 3.2. Japan
- 3.3. India
- 3.4. Australia
- 3.5. South Korea
- 3.6. Rest of Asia Pacific
-
4. Middle East and Africa
- 4.1. GCC
- 4.2. South Africa
- 4.3. Rest of Middle East and Africa
-
5. South America
- 5.1. Brazil
- 5.2. Argentina
- 5.3. Rest of South America

Virtual Care Market Regional Market Share
Geographic Coverage of Virtual Care Market
Virtual Care Market REPORT HIGHLIGHTS
| Aspects | Details |
|---|---|
| Study Period | 2020-2034 |
| Base Year | 2025 |
| Estimated Year | 2026 |
| Forecast Period | 2026-2034 |
| Historical Period | 2020-2025 |
| Growth Rate | CAGR of 26.10% from 2020-2034 |
| Segmentation |
|
Table of Contents
- 1. Introduction
- 1.1. Research Scope
- 1.2. Market Segmentation
- 1.3. Research Objective
- 1.4. Definitions and Assumptions
- 2. Executive Summary
- 2.1. Market Snapshot
- 3. Market Dynamics
- 3.1. Market Drivers
- 3.2. Market Restrains
- 3.3. Market Trends
- 3.4. Market Opportunities
- 4. Market Factor Analysis
- 4.1. Porters Five Forces
- 4.1.1. Bargaining Power of Suppliers
- 4.1.2. Bargaining Power of Buyers
- 4.1.3. Threat of New Entrants
- 4.1.4. Threat of Substitutes
- 4.1.5. Competitive Rivalry
- 4.2. PESTEL analysis
- 4.3. BCG Analysis
- 4.3.1. Stars (High Growth, High Market Share)
- 4.3.2. Cash Cows (Low Growth, High Market Share)
- 4.3.3. Question Mark (High Growth, Low Market Share)
- 4.3.4. Dogs (Low Growth, Low Market Share)
- 4.4. Ansoff Matrix Analysis
- 4.5. Supply Chain Analysis
- 4.6. Regulatory Landscape
- 4.7. Current Market Potential and Opportunity Assessment (TAM–SAM–SOM Framework)
- 4.8. PMV Analyst Note
- 4.1. Porters Five Forces
- 5. Market Analysis, Insights and Forecast 2021-2033
- 5.1. Market Analysis, Insights and Forecast - by Mode of Delivery
- 5.1.1. Video
- 5.1.2. Audio
- 5.1.3. Messaging
- 5.2. Market Analysis, Insights and Forecast - by Component
- 5.2.1. Solutions
- 5.2.2. Services
- 5.3. Market Analysis, Insights and Forecast - by End Users
- 5.3.1. Home Healthcare
- 5.3.2. Hospitals
- 5.3.3. Others
- 5.4. Market Analysis, Insights and Forecast - by Region
- 5.4.1. North America
- 5.4.2. Europe
- 5.4.3. Asia Pacific
- 5.4.4. Middle East and Africa
- 5.4.5. South America
- 5.1. Market Analysis, Insights and Forecast - by Mode of Delivery
- 6. Global Virtual Care Market Analysis, Insights and Forecast, 2021-2033
- 6.1. Market Analysis, Insights and Forecast - by Mode of Delivery
- 6.1.1. Video
- 6.1.2. Audio
- 6.1.3. Messaging
- 6.2. Market Analysis, Insights and Forecast - by Component
- 6.2.1. Solutions
- 6.2.2. Services
- 6.3. Market Analysis, Insights and Forecast - by End Users
- 6.3.1. Home Healthcare
- 6.3.2. Hospitals
- 6.3.3. Others
- 6.1. Market Analysis, Insights and Forecast - by Mode of Delivery
- 7. North America Virtual Care Market Analysis, Insights and Forecast, 2020-2032
- 7.1. Market Analysis, Insights and Forecast - by Mode of Delivery
- 7.1.1. Video
- 7.1.2. Audio
- 7.1.3. Messaging
- 7.2. Market Analysis, Insights and Forecast - by Component
- 7.2.1. Solutions
- 7.2.2. Services
- 7.3. Market Analysis, Insights and Forecast - by End Users
- 7.3.1. Home Healthcare
- 7.3.2. Hospitals
- 7.3.3. Others
- 7.1. Market Analysis, Insights and Forecast - by Mode of Delivery
- 8. Europe Virtual Care Market Analysis, Insights and Forecast, 2020-2032
- 8.1. Market Analysis, Insights and Forecast - by Mode of Delivery
- 8.1.1. Video
- 8.1.2. Audio
- 8.1.3. Messaging
- 8.2. Market Analysis, Insights and Forecast - by Component
- 8.2.1. Solutions
- 8.2.2. Services
- 8.3. Market Analysis, Insights and Forecast - by End Users
- 8.3.1. Home Healthcare
- 8.3.2. Hospitals
- 8.3.3. Others
- 8.1. Market Analysis, Insights and Forecast - by Mode of Delivery
- 9. Asia Pacific Virtual Care Market Analysis, Insights and Forecast, 2020-2032
- 9.1. Market Analysis, Insights and Forecast - by Mode of Delivery
- 9.1.1. Video
- 9.1.2. Audio
- 9.1.3. Messaging
- 9.2. Market Analysis, Insights and Forecast - by Component
- 9.2.1. Solutions
- 9.2.2. Services
- 9.3. Market Analysis, Insights and Forecast - by End Users
- 9.3.1. Home Healthcare
- 9.3.2. Hospitals
- 9.3.3. Others
- 9.1. Market Analysis, Insights and Forecast - by Mode of Delivery
- 10. Middle East and Africa Virtual Care Market Analysis, Insights and Forecast, 2020-2032
- 10.1. Market Analysis, Insights and Forecast - by Mode of Delivery
- 10.1.1. Video
- 10.1.2. Audio
- 10.1.3. Messaging
- 10.2. Market Analysis, Insights and Forecast - by Component
- 10.2.1. Solutions
- 10.2.2. Services
- 10.3. Market Analysis, Insights and Forecast - by End Users
- 10.3.1. Home Healthcare
- 10.3.2. Hospitals
- 10.3.3. Others
- 10.1. Market Analysis, Insights and Forecast - by Mode of Delivery
- 11. South America Virtual Care Market Analysis, Insights and Forecast, 2020-2032
- 11.1. Market Analysis, Insights and Forecast - by Mode of Delivery
- 11.1.1. Video
- 11.1.2. Audio
- 11.1.3. Messaging
- 11.2. Market Analysis, Insights and Forecast - by Component
- 11.2.1. Solutions
- 11.2.2. Services
- 11.3. Market Analysis, Insights and Forecast - by End Users
- 11.3.1. Home Healthcare
- 11.3.2. Hospitals
- 11.3.3. Others
- 11.1. Market Analysis, Insights and Forecast - by Mode of Delivery
- 12. Competitive Analysis
- 12.1. Company Profiles
- 12.1.1 American Well Corporation
- 12.1.1.1. Company Overview
- 12.1.1.2. Products
- 12.1.1.3. Company Financials
- 12.1.1.4. SWOT Analysis
- 12.1.2 Oracle Corporation (Cerner)
- 12.1.2.1. Company Overview
- 12.1.2.2. Products
- 12.1.2.3. Company Financials
- 12.1.2.4. SWOT Analysis
- 12.1.3 Teladoc Health Inc
- 12.1.3.1. Company Overview
- 12.1.3.2. Products
- 12.1.3.3. Company Financials
- 12.1.3.4. SWOT Analysis
- 12.1.4 United HealthCare Services Inc
- 12.1.4.1. Company Overview
- 12.1.4.2. Products
- 12.1.4.3. Company Financials
- 12.1.4.4. SWOT Analysis
- 12.1.5 MDLIVE
- 12.1.5.1. Company Overview
- 12.1.5.2. Products
- 12.1.5.3. Company Financials
- 12.1.5.4. SWOT Analysis
- 12.1.6 Medocity Inc
- 12.1.6.1. Company Overview
- 12.1.6.2. Products
- 12.1.6.3. Company Financials
- 12.1.6.4. SWOT Analysis
- 12.1.7 Amazon com Inc
- 12.1.7.1. Company Overview
- 12.1.7.2. Products
- 12.1.7.3. Company Financials
- 12.1.7.4. SWOT Analysis
- 12.1.8 General Electric Company
- 12.1.8.1. Company Overview
- 12.1.8.2. Products
- 12.1.8.3. Company Financials
- 12.1.8.4. SWOT Analysis
- 12.1.9 VirtualHealth
- 12.1.9.1. Company Overview
- 12.1.9.2. Products
- 12.1.9.3. Company Financials
- 12.1.9.4. SWOT Analysis
- 12.1.10 CVS Health
- 12.1.10.1. Company Overview
- 12.1.10.2. Products
- 12.1.10.3. Company Financials
- 12.1.10.4. SWOT Analysis
- 12.1.1 American Well Corporation
- 12.2. Market Entropy
- 12.2.1 Company's Key Areas Served
- 12.2.2 Recent Developments
- 12.3. Company Market Share Analysis 2025
- 12.3.1 Top 5 Companies Market Share Analysis
- 12.3.2 Top 3 Companies Market Share Analysis
- 12.4. List of Potential Customers
- 13. Research Methodology
List of Figures
- Figure 1: Global Virtual Care Market Revenue Breakdown (Million, %) by Region 2025 & 2033
- Figure 2: Global Virtual Care Market Volume Breakdown (K Unit, %) by Region 2025 & 2033
- Figure 3: North America Virtual Care Market Revenue (Million), by Mode of Delivery 2025 & 2033
- Figure 4: North America Virtual Care Market Volume (K Unit), by Mode of Delivery 2025 & 2033
- Figure 5: North America Virtual Care Market Revenue Share (%), by Mode of Delivery 2025 & 2033
- Figure 6: North America Virtual Care Market Volume Share (%), by Mode of Delivery 2025 & 2033
- Figure 7: North America Virtual Care Market Revenue (Million), by Component 2025 & 2033
- Figure 8: North America Virtual Care Market Volume (K Unit), by Component 2025 & 2033
- Figure 9: North America Virtual Care Market Revenue Share (%), by Component 2025 & 2033
- Figure 10: North America Virtual Care Market Volume Share (%), by Component 2025 & 2033
- Figure 11: North America Virtual Care Market Revenue (Million), by End Users 2025 & 2033
- Figure 12: North America Virtual Care Market Volume (K Unit), by End Users 2025 & 2033
- Figure 13: North America Virtual Care Market Revenue Share (%), by End Users 2025 & 2033
- Figure 14: North America Virtual Care Market Volume Share (%), by End Users 2025 & 2033
- Figure 15: North America Virtual Care Market Revenue (Million), by Country 2025 & 2033
- Figure 16: North America Virtual Care Market Volume (K Unit), by Country 2025 & 2033
- Figure 17: North America Virtual Care Market Revenue Share (%), by Country 2025 & 2033
- Figure 18: North America Virtual Care Market Volume Share (%), by Country 2025 & 2033
- Figure 19: Europe Virtual Care Market Revenue (Million), by Mode of Delivery 2025 & 2033
- Figure 20: Europe Virtual Care Market Volume (K Unit), by Mode of Delivery 2025 & 2033
- Figure 21: Europe Virtual Care Market Revenue Share (%), by Mode of Delivery 2025 & 2033
- Figure 22: Europe Virtual Care Market Volume Share (%), by Mode of Delivery 2025 & 2033
- Figure 23: Europe Virtual Care Market Revenue (Million), by Component 2025 & 2033
- Figure 24: Europe Virtual Care Market Volume (K Unit), by Component 2025 & 2033
- Figure 25: Europe Virtual Care Market Revenue Share (%), by Component 2025 & 2033
- Figure 26: Europe Virtual Care Market Volume Share (%), by Component 2025 & 2033
- Figure 27: Europe Virtual Care Market Revenue (Million), by End Users 2025 & 2033
- Figure 28: Europe Virtual Care Market Volume (K Unit), by End Users 2025 & 2033
- Figure 29: Europe Virtual Care Market Revenue Share (%), by End Users 2025 & 2033
- Figure 30: Europe Virtual Care Market Volume Share (%), by End Users 2025 & 2033
- Figure 31: Europe Virtual Care Market Revenue (Million), by Country 2025 & 2033
- Figure 32: Europe Virtual Care Market Volume (K Unit), by Country 2025 & 2033
- Figure 33: Europe Virtual Care Market Revenue Share (%), by Country 2025 & 2033
- Figure 34: Europe Virtual Care Market Volume Share (%), by Country 2025 & 2033
- Figure 35: Asia Pacific Virtual Care Market Revenue (Million), by Mode of Delivery 2025 & 2033
- Figure 36: Asia Pacific Virtual Care Market Volume (K Unit), by Mode of Delivery 2025 & 2033
- Figure 37: Asia Pacific Virtual Care Market Revenue Share (%), by Mode of Delivery 2025 & 2033
- Figure 38: Asia Pacific Virtual Care Market Volume Share (%), by Mode of Delivery 2025 & 2033
- Figure 39: Asia Pacific Virtual Care Market Revenue (Million), by Component 2025 & 2033
- Figure 40: Asia Pacific Virtual Care Market Volume (K Unit), by Component 2025 & 2033
- Figure 41: Asia Pacific Virtual Care Market Revenue Share (%), by Component 2025 & 2033
- Figure 42: Asia Pacific Virtual Care Market Volume Share (%), by Component 2025 & 2033
- Figure 43: Asia Pacific Virtual Care Market Revenue (Million), by End Users 2025 & 2033
- Figure 44: Asia Pacific Virtual Care Market Volume (K Unit), by End Users 2025 & 2033
- Figure 45: Asia Pacific Virtual Care Market Revenue Share (%), by End Users 2025 & 2033
- Figure 46: Asia Pacific Virtual Care Market Volume Share (%), by End Users 2025 & 2033
- Figure 47: Asia Pacific Virtual Care Market Revenue (Million), by Country 2025 & 2033
- Figure 48: Asia Pacific Virtual Care Market Volume (K Unit), by Country 2025 & 2033
- Figure 49: Asia Pacific Virtual Care Market Revenue Share (%), by Country 2025 & 2033
- Figure 50: Asia Pacific Virtual Care Market Volume Share (%), by Country 2025 & 2033
- Figure 51: Middle East and Africa Virtual Care Market Revenue (Million), by Mode of Delivery 2025 & 2033
- Figure 52: Middle East and Africa Virtual Care Market Volume (K Unit), by Mode of Delivery 2025 & 2033
- Figure 53: Middle East and Africa Virtual Care Market Revenue Share (%), by Mode of Delivery 2025 & 2033
- Figure 54: Middle East and Africa Virtual Care Market Volume Share (%), by Mode of Delivery 2025 & 2033
- Figure 55: Middle East and Africa Virtual Care Market Revenue (Million), by Component 2025 & 2033
- Figure 56: Middle East and Africa Virtual Care Market Volume (K Unit), by Component 2025 & 2033
- Figure 57: Middle East and Africa Virtual Care Market Revenue Share (%), by Component 2025 & 2033
- Figure 58: Middle East and Africa Virtual Care Market Volume Share (%), by Component 2025 & 2033
- Figure 59: Middle East and Africa Virtual Care Market Revenue (Million), by End Users 2025 & 2033
- Figure 60: Middle East and Africa Virtual Care Market Volume (K Unit), by End Users 2025 & 2033
- Figure 61: Middle East and Africa Virtual Care Market Revenue Share (%), by End Users 2025 & 2033
- Figure 62: Middle East and Africa Virtual Care Market Volume Share (%), by End Users 2025 & 2033
- Figure 63: Middle East and Africa Virtual Care Market Revenue (Million), by Country 2025 & 2033
- Figure 64: Middle East and Africa Virtual Care Market Volume (K Unit), by Country 2025 & 2033
- Figure 65: Middle East and Africa Virtual Care Market Revenue Share (%), by Country 2025 & 2033
- Figure 66: Middle East and Africa Virtual Care Market Volume Share (%), by Country 2025 & 2033
- Figure 67: South America Virtual Care Market Revenue (Million), by Mode of Delivery 2025 & 2033
- Figure 68: South America Virtual Care Market Volume (K Unit), by Mode of Delivery 2025 & 2033
- Figure 69: South America Virtual Care Market Revenue Share (%), by Mode of Delivery 2025 & 2033
- Figure 70: South America Virtual Care Market Volume Share (%), by Mode of Delivery 2025 & 2033
- Figure 71: South America Virtual Care Market Revenue (Million), by Component 2025 & 2033
- Figure 72: South America Virtual Care Market Volume (K Unit), by Component 2025 & 2033
- Figure 73: South America Virtual Care Market Revenue Share (%), by Component 2025 & 2033
- Figure 74: South America Virtual Care Market Volume Share (%), by Component 2025 & 2033
- Figure 75: South America Virtual Care Market Revenue (Million), by End Users 2025 & 2033
- Figure 76: South America Virtual Care Market Volume (K Unit), by End Users 2025 & 2033
- Figure 77: South America Virtual Care Market Revenue Share (%), by End Users 2025 & 2033
- Figure 78: South America Virtual Care Market Volume Share (%), by End Users 2025 & 2033
- Figure 79: South America Virtual Care Market Revenue (Million), by Country 2025 & 2033
- Figure 80: South America Virtual Care Market Volume (K Unit), by Country 2025 & 2033
- Figure 81: South America Virtual Care Market Revenue Share (%), by Country 2025 & 2033
- Figure 82: South America Virtual Care Market Volume Share (%), by Country 2025 & 2033
List of Tables
- Table 1: Global Virtual Care Market Revenue Million Forecast, by Mode of Delivery 2020 & 2033
- Table 2: Global Virtual Care Market Volume K Unit Forecast, by Mode of Delivery 2020 & 2033
- Table 3: Global Virtual Care Market Revenue Million Forecast, by Component 2020 & 2033
- Table 4: Global Virtual Care Market Volume K Unit Forecast, by Component 2020 & 2033
- Table 5: Global Virtual Care Market Revenue Million Forecast, by End Users 2020 & 2033
- Table 6: Global Virtual Care Market Volume K Unit Forecast, by End Users 2020 & 2033
- Table 7: Global Virtual Care Market Revenue Million Forecast, by Region 2020 & 2033
- Table 8: Global Virtual Care Market Volume K Unit Forecast, by Region 2020 & 2033
- Table 9: Global Virtual Care Market Revenue Million Forecast, by Mode of Delivery 2020 & 2033
- Table 10: Global Virtual Care Market Volume K Unit Forecast, by Mode of Delivery 2020 & 2033
- Table 11: Global Virtual Care Market Revenue Million Forecast, by Component 2020 & 2033
- Table 12: Global Virtual Care Market Volume K Unit Forecast, by Component 2020 & 2033
- Table 13: Global Virtual Care Market Revenue Million Forecast, by End Users 2020 & 2033
- Table 14: Global Virtual Care Market Volume K Unit Forecast, by End Users 2020 & 2033
- Table 15: Global Virtual Care Market Revenue Million Forecast, by Country 2020 & 2033
- Table 16: Global Virtual Care Market Volume K Unit Forecast, by Country 2020 & 2033
- Table 17: United States Virtual Care Market Revenue (Million) Forecast, by Application 2020 & 2033
- Table 18: United States Virtual Care Market Volume (K Unit) Forecast, by Application 2020 & 2033
- Table 19: Canada Virtual Care Market Revenue (Million) Forecast, by Application 2020 & 2033
- Table 20: Canada Virtual Care Market Volume (K Unit) Forecast, by Application 2020 & 2033
- Table 21: Mexico Virtual Care Market Revenue (Million) Forecast, by Application 2020 & 2033
- Table 22: Mexico Virtual Care Market Volume (K Unit) Forecast, by Application 2020 & 2033
- Table 23: Global Virtual Care Market Revenue Million Forecast, by Mode of Delivery 2020 & 2033
- Table 24: Global Virtual Care Market Volume K Unit Forecast, by Mode of Delivery 2020 & 2033
- Table 25: Global Virtual Care Market Revenue Million Forecast, by Component 2020 & 2033
- Table 26: Global Virtual Care Market Volume K Unit Forecast, by Component 2020 & 2033
- Table 27: Global Virtual Care Market Revenue Million Forecast, by End Users 2020 & 2033
- Table 28: Global Virtual Care Market Volume K Unit Forecast, by End Users 2020 & 2033
- Table 29: Global Virtual Care Market Revenue Million Forecast, by Country 2020 & 2033
- Table 30: Global Virtual Care Market Volume K Unit Forecast, by Country 2020 & 2033
- Table 31: Germany Virtual Care Market Revenue (Million) Forecast, by Application 2020 & 2033
- Table 32: Germany Virtual Care Market Volume (K Unit) Forecast, by Application 2020 & 2033
- Table 33: United Kingdom Virtual Care Market Revenue (Million) Forecast, by Application 2020 & 2033
- Table 34: United Kingdom Virtual Care Market Volume (K Unit) Forecast, by Application 2020 & 2033
- Table 35: France Virtual Care Market Revenue (Million) Forecast, by Application 2020 & 2033
- Table 36: France Virtual Care Market Volume (K Unit) Forecast, by Application 2020 & 2033
- Table 37: Italy Virtual Care Market Revenue (Million) Forecast, by Application 2020 & 2033
- Table 38: Italy Virtual Care Market Volume (K Unit) Forecast, by Application 2020 & 2033
- Table 39: Spain Virtual Care Market Revenue (Million) Forecast, by Application 2020 & 2033
- Table 40: Spain Virtual Care Market Volume (K Unit) Forecast, by Application 2020 & 2033
- Table 41: Rest of Europe Virtual Care Market Revenue (Million) Forecast, by Application 2020 & 2033
- Table 42: Rest of Europe Virtual Care Market Volume (K Unit) Forecast, by Application 2020 & 2033
- Table 43: Global Virtual Care Market Revenue Million Forecast, by Mode of Delivery 2020 & 2033
- Table 44: Global Virtual Care Market Volume K Unit Forecast, by Mode of Delivery 2020 & 2033
- Table 45: Global Virtual Care Market Revenue Million Forecast, by Component 2020 & 2033
- Table 46: Global Virtual Care Market Volume K Unit Forecast, by Component 2020 & 2033
- Table 47: Global Virtual Care Market Revenue Million Forecast, by End Users 2020 & 2033
- Table 48: Global Virtual Care Market Volume K Unit Forecast, by End Users 2020 & 2033
- Table 49: Global Virtual Care Market Revenue Million Forecast, by Country 2020 & 2033
- Table 50: Global Virtual Care Market Volume K Unit Forecast, by Country 2020 & 2033
- Table 51: China Virtual Care Market Revenue (Million) Forecast, by Application 2020 & 2033
- Table 52: China Virtual Care Market Volume (K Unit) Forecast, by Application 2020 & 2033
- Table 53: Japan Virtual Care Market Revenue (Million) Forecast, by Application 2020 & 2033
- Table 54: Japan Virtual Care Market Volume (K Unit) Forecast, by Application 2020 & 2033
- Table 55: India Virtual Care Market Revenue (Million) Forecast, by Application 2020 & 2033
- Table 56: India Virtual Care Market Volume (K Unit) Forecast, by Application 2020 & 2033
- Table 57: Australia Virtual Care Market Revenue (Million) Forecast, by Application 2020 & 2033
- Table 58: Australia Virtual Care Market Volume (K Unit) Forecast, by Application 2020 & 2033
- Table 59: South Korea Virtual Care Market Revenue (Million) Forecast, by Application 2020 & 2033
- Table 60: South Korea Virtual Care Market Volume (K Unit) Forecast, by Application 2020 & 2033
- Table 61: Rest of Asia Pacific Virtual Care Market Revenue (Million) Forecast, by Application 2020 & 2033
- Table 62: Rest of Asia Pacific Virtual Care Market Volume (K Unit) Forecast, by Application 2020 & 2033
- Table 63: Global Virtual Care Market Revenue Million Forecast, by Mode of Delivery 2020 & 2033
- Table 64: Global Virtual Care Market Volume K Unit Forecast, by Mode of Delivery 2020 & 2033
- Table 65: Global Virtual Care Market Revenue Million Forecast, by Component 2020 & 2033
- Table 66: Global Virtual Care Market Volume K Unit Forecast, by Component 2020 & 2033
- Table 67: Global Virtual Care Market Revenue Million Forecast, by End Users 2020 & 2033
- Table 68: Global Virtual Care Market Volume K Unit Forecast, by End Users 2020 & 2033
- Table 69: Global Virtual Care Market Revenue Million Forecast, by Country 2020 & 2033
- Table 70: Global Virtual Care Market Volume K Unit Forecast, by Country 2020 & 2033
- Table 71: GCC Virtual Care Market Revenue (Million) Forecast, by Application 2020 & 2033
- Table 72: GCC Virtual Care Market Volume (K Unit) Forecast, by Application 2020 & 2033
- Table 73: South Africa Virtual Care Market Revenue (Million) Forecast, by Application 2020 & 2033
- Table 74: South Africa Virtual Care Market Volume (K Unit) Forecast, by Application 2020 & 2033
- Table 75: Rest of Middle East and Africa Virtual Care Market Revenue (Million) Forecast, by Application 2020 & 2033
- Table 76: Rest of Middle East and Africa Virtual Care Market Volume (K Unit) Forecast, by Application 2020 & 2033
- Table 77: Global Virtual Care Market Revenue Million Forecast, by Mode of Delivery 2020 & 2033
- Table 78: Global Virtual Care Market Volume K Unit Forecast, by Mode of Delivery 2020 & 2033
- Table 79: Global Virtual Care Market Revenue Million Forecast, by Component 2020 & 2033
- Table 80: Global Virtual Care Market Volume K Unit Forecast, by Component 2020 & 2033
- Table 81: Global Virtual Care Market Revenue Million Forecast, by End Users 2020 & 2033
- Table 82: Global Virtual Care Market Volume K Unit Forecast, by End Users 2020 & 2033
- Table 83: Global Virtual Care Market Revenue Million Forecast, by Country 2020 & 2033
- Table 84: Global Virtual Care Market Volume K Unit Forecast, by Country 2020 & 2033
- Table 85: Brazil Virtual Care Market Revenue (Million) Forecast, by Application 2020 & 2033
- Table 86: Brazil Virtual Care Market Volume (K Unit) Forecast, by Application 2020 & 2033
- Table 87: Argentina Virtual Care Market Revenue (Million) Forecast, by Application 2020 & 2033
- Table 88: Argentina Virtual Care Market Volume (K Unit) Forecast, by Application 2020 & 2033
- Table 89: Rest of South America Virtual Care Market Revenue (Million) Forecast, by Application 2020 & 2033
- Table 90: Rest of South America Virtual Care Market Volume (K Unit) Forecast, by Application 2020 & 2033
Frequently Asked Questions
1. What is the projected Compound Annual Growth Rate (CAGR) of the Virtual Care Market?
The projected CAGR is approximately 26.10%.
2. Which companies are prominent players in the Virtual Care Market?
Key companies in the market include American Well Corporation, Oracle Corporation (Cerner), Teladoc Health Inc, United HealthCare Services Inc, MDLIVE, Medocity Inc, Amazon com Inc, General Electric Company, VirtualHealth, CVS Health.
3. What are the main segments of the Virtual Care Market?
The market segments include Mode of Delivery, Component, End Users.
4. Can you provide details about the market size?
The market size is estimated to be USD 12.84 Million as of 2022.
5. What are some drivers contributing to market growth?
Increasing Number of Patients Adopting Virtual Care and Government Initiatives Towards Virtual Care Access; Advantages Of Virtual Care and New Service Launches by Market Players.
6. What are the notable trends driving market growth?
Home Healthcare Segment is Expected to Witness Significant Growth Over the Forecast Period.
7. Are there any restraints impacting market growth?
Lack of Physician Support and Hospital Integration Issues Due to Privacy Concerns.
8. Can you provide examples of recent developments in the market?
In May 2022 CVS Health launched CVS Health Virtual Primary Care for its CVS Caremark members. The CVS Health Virtual Primary Care is a telehealth service that gives members an on-demand virtual care link to primary care providers, as well as urgent care, chronic care management, and behavioral care services, along with other services.
9. What pricing options are available for accessing the report?
Pricing options include single-user, multi-user, and enterprise licenses priced at USD 4750, USD 5250, and USD 8750 respectively.
10. Is the market size provided in terms of value or volume?
The market size is provided in terms of value, measured in Million and volume, measured in K Unit.
11. Are there any specific market keywords associated with the report?
Yes, the market keyword associated with the report is "Virtual Care Market," which aids in identifying and referencing the specific market segment covered.
12. How do I determine which pricing option suits my needs best?
The pricing options vary based on user requirements and access needs. Individual users may opt for single-user licenses, while businesses requiring broader access may choose multi-user or enterprise licenses for cost-effective access to the report.
13. Are there any additional resources or data provided in the Virtual Care Market report?
While the report offers comprehensive insights, it's advisable to review the specific contents or supplementary materials provided to ascertain if additional resources or data are available.
14. How can I stay updated on further developments or reports in the Virtual Care Market?
To stay informed about further developments, trends, and reports in the Virtual Care Market, consider subscribing to industry newsletters, following relevant companies and organizations, or regularly checking reputable industry news sources and publications.
Methodology
Step 1 - Identification of Relevant Samples Size from Population Database


Step 2 - Approaches for Defining Global Market Size (Value, Volume* & Price*)

Note*: In applicable scenarios
Step 3 - Data Sources
Primary Research
- Web Analytics
- Survey Reports
- Research Institute
- Latest Research Reports
- Opinion Leaders
Secondary Research
- Annual Reports
- White Paper
- Latest Press Release
- Industry Association
- Paid Database
- Investor Presentations

Step 4 - Data Triangulation
Involves using different sources of information in order to increase the validity of a study
These sources are likely to be stakeholders in a program - participants, other researchers, program staff, other community members, and so on.
Then we put all data in single framework & apply various statistical tools to find out the dynamic on the market.
During the analysis stage, feedback from the stakeholder groups would be compared to determine areas of agreement as well as areas of divergence