
Key Insights
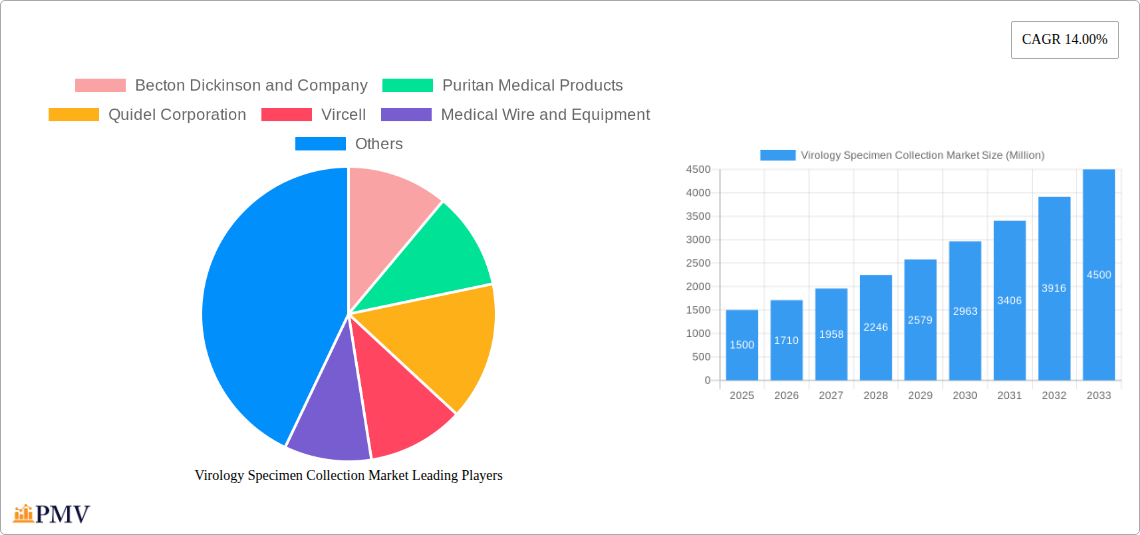
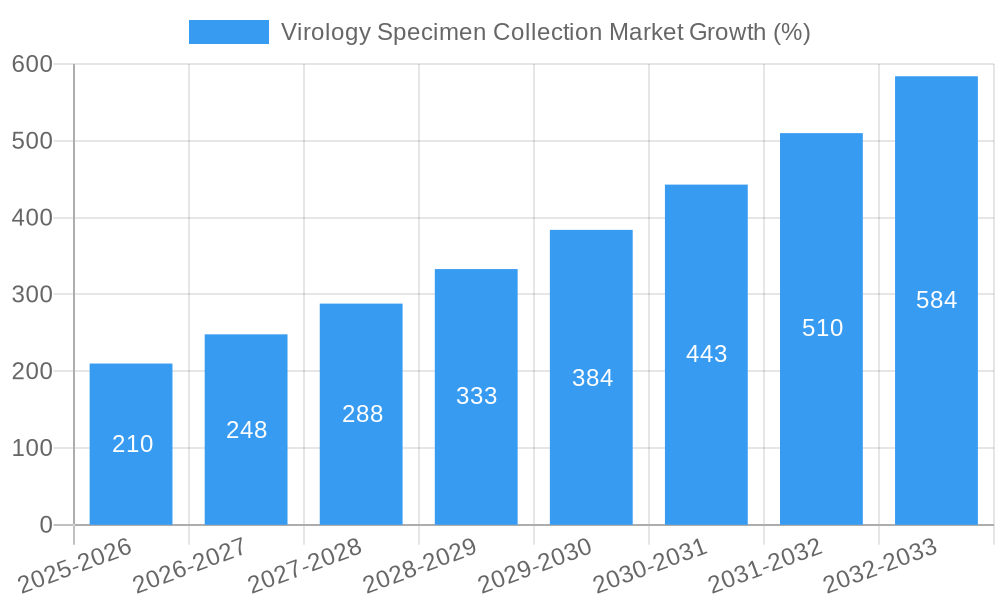
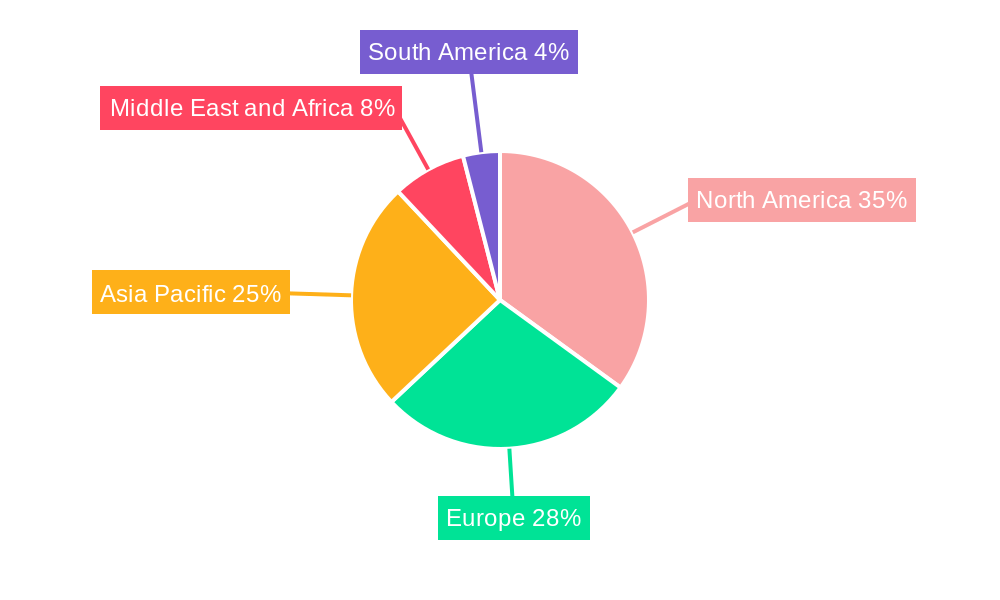
The global virology specimen collection market is experiencing robust growth, projected to reach a substantial size by 2033, driven by a compound annual growth rate (CAGR) of 14%. This expansion is fueled by several key factors. The rising prevalence of infectious diseases, including viral outbreaks and pandemics (like the recent COVID-19 pandemic), has significantly increased the demand for efficient and reliable specimen collection methods. Advancements in diagnostic technologies, particularly molecular diagnostics like PCR and next-generation sequencing, further contribute to market growth as these techniques necessitate high-quality specimen collection. The increasing number of hospitals, diagnostic laboratories, and research institutions globally also expands the market's potential customer base. Furthermore, the development of innovative collection kits, such as those designed for at-home sample collection, is streamlining the process and improving accessibility. This growth is not uniform across regions, with North America and Europe expected to maintain significant market shares due to well-established healthcare infrastructure and higher adoption rates of advanced diagnostic technologies. However, the Asia-Pacific region demonstrates significant growth potential, driven by increasing healthcare spending and expanding diagnostic capabilities in developing economies. Challenges such as stringent regulatory approvals and the potential for contamination during specimen collection remain, but ongoing technological advancements and industry initiatives aimed at improving quality control are mitigating these issues. The market is segmented by end-users (hospitals and clinics, diagnostic laboratories, others) and product type (blood collection kits, viral transport media, others), allowing companies to tailor their offerings to specific needs. Leading players, including Becton Dickinson, Puritan Medical Products, and others, are investing in research and development to improve existing products and introduce innovative solutions, contributing to the ongoing market expansion.
The competitive landscape is marked by a mix of large multinational corporations and smaller specialized companies. Large players benefit from economies of scale and global distribution networks, while smaller companies often specialize in niche products or technologies. Strategic partnerships and mergers & acquisitions are expected to continue shaping the market landscape, driving innovation and market consolidation. The forecast period of 2025-2033 presents considerable opportunities for growth, particularly in emerging markets where there is a growing demand for advanced diagnostic tools and a strengthening healthcare infrastructure. The market's future success will rely on continuous innovation, maintaining high quality standards, adapting to evolving regulatory landscapes, and responding effectively to the ever-changing needs of healthcare professionals and patients.
Virology Specimen Collection Market: A Comprehensive Report (2019-2033)
This detailed report provides a comprehensive analysis of the Virology Specimen Collection Market, offering actionable insights for stakeholders across the industry. With a study period spanning 2019-2033, a base year of 2025, and a forecast period of 2025-2033, this report offers a robust understanding of past performance, current market dynamics, and future projections. The market is segmented by end-users (Hospitals and Clinics, Diagnostic Laboratories, Others) and product type (Blood Collection Kits, Viral Transport Media, Others). Key players analyzed include Becton Dickinson and Company, Puritan Medical Products, Quidel Corporation, Vircell, Medical Wire and Equipment, COPAN diagnostics Inc, Titan Biotech limited, Hardy Diagnostics, Pretium Packaging, EKF diagnostics, Thermo Fisher Scientific, and Trinity Biotech. The report is valued at xx Million and is expected to reach xx Million by 2033, exhibiting a CAGR of xx%.
Virology Specimen Collection Market Market Structure & Competitive Dynamics
The Virology Specimen Collection Market exhibits a moderately concentrated structure, with a few major players holding significant market share. The competitive landscape is characterized by intense rivalry, driven by factors such as product innovation, technological advancements, and strategic mergers and acquisitions (M&A). Market leaders are focusing on expanding their product portfolios, strengthening distribution networks, and developing innovative solutions to cater to evolving end-user needs. The regulatory framework plays a critical role, influencing product approvals and market access. Substitutes are limited, primarily focusing on alternative testing methodologies. M&A activities have been significant, with deal values reaching xx Million in the past few years, driving consolidation and market expansion.
- Market Concentration: High concentration in the upper segment with top 5 players holding approximately xx% market share.
- Innovation Ecosystems: Strong presence of R&D focused companies leading to innovation in viral transport media and collection kits.
- Regulatory Frameworks: Stringent regulatory approvals impact market entry and product availability.
- Product Substitutes: Limited substitutes, with most competition focused on improving existing technologies.
- End-User Trends: Growing adoption of advanced diagnostics and increasing prevalence of infectious diseases drives demand.
- M&A Activities: Significant M&A activity observed in recent years, consolidating the market and driving growth. Average deal size is estimated at xx Million.
Virology Specimen Collection Market Industry Trends & Insights
The Virology Specimen Collection Market is experiencing robust growth, driven by factors such as increasing prevalence of infectious diseases, rising demand for advanced diagnostic testing, and technological advancements in specimen collection and transport. The market is witnessing a surge in demand for innovative products that offer improved accuracy, efficiency, and safety. The adoption of automated systems and digital technologies is further enhancing the efficiency and effectiveness of specimen collection processes. The increasing focus on point-of-care diagnostics is also creating new opportunities for growth in the market. Competitive dynamics are marked by innovation, strategic partnerships, and expansion into new markets. The market penetration of new technologies is steadily increasing, with a projected penetration rate of xx% by 2033.
Dominant Markets & Segments in Virology Specimen Collection Market
By End-Users: Hospitals and clinics represent the largest segment, accounting for approximately xx% of the market share. This is primarily driven by the high volume of viral testing conducted in these settings and the need for reliable and efficient specimen collection systems. Diagnostic laboratories constitute the second-largest segment, driven by the outsourcing of testing services and the need for specialized viral transport media and collection kits.
By Product Type: Viral transport media represents the largest segment, due to its pivotal role in preserving viral samples during transport. Blood collection kits follow, driven by the prevalence of blood-borne viral infections.
- Key Drivers (Hospitals and Clinics):
- High volume of viral testing
- Need for reliable and efficient systems
- Investment in advanced diagnostic technologies
- Key Drivers (Diagnostic Laboratories):
- Outsourcing of viral testing services
- Demand for specialized transport media and kits
- Key Drivers (Viral Transport Media):
- Crucial role in sample preservation
- Technological advancements enhancing stability and efficacy
- Key Drivers (Blood Collection Kits):
- Prevalence of blood-borne viral infections
- Innovations in kit design and usability
Virology Specimen Collection Market Product Innovations
Recent product developments focus on improving viral sample preservation, simplifying collection procedures, and enhancing the overall testing workflow. Innovations include the development of viral inactivation media, which offer improved safety and reduce the risk of cross-contamination. These advancements enhance the reliability and accuracy of downstream diagnostic testing, creating a compelling market fit for both clinical and research applications. New technologies aim for improved shelf life, simplified handling, and reduced transportation costs.
Report Segmentation & Scope
The Virology Specimen Collection Market is segmented by end-user into Hospitals and Clinics, Diagnostic Laboratories, and Others. Hospitals and Clinics segment is projected to grow at a CAGR of xx% during the forecast period. Diagnostic laboratories will witness a CAGR of xx%, driven by outsourcing. The market is also segmented by product type into Blood Collection Kits, Viral Transport Media, and Others. Viral transport media segment is projected to experience the fastest growth due to technological advancements and increased demand for reliable sample preservation methods. Competitive dynamics within each segment vary, with some segments being more fragmented than others. Market sizes for each segment are detailed within the full report.
Key Drivers of Virology Specimen Collection Market Growth
The market's growth is fueled by several factors: the increasing prevalence of viral infections globally, the rising demand for accurate and timely diagnostics, technological advancements leading to improved specimen collection and transport methods (e.g., the development of inactivation media), and supportive government initiatives promoting public health and infectious disease surveillance. The growing adoption of point-of-care diagnostics is also a significant driver. Stringent regulatory frameworks ensure product quality and safety, further bolstering market growth.
Challenges in the Virology Specimen Collection Market Sector
Challenges include stringent regulatory requirements for product approvals, potential supply chain disruptions impacting raw material availability, and competitive pressures necessitating continuous innovation. The high cost of some advanced products can limit accessibility in certain regions. Furthermore, maintaining the cold chain integrity during transportation remains a significant logistical hurdle affecting sample viability. These factors, together, could impact the overall market growth rate by approximately xx% in the next few years.
Leading Players in the Virology Specimen Collection Market Market
- Becton Dickinson and Company
- Puritan Medical Products
- Quidel Corporation
- Vircell
- Medical Wire and Equipment
- COPAN diagnostics Inc
- Titan Biotech limited
- Hardy Diagnostics
- Pretium Packaging
- EKF diagnostics
- Thermo Fisher Scientific
- Trinity Biotech
Key Developments in Virology Specimen Collection Market Sector
- March 2022: Thermo Fisher Scientific launched InhibiSURE Viral Inactivation Medium in Europe, enabling rapid inactivation of SARS-CoV-2 and stabilizing viral RNA.
- February 2022: Azooka Labs launched India's first indigenous biological transport and storage medium.
Strategic Virology Specimen Collection Market Market Outlook
The Virology Specimen Collection Market is poised for continued growth, driven by ongoing technological advancements, increased demand for advanced diagnostics, and the persistent threat of emerging infectious diseases. Strategic opportunities exist in developing innovative products, expanding into emerging markets, and forging strategic partnerships to enhance market reach and product accessibility. Focusing on sustainable and cost-effective solutions will be crucial for long-term success. The market's future trajectory is promising, with significant potential for growth and expansion in the coming years.
Virology Specimen Collection Market Segmentation
-
1. Product Type
- 1.1. Blood Collection Kits
- 1.2. Viral Transport Media
- 1.3. Others
-
2. End users
- 2.1. Hospitals and Clinics
- 2.2. Diagnostic Laboratories
- 2.3. Others
Virology Specimen Collection Market Segmentation By Geography
-
1. North America
- 1.1. United States
- 1.2. Canada
- 1.3. Mexico
-
2. Europe
- 2.1. Germany
- 2.2. United Kingdom
- 2.3. France
- 2.4. Italy
- 2.5. Spain
- 2.6. Rest of Europe
-
3. Asia Pacific
- 3.1. China
- 3.2. Japan
- 3.3. India
- 3.4. Australia
- 3.5. South Korea
- 3.6. Rest of Asia Pacific
-
4. Middle East and Africa
- 4.1. GCC
- 4.2. South Africa
- 4.3. Rest of Middle East and Africa
-
5. South America
- 5.1. Brazil
- 5.2. Argentina
- 5.3. Rest of South America
Virology Specimen Collection Market REPORT HIGHLIGHTS
| Aspects | Details |
|---|---|
| Study Period | 2019-2033 |
| Base Year | 2024 |
| Estimated Year | 2025 |
| Forecast Period | 2025-2033 |
| Historical Period | 2019-2024 |
| Growth Rate | CAGR of 14.00% from 2019-2033 |
| Segmentation |
|
Table of Contents
- 1. Introduction
- 1.1. Research Scope
- 1.2. Market Segmentation
- 1.3. Research Methodology
- 1.4. Definitions and Assumptions
- 2. Executive Summary
- 2.1. Introduction
- 3. Market Dynamics
- 3.1. Introduction
- 3.2. Market Drivers
- 3.2.1. Increasing Prevalence of Viral Diseases and Emergence of New Pathogens; Rising Number of Blood Donations
- 3.3. Market Restrains
- 3.3.1. High Cost of Collection Kits and Technologies
- 3.4. Market Trends
- 3.4.1. The Hospitals and Clinics Segment is Expected to Hold a Major Market Share Over the Forecast Period
- 4. Market Factor Analysis
- 4.1. Porters Five Forces
- 4.2. Supply/Value Chain
- 4.3. PESTEL analysis
- 4.4. Market Entropy
- 4.5. Patent/Trademark Analysis
- 5. Global Virology Specimen Collection Market Analysis, Insights and Forecast, 2019-2031
- 5.1. Market Analysis, Insights and Forecast - by Product Type
- 5.1.1. Blood Collection Kits
- 5.1.2. Viral Transport Media
- 5.1.3. Others
- 5.2. Market Analysis, Insights and Forecast - by End users
- 5.2.1. Hospitals and Clinics
- 5.2.2. Diagnostic Laboratories
- 5.2.3. Others
- 5.3. Market Analysis, Insights and Forecast - by Region
- 5.3.1. North America
- 5.3.2. Europe
- 5.3.3. Asia Pacific
- 5.3.4. Middle East and Africa
- 5.3.5. South America
- 5.1. Market Analysis, Insights and Forecast - by Product Type
- 6. North America Virology Specimen Collection Market Analysis, Insights and Forecast, 2019-2031
- 6.1. Market Analysis, Insights and Forecast - by Product Type
- 6.1.1. Blood Collection Kits
- 6.1.2. Viral Transport Media
- 6.1.3. Others
- 6.2. Market Analysis, Insights and Forecast - by End users
- 6.2.1. Hospitals and Clinics
- 6.2.2. Diagnostic Laboratories
- 6.2.3. Others
- 6.1. Market Analysis, Insights and Forecast - by Product Type
- 7. Europe Virology Specimen Collection Market Analysis, Insights and Forecast, 2019-2031
- 7.1. Market Analysis, Insights and Forecast - by Product Type
- 7.1.1. Blood Collection Kits
- 7.1.2. Viral Transport Media
- 7.1.3. Others
- 7.2. Market Analysis, Insights and Forecast - by End users
- 7.2.1. Hospitals and Clinics
- 7.2.2. Diagnostic Laboratories
- 7.2.3. Others
- 7.1. Market Analysis, Insights and Forecast - by Product Type
- 8. Asia Pacific Virology Specimen Collection Market Analysis, Insights and Forecast, 2019-2031
- 8.1. Market Analysis, Insights and Forecast - by Product Type
- 8.1.1. Blood Collection Kits
- 8.1.2. Viral Transport Media
- 8.1.3. Others
- 8.2. Market Analysis, Insights and Forecast - by End users
- 8.2.1. Hospitals and Clinics
- 8.2.2. Diagnostic Laboratories
- 8.2.3. Others
- 8.1. Market Analysis, Insights and Forecast - by Product Type
- 9. Middle East and Africa Virology Specimen Collection Market Analysis, Insights and Forecast, 2019-2031
- 9.1. Market Analysis, Insights and Forecast - by Product Type
- 9.1.1. Blood Collection Kits
- 9.1.2. Viral Transport Media
- 9.1.3. Others
- 9.2. Market Analysis, Insights and Forecast - by End users
- 9.2.1. Hospitals and Clinics
- 9.2.2. Diagnostic Laboratories
- 9.2.3. Others
- 9.1. Market Analysis, Insights and Forecast - by Product Type
- 10. South America Virology Specimen Collection Market Analysis, Insights and Forecast, 2019-2031
- 10.1. Market Analysis, Insights and Forecast - by Product Type
- 10.1.1. Blood Collection Kits
- 10.1.2. Viral Transport Media
- 10.1.3. Others
- 10.2. Market Analysis, Insights and Forecast - by End users
- 10.2.1. Hospitals and Clinics
- 10.2.2. Diagnostic Laboratories
- 10.2.3. Others
- 10.1. Market Analysis, Insights and Forecast - by Product Type
- 11. North America Virology Specimen Collection Market Analysis, Insights and Forecast, 2019-2031
- 11.1. Market Analysis, Insights and Forecast - By Country/Sub-region
- 11.1.1 United States
- 11.1.2 Canada
- 11.1.3 Mexico
- 12. Europe Virology Specimen Collection Market Analysis, Insights and Forecast, 2019-2031
- 12.1. Market Analysis, Insights and Forecast - By Country/Sub-region
- 12.1.1 Germany
- 12.1.2 United Kingdom
- 12.1.3 France
- 12.1.4 Italy
- 12.1.5 Spain
- 12.1.6 Rest of Europe
- 13. Asia Pacific Virology Specimen Collection Market Analysis, Insights and Forecast, 2019-2031
- 13.1. Market Analysis, Insights and Forecast - By Country/Sub-region
- 13.1.1 China
- 13.1.2 Japan
- 13.1.3 India
- 13.1.4 Australia
- 13.1.5 South Korea
- 13.1.6 Rest of Asia Pacific
- 14. Middle East and Africa Virology Specimen Collection Market Analysis, Insights and Forecast, 2019-2031
- 14.1. Market Analysis, Insights and Forecast - By Country/Sub-region
- 14.1.1 GCC
- 14.1.2 South Africa
- 14.1.3 Rest of Middle East and Africa
- 15. South America Virology Specimen Collection Market Analysis, Insights and Forecast, 2019-2031
- 15.1. Market Analysis, Insights and Forecast - By Country/Sub-region
- 15.1.1 Brazil
- 15.1.2 Argentina
- 15.1.3 Rest of South America
- 16. Competitive Analysis
- 16.1. Global Market Share Analysis 2024
- 16.2. Company Profiles
- 16.2.1 Becton Dickinson and Company
- 16.2.1.1. Overview
- 16.2.1.2. Products
- 16.2.1.3. SWOT Analysis
- 16.2.1.4. Recent Developments
- 16.2.1.5. Financials (Based on Availability)
- 16.2.2 Puritan Medical Products
- 16.2.2.1. Overview
- 16.2.2.2. Products
- 16.2.2.3. SWOT Analysis
- 16.2.2.4. Recent Developments
- 16.2.2.5. Financials (Based on Availability)
- 16.2.3 Quidel Corporation
- 16.2.3.1. Overview
- 16.2.3.2. Products
- 16.2.3.3. SWOT Analysis
- 16.2.3.4. Recent Developments
- 16.2.3.5. Financials (Based on Availability)
- 16.2.4 Vircell
- 16.2.4.1. Overview
- 16.2.4.2. Products
- 16.2.4.3. SWOT Analysis
- 16.2.4.4. Recent Developments
- 16.2.4.5. Financials (Based on Availability)
- 16.2.5 Medical Wire and Equipment
- 16.2.5.1. Overview
- 16.2.5.2. Products
- 16.2.5.3. SWOT Analysis
- 16.2.5.4. Recent Developments
- 16.2.5.5. Financials (Based on Availability)
- 16.2.6 COPAN diagnostics Inc
- 16.2.6.1. Overview
- 16.2.6.2. Products
- 16.2.6.3. SWOT Analysis
- 16.2.6.4. Recent Developments
- 16.2.6.5. Financials (Based on Availability)
- 16.2.7 Titan Biotech limited
- 16.2.7.1. Overview
- 16.2.7.2. Products
- 16.2.7.3. SWOT Analysis
- 16.2.7.4. Recent Developments
- 16.2.7.5. Financials (Based on Availability)
- 16.2.8 Hardy Diagnostics
- 16.2.8.1. Overview
- 16.2.8.2. Products
- 16.2.8.3. SWOT Analysis
- 16.2.8.4. Recent Developments
- 16.2.8.5. Financials (Based on Availability)
- 16.2.9 Pretium Packaging
- 16.2.9.1. Overview
- 16.2.9.2. Products
- 16.2.9.3. SWOT Analysis
- 16.2.9.4. Recent Developments
- 16.2.9.5. Financials (Based on Availability)
- 16.2.10 EKF diagnostics
- 16.2.10.1. Overview
- 16.2.10.2. Products
- 16.2.10.3. SWOT Analysis
- 16.2.10.4. Recent Developments
- 16.2.10.5. Financials (Based on Availability)
- 16.2.11 Thermo Fisher Scientific
- 16.2.11.1. Overview
- 16.2.11.2. Products
- 16.2.11.3. SWOT Analysis
- 16.2.11.4. Recent Developments
- 16.2.11.5. Financials (Based on Availability)
- 16.2.12 Trinity Biotech
- 16.2.12.1. Overview
- 16.2.12.2. Products
- 16.2.12.3. SWOT Analysis
- 16.2.12.4. Recent Developments
- 16.2.12.5. Financials (Based on Availability)
- 16.2.1 Becton Dickinson and Company
List of Figures
- Figure 1: Global Virology Specimen Collection Market Revenue Breakdown (Million, %) by Region 2024 & 2032
- Figure 2: Global Virology Specimen Collection Market Volume Breakdown (K Unit, %) by Region 2024 & 2032
- Figure 3: North America Virology Specimen Collection Market Revenue (Million), by Country 2024 & 2032
- Figure 4: North America Virology Specimen Collection Market Volume (K Unit), by Country 2024 & 2032
- Figure 5: North America Virology Specimen Collection Market Revenue Share (%), by Country 2024 & 2032
- Figure 6: North America Virology Specimen Collection Market Volume Share (%), by Country 2024 & 2032
- Figure 7: Europe Virology Specimen Collection Market Revenue (Million), by Country 2024 & 2032
- Figure 8: Europe Virology Specimen Collection Market Volume (K Unit), by Country 2024 & 2032
- Figure 9: Europe Virology Specimen Collection Market Revenue Share (%), by Country 2024 & 2032
- Figure 10: Europe Virology Specimen Collection Market Volume Share (%), by Country 2024 & 2032
- Figure 11: Asia Pacific Virology Specimen Collection Market Revenue (Million), by Country 2024 & 2032
- Figure 12: Asia Pacific Virology Specimen Collection Market Volume (K Unit), by Country 2024 & 2032
- Figure 13: Asia Pacific Virology Specimen Collection Market Revenue Share (%), by Country 2024 & 2032
- Figure 14: Asia Pacific Virology Specimen Collection Market Volume Share (%), by Country 2024 & 2032
- Figure 15: Middle East and Africa Virology Specimen Collection Market Revenue (Million), by Country 2024 & 2032
- Figure 16: Middle East and Africa Virology Specimen Collection Market Volume (K Unit), by Country 2024 & 2032
- Figure 17: Middle East and Africa Virology Specimen Collection Market Revenue Share (%), by Country 2024 & 2032
- Figure 18: Middle East and Africa Virology Specimen Collection Market Volume Share (%), by Country 2024 & 2032
- Figure 19: South America Virology Specimen Collection Market Revenue (Million), by Country 2024 & 2032
- Figure 20: South America Virology Specimen Collection Market Volume (K Unit), by Country 2024 & 2032
- Figure 21: South America Virology Specimen Collection Market Revenue Share (%), by Country 2024 & 2032
- Figure 22: South America Virology Specimen Collection Market Volume Share (%), by Country 2024 & 2032
- Figure 23: North America Virology Specimen Collection Market Revenue (Million), by Product Type 2024 & 2032
- Figure 24: North America Virology Specimen Collection Market Volume (K Unit), by Product Type 2024 & 2032
- Figure 25: North America Virology Specimen Collection Market Revenue Share (%), by Product Type 2024 & 2032
- Figure 26: North America Virology Specimen Collection Market Volume Share (%), by Product Type 2024 & 2032
- Figure 27: North America Virology Specimen Collection Market Revenue (Million), by End users 2024 & 2032
- Figure 28: North America Virology Specimen Collection Market Volume (K Unit), by End users 2024 & 2032
- Figure 29: North America Virology Specimen Collection Market Revenue Share (%), by End users 2024 & 2032
- Figure 30: North America Virology Specimen Collection Market Volume Share (%), by End users 2024 & 2032
- Figure 31: North America Virology Specimen Collection Market Revenue (Million), by Country 2024 & 2032
- Figure 32: North America Virology Specimen Collection Market Volume (K Unit), by Country 2024 & 2032
- Figure 33: North America Virology Specimen Collection Market Revenue Share (%), by Country 2024 & 2032
- Figure 34: North America Virology Specimen Collection Market Volume Share (%), by Country 2024 & 2032
- Figure 35: Europe Virology Specimen Collection Market Revenue (Million), by Product Type 2024 & 2032
- Figure 36: Europe Virology Specimen Collection Market Volume (K Unit), by Product Type 2024 & 2032
- Figure 37: Europe Virology Specimen Collection Market Revenue Share (%), by Product Type 2024 & 2032
- Figure 38: Europe Virology Specimen Collection Market Volume Share (%), by Product Type 2024 & 2032
- Figure 39: Europe Virology Specimen Collection Market Revenue (Million), by End users 2024 & 2032
- Figure 40: Europe Virology Specimen Collection Market Volume (K Unit), by End users 2024 & 2032
- Figure 41: Europe Virology Specimen Collection Market Revenue Share (%), by End users 2024 & 2032
- Figure 42: Europe Virology Specimen Collection Market Volume Share (%), by End users 2024 & 2032
- Figure 43: Europe Virology Specimen Collection Market Revenue (Million), by Country 2024 & 2032
- Figure 44: Europe Virology Specimen Collection Market Volume (K Unit), by Country 2024 & 2032
- Figure 45: Europe Virology Specimen Collection Market Revenue Share (%), by Country 2024 & 2032
- Figure 46: Europe Virology Specimen Collection Market Volume Share (%), by Country 2024 & 2032
- Figure 47: Asia Pacific Virology Specimen Collection Market Revenue (Million), by Product Type 2024 & 2032
- Figure 48: Asia Pacific Virology Specimen Collection Market Volume (K Unit), by Product Type 2024 & 2032
- Figure 49: Asia Pacific Virology Specimen Collection Market Revenue Share (%), by Product Type 2024 & 2032
- Figure 50: Asia Pacific Virology Specimen Collection Market Volume Share (%), by Product Type 2024 & 2032
- Figure 51: Asia Pacific Virology Specimen Collection Market Revenue (Million), by End users 2024 & 2032
- Figure 52: Asia Pacific Virology Specimen Collection Market Volume (K Unit), by End users 2024 & 2032
- Figure 53: Asia Pacific Virology Specimen Collection Market Revenue Share (%), by End users 2024 & 2032
- Figure 54: Asia Pacific Virology Specimen Collection Market Volume Share (%), by End users 2024 & 2032
- Figure 55: Asia Pacific Virology Specimen Collection Market Revenue (Million), by Country 2024 & 2032
- Figure 56: Asia Pacific Virology Specimen Collection Market Volume (K Unit), by Country 2024 & 2032
- Figure 57: Asia Pacific Virology Specimen Collection Market Revenue Share (%), by Country 2024 & 2032
- Figure 58: Asia Pacific Virology Specimen Collection Market Volume Share (%), by Country 2024 & 2032
- Figure 59: Middle East and Africa Virology Specimen Collection Market Revenue (Million), by Product Type 2024 & 2032
- Figure 60: Middle East and Africa Virology Specimen Collection Market Volume (K Unit), by Product Type 2024 & 2032
- Figure 61: Middle East and Africa Virology Specimen Collection Market Revenue Share (%), by Product Type 2024 & 2032
- Figure 62: Middle East and Africa Virology Specimen Collection Market Volume Share (%), by Product Type 2024 & 2032
- Figure 63: Middle East and Africa Virology Specimen Collection Market Revenue (Million), by End users 2024 & 2032
- Figure 64: Middle East and Africa Virology Specimen Collection Market Volume (K Unit), by End users 2024 & 2032
- Figure 65: Middle East and Africa Virology Specimen Collection Market Revenue Share (%), by End users 2024 & 2032
- Figure 66: Middle East and Africa Virology Specimen Collection Market Volume Share (%), by End users 2024 & 2032
- Figure 67: Middle East and Africa Virology Specimen Collection Market Revenue (Million), by Country 2024 & 2032
- Figure 68: Middle East and Africa Virology Specimen Collection Market Volume (K Unit), by Country 2024 & 2032
- Figure 69: Middle East and Africa Virology Specimen Collection Market Revenue Share (%), by Country 2024 & 2032
- Figure 70: Middle East and Africa Virology Specimen Collection Market Volume Share (%), by Country 2024 & 2032
- Figure 71: South America Virology Specimen Collection Market Revenue (Million), by Product Type 2024 & 2032
- Figure 72: South America Virology Specimen Collection Market Volume (K Unit), by Product Type 2024 & 2032
- Figure 73: South America Virology Specimen Collection Market Revenue Share (%), by Product Type 2024 & 2032
- Figure 74: South America Virology Specimen Collection Market Volume Share (%), by Product Type 2024 & 2032
- Figure 75: South America Virology Specimen Collection Market Revenue (Million), by End users 2024 & 2032
- Figure 76: South America Virology Specimen Collection Market Volume (K Unit), by End users 2024 & 2032
- Figure 77: South America Virology Specimen Collection Market Revenue Share (%), by End users 2024 & 2032
- Figure 78: South America Virology Specimen Collection Market Volume Share (%), by End users 2024 & 2032
- Figure 79: South America Virology Specimen Collection Market Revenue (Million), by Country 2024 & 2032
- Figure 80: South America Virology Specimen Collection Market Volume (K Unit), by Country 2024 & 2032
- Figure 81: South America Virology Specimen Collection Market Revenue Share (%), by Country 2024 & 2032
- Figure 82: South America Virology Specimen Collection Market Volume Share (%), by Country 2024 & 2032
List of Tables
- Table 1: Global Virology Specimen Collection Market Revenue Million Forecast, by Region 2019 & 2032
- Table 2: Global Virology Specimen Collection Market Volume K Unit Forecast, by Region 2019 & 2032
- Table 3: Global Virology Specimen Collection Market Revenue Million Forecast, by Product Type 2019 & 2032
- Table 4: Global Virology Specimen Collection Market Volume K Unit Forecast, by Product Type 2019 & 2032
- Table 5: Global Virology Specimen Collection Market Revenue Million Forecast, by End users 2019 & 2032
- Table 6: Global Virology Specimen Collection Market Volume K Unit Forecast, by End users 2019 & 2032
- Table 7: Global Virology Specimen Collection Market Revenue Million Forecast, by Region 2019 & 2032
- Table 8: Global Virology Specimen Collection Market Volume K Unit Forecast, by Region 2019 & 2032
- Table 9: Global Virology Specimen Collection Market Revenue Million Forecast, by Country 2019 & 2032
- Table 10: Global Virology Specimen Collection Market Volume K Unit Forecast, by Country 2019 & 2032
- Table 11: United States Virology Specimen Collection Market Revenue (Million) Forecast, by Application 2019 & 2032
- Table 12: United States Virology Specimen Collection Market Volume (K Unit) Forecast, by Application 2019 & 2032
- Table 13: Canada Virology Specimen Collection Market Revenue (Million) Forecast, by Application 2019 & 2032
- Table 14: Canada Virology Specimen Collection Market Volume (K Unit) Forecast, by Application 2019 & 2032
- Table 15: Mexico Virology Specimen Collection Market Revenue (Million) Forecast, by Application 2019 & 2032
- Table 16: Mexico Virology Specimen Collection Market Volume (K Unit) Forecast, by Application 2019 & 2032
- Table 17: Global Virology Specimen Collection Market Revenue Million Forecast, by Country 2019 & 2032
- Table 18: Global Virology Specimen Collection Market Volume K Unit Forecast, by Country 2019 & 2032
- Table 19: Germany Virology Specimen Collection Market Revenue (Million) Forecast, by Application 2019 & 2032
- Table 20: Germany Virology Specimen Collection Market Volume (K Unit) Forecast, by Application 2019 & 2032
- Table 21: United Kingdom Virology Specimen Collection Market Revenue (Million) Forecast, by Application 2019 & 2032
- Table 22: United Kingdom Virology Specimen Collection Market Volume (K Unit) Forecast, by Application 2019 & 2032
- Table 23: France Virology Specimen Collection Market Revenue (Million) Forecast, by Application 2019 & 2032
- Table 24: France Virology Specimen Collection Market Volume (K Unit) Forecast, by Application 2019 & 2032
- Table 25: Italy Virology Specimen Collection Market Revenue (Million) Forecast, by Application 2019 & 2032
- Table 26: Italy Virology Specimen Collection Market Volume (K Unit) Forecast, by Application 2019 & 2032
- Table 27: Spain Virology Specimen Collection Market Revenue (Million) Forecast, by Application 2019 & 2032
- Table 28: Spain Virology Specimen Collection Market Volume (K Unit) Forecast, by Application 2019 & 2032
- Table 29: Rest of Europe Virology Specimen Collection Market Revenue (Million) Forecast, by Application 2019 & 2032
- Table 30: Rest of Europe Virology Specimen Collection Market Volume (K Unit) Forecast, by Application 2019 & 2032
- Table 31: Global Virology Specimen Collection Market Revenue Million Forecast, by Country 2019 & 2032
- Table 32: Global Virology Specimen Collection Market Volume K Unit Forecast, by Country 2019 & 2032
- Table 33: China Virology Specimen Collection Market Revenue (Million) Forecast, by Application 2019 & 2032
- Table 34: China Virology Specimen Collection Market Volume (K Unit) Forecast, by Application 2019 & 2032
- Table 35: Japan Virology Specimen Collection Market Revenue (Million) Forecast, by Application 2019 & 2032
- Table 36: Japan Virology Specimen Collection Market Volume (K Unit) Forecast, by Application 2019 & 2032
- Table 37: India Virology Specimen Collection Market Revenue (Million) Forecast, by Application 2019 & 2032
- Table 38: India Virology Specimen Collection Market Volume (K Unit) Forecast, by Application 2019 & 2032
- Table 39: Australia Virology Specimen Collection Market Revenue (Million) Forecast, by Application 2019 & 2032
- Table 40: Australia Virology Specimen Collection Market Volume (K Unit) Forecast, by Application 2019 & 2032
- Table 41: South Korea Virology Specimen Collection Market Revenue (Million) Forecast, by Application 2019 & 2032
- Table 42: South Korea Virology Specimen Collection Market Volume (K Unit) Forecast, by Application 2019 & 2032
- Table 43: Rest of Asia Pacific Virology Specimen Collection Market Revenue (Million) Forecast, by Application 2019 & 2032
- Table 44: Rest of Asia Pacific Virology Specimen Collection Market Volume (K Unit) Forecast, by Application 2019 & 2032
- Table 45: Global Virology Specimen Collection Market Revenue Million Forecast, by Country 2019 & 2032
- Table 46: Global Virology Specimen Collection Market Volume K Unit Forecast, by Country 2019 & 2032
- Table 47: GCC Virology Specimen Collection Market Revenue (Million) Forecast, by Application 2019 & 2032
- Table 48: GCC Virology Specimen Collection Market Volume (K Unit) Forecast, by Application 2019 & 2032
- Table 49: South Africa Virology Specimen Collection Market Revenue (Million) Forecast, by Application 2019 & 2032
- Table 50: South Africa Virology Specimen Collection Market Volume (K Unit) Forecast, by Application 2019 & 2032
- Table 51: Rest of Middle East and Africa Virology Specimen Collection Market Revenue (Million) Forecast, by Application 2019 & 2032
- Table 52: Rest of Middle East and Africa Virology Specimen Collection Market Volume (K Unit) Forecast, by Application 2019 & 2032
- Table 53: Global Virology Specimen Collection Market Revenue Million Forecast, by Country 2019 & 2032
- Table 54: Global Virology Specimen Collection Market Volume K Unit Forecast, by Country 2019 & 2032
- Table 55: Brazil Virology Specimen Collection Market Revenue (Million) Forecast, by Application 2019 & 2032
- Table 56: Brazil Virology Specimen Collection Market Volume (K Unit) Forecast, by Application 2019 & 2032
- Table 57: Argentina Virology Specimen Collection Market Revenue (Million) Forecast, by Application 2019 & 2032
- Table 58: Argentina Virology Specimen Collection Market Volume (K Unit) Forecast, by Application 2019 & 2032
- Table 59: Rest of South America Virology Specimen Collection Market Revenue (Million) Forecast, by Application 2019 & 2032
- Table 60: Rest of South America Virology Specimen Collection Market Volume (K Unit) Forecast, by Application 2019 & 2032
- Table 61: Global Virology Specimen Collection Market Revenue Million Forecast, by Product Type 2019 & 2032
- Table 62: Global Virology Specimen Collection Market Volume K Unit Forecast, by Product Type 2019 & 2032
- Table 63: Global Virology Specimen Collection Market Revenue Million Forecast, by End users 2019 & 2032
- Table 64: Global Virology Specimen Collection Market Volume K Unit Forecast, by End users 2019 & 2032
- Table 65: Global Virology Specimen Collection Market Revenue Million Forecast, by Country 2019 & 2032
- Table 66: Global Virology Specimen Collection Market Volume K Unit Forecast, by Country 2019 & 2032
- Table 67: United States Virology Specimen Collection Market Revenue (Million) Forecast, by Application 2019 & 2032
- Table 68: United States Virology Specimen Collection Market Volume (K Unit) Forecast, by Application 2019 & 2032
- Table 69: Canada Virology Specimen Collection Market Revenue (Million) Forecast, by Application 2019 & 2032
- Table 70: Canada Virology Specimen Collection Market Volume (K Unit) Forecast, by Application 2019 & 2032
- Table 71: Mexico Virology Specimen Collection Market Revenue (Million) Forecast, by Application 2019 & 2032
- Table 72: Mexico Virology Specimen Collection Market Volume (K Unit) Forecast, by Application 2019 & 2032
- Table 73: Global Virology Specimen Collection Market Revenue Million Forecast, by Product Type 2019 & 2032
- Table 74: Global Virology Specimen Collection Market Volume K Unit Forecast, by Product Type 2019 & 2032
- Table 75: Global Virology Specimen Collection Market Revenue Million Forecast, by End users 2019 & 2032
- Table 76: Global Virology Specimen Collection Market Volume K Unit Forecast, by End users 2019 & 2032
- Table 77: Global Virology Specimen Collection Market Revenue Million Forecast, by Country 2019 & 2032
- Table 78: Global Virology Specimen Collection Market Volume K Unit Forecast, by Country 2019 & 2032
- Table 79: Germany Virology Specimen Collection Market Revenue (Million) Forecast, by Application 2019 & 2032
- Table 80: Germany Virology Specimen Collection Market Volume (K Unit) Forecast, by Application 2019 & 2032
- Table 81: United Kingdom Virology Specimen Collection Market Revenue (Million) Forecast, by Application 2019 & 2032
- Table 82: United Kingdom Virology Specimen Collection Market Volume (K Unit) Forecast, by Application 2019 & 2032
- Table 83: France Virology Specimen Collection Market Revenue (Million) Forecast, by Application 2019 & 2032
- Table 84: France Virology Specimen Collection Market Volume (K Unit) Forecast, by Application 2019 & 2032
- Table 85: Italy Virology Specimen Collection Market Revenue (Million) Forecast, by Application 2019 & 2032
- Table 86: Italy Virology Specimen Collection Market Volume (K Unit) Forecast, by Application 2019 & 2032
- Table 87: Spain Virology Specimen Collection Market Revenue (Million) Forecast, by Application 2019 & 2032
- Table 88: Spain Virology Specimen Collection Market Volume (K Unit) Forecast, by Application 2019 & 2032
- Table 89: Rest of Europe Virology Specimen Collection Market Revenue (Million) Forecast, by Application 2019 & 2032
- Table 90: Rest of Europe Virology Specimen Collection Market Volume (K Unit) Forecast, by Application 2019 & 2032
- Table 91: Global Virology Specimen Collection Market Revenue Million Forecast, by Product Type 2019 & 2032
- Table 92: Global Virology Specimen Collection Market Volume K Unit Forecast, by Product Type 2019 & 2032
- Table 93: Global Virology Specimen Collection Market Revenue Million Forecast, by End users 2019 & 2032
- Table 94: Global Virology Specimen Collection Market Volume K Unit Forecast, by End users 2019 & 2032
- Table 95: Global Virology Specimen Collection Market Revenue Million Forecast, by Country 2019 & 2032
- Table 96: Global Virology Specimen Collection Market Volume K Unit Forecast, by Country 2019 & 2032
- Table 97: China Virology Specimen Collection Market Revenue (Million) Forecast, by Application 2019 & 2032
- Table 98: China Virology Specimen Collection Market Volume (K Unit) Forecast, by Application 2019 & 2032
- Table 99: Japan Virology Specimen Collection Market Revenue (Million) Forecast, by Application 2019 & 2032
- Table 100: Japan Virology Specimen Collection Market Volume (K Unit) Forecast, by Application 2019 & 2032
- Table 101: India Virology Specimen Collection Market Revenue (Million) Forecast, by Application 2019 & 2032
- Table 102: India Virology Specimen Collection Market Volume (K Unit) Forecast, by Application 2019 & 2032
- Table 103: Australia Virology Specimen Collection Market Revenue (Million) Forecast, by Application 2019 & 2032
- Table 104: Australia Virology Specimen Collection Market Volume (K Unit) Forecast, by Application 2019 & 2032
- Table 105: South Korea Virology Specimen Collection Market Revenue (Million) Forecast, by Application 2019 & 2032
- Table 106: South Korea Virology Specimen Collection Market Volume (K Unit) Forecast, by Application 2019 & 2032
- Table 107: Rest of Asia Pacific Virology Specimen Collection Market Revenue (Million) Forecast, by Application 2019 & 2032
- Table 108: Rest of Asia Pacific Virology Specimen Collection Market Volume (K Unit) Forecast, by Application 2019 & 2032
- Table 109: Global Virology Specimen Collection Market Revenue Million Forecast, by Product Type 2019 & 2032
- Table 110: Global Virology Specimen Collection Market Volume K Unit Forecast, by Product Type 2019 & 2032
- Table 111: Global Virology Specimen Collection Market Revenue Million Forecast, by End users 2019 & 2032
- Table 112: Global Virology Specimen Collection Market Volume K Unit Forecast, by End users 2019 & 2032
- Table 113: Global Virology Specimen Collection Market Revenue Million Forecast, by Country 2019 & 2032
- Table 114: Global Virology Specimen Collection Market Volume K Unit Forecast, by Country 2019 & 2032
- Table 115: GCC Virology Specimen Collection Market Revenue (Million) Forecast, by Application 2019 & 2032
- Table 116: GCC Virology Specimen Collection Market Volume (K Unit) Forecast, by Application 2019 & 2032
- Table 117: South Africa Virology Specimen Collection Market Revenue (Million) Forecast, by Application 2019 & 2032
- Table 118: South Africa Virology Specimen Collection Market Volume (K Unit) Forecast, by Application 2019 & 2032
- Table 119: Rest of Middle East and Africa Virology Specimen Collection Market Revenue (Million) Forecast, by Application 2019 & 2032
- Table 120: Rest of Middle East and Africa Virology Specimen Collection Market Volume (K Unit) Forecast, by Application 2019 & 2032
- Table 121: Global Virology Specimen Collection Market Revenue Million Forecast, by Product Type 2019 & 2032
- Table 122: Global Virology Specimen Collection Market Volume K Unit Forecast, by Product Type 2019 & 2032
- Table 123: Global Virology Specimen Collection Market Revenue Million Forecast, by End users 2019 & 2032
- Table 124: Global Virology Specimen Collection Market Volume K Unit Forecast, by End users 2019 & 2032
- Table 125: Global Virology Specimen Collection Market Revenue Million Forecast, by Country 2019 & 2032
- Table 126: Global Virology Specimen Collection Market Volume K Unit Forecast, by Country 2019 & 2032
- Table 127: Brazil Virology Specimen Collection Market Revenue (Million) Forecast, by Application 2019 & 2032
- Table 128: Brazil Virology Specimen Collection Market Volume (K Unit) Forecast, by Application 2019 & 2032
- Table 129: Argentina Virology Specimen Collection Market Revenue (Million) Forecast, by Application 2019 & 2032
- Table 130: Argentina Virology Specimen Collection Market Volume (K Unit) Forecast, by Application 2019 & 2032
- Table 131: Rest of South America Virology Specimen Collection Market Revenue (Million) Forecast, by Application 2019 & 2032
- Table 132: Rest of South America Virology Specimen Collection Market Volume (K Unit) Forecast, by Application 2019 & 2032
Frequently Asked Questions
1. What is the projected Compound Annual Growth Rate (CAGR) of the Virology Specimen Collection Market?
The projected CAGR is approximately 14.00%.
2. Which companies are prominent players in the Virology Specimen Collection Market?
Key companies in the market include Becton Dickinson and Company, Puritan Medical Products, Quidel Corporation, Vircell, Medical Wire and Equipment, COPAN diagnostics Inc, Titan Biotech limited, Hardy Diagnostics, Pretium Packaging, EKF diagnostics, Thermo Fisher Scientific, Trinity Biotech.
3. What are the main segments of the Virology Specimen Collection Market?
The market segments include Product Type, End users.
4. Can you provide details about the market size?
The market size is estimated to be USD XX Million as of 2022.
5. What are some drivers contributing to market growth?
Increasing Prevalence of Viral Diseases and Emergence of New Pathogens; Rising Number of Blood Donations.
6. What are the notable trends driving market growth?
The Hospitals and Clinics Segment is Expected to Hold a Major Market Share Over the Forecast Period.
7. Are there any restraints impacting market growth?
High Cost of Collection Kits and Technologies.
8. Can you provide examples of recent developments in the market?
In March 2022, Thermo Fisher Scientific developed the InhibiSURE Viral Inactivation Medium and launched it in Europe. It is a new viral transport medium that enables collection and rapid inactivation of the SARS-CoV-2 virus and stabilizes viral RNA at ambient temperature for transportation and use in in vitro diagnostic testing procedures.
9. What pricing options are available for accessing the report?
Pricing options include single-user, multi-user, and enterprise licenses priced at USD 4750, USD 5250, and USD 8750 respectively.
10. Is the market size provided in terms of value or volume?
The market size is provided in terms of value, measured in Million and volume, measured in K Unit.
11. Are there any specific market keywords associated with the report?
Yes, the market keyword associated with the report is "Virology Specimen Collection Market," which aids in identifying and referencing the specific market segment covered.
12. How do I determine which pricing option suits my needs best?
The pricing options vary based on user requirements and access needs. Individual users may opt for single-user licenses, while businesses requiring broader access may choose multi-user or enterprise licenses for cost-effective access to the report.
13. Are there any additional resources or data provided in the Virology Specimen Collection Market report?
While the report offers comprehensive insights, it's advisable to review the specific contents or supplementary materials provided to ascertain if additional resources or data are available.
14. How can I stay updated on further developments or reports in the Virology Specimen Collection Market?
To stay informed about further developments, trends, and reports in the Virology Specimen Collection Market, consider subscribing to industry newsletters, following relevant companies and organizations, or regularly checking reputable industry news sources and publications.
Methodology
Step 1 - Identification of Relevant Samples Size from Population Database


Step 2 - Approaches for Defining Global Market Size (Value, Volume* & Price*)

Note*: In applicable scenarios
Step 3 - Data Sources
Primary Research
- Web Analytics
- Survey Reports
- Research Institute
- Latest Research Reports
- Opinion Leaders
Secondary Research
- Annual Reports
- White Paper
- Latest Press Release
- Industry Association
- Paid Database
- Investor Presentations

Step 4 - Data Triangulation
Involves using different sources of information in order to increase the validity of a study
These sources are likely to be stakeholders in a program - participants, other researchers, program staff, other community members, and so on.
Then we put all data in single framework & apply various statistical tools to find out the dynamic on the market.
During the analysis stage, feedback from the stakeholder groups would be compared to determine areas of agreement as well as areas of divergence


