
Key Insights
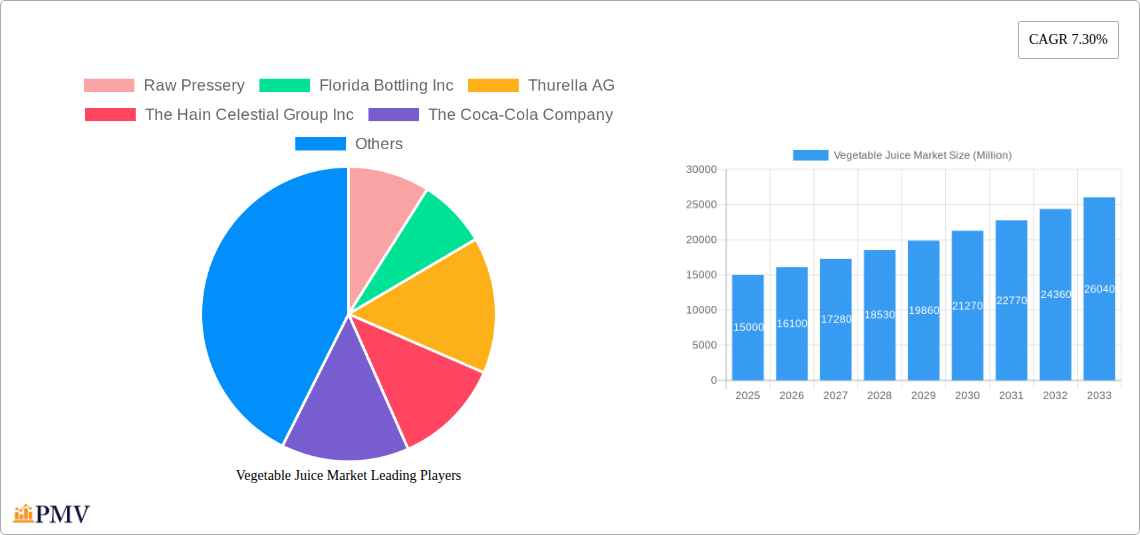
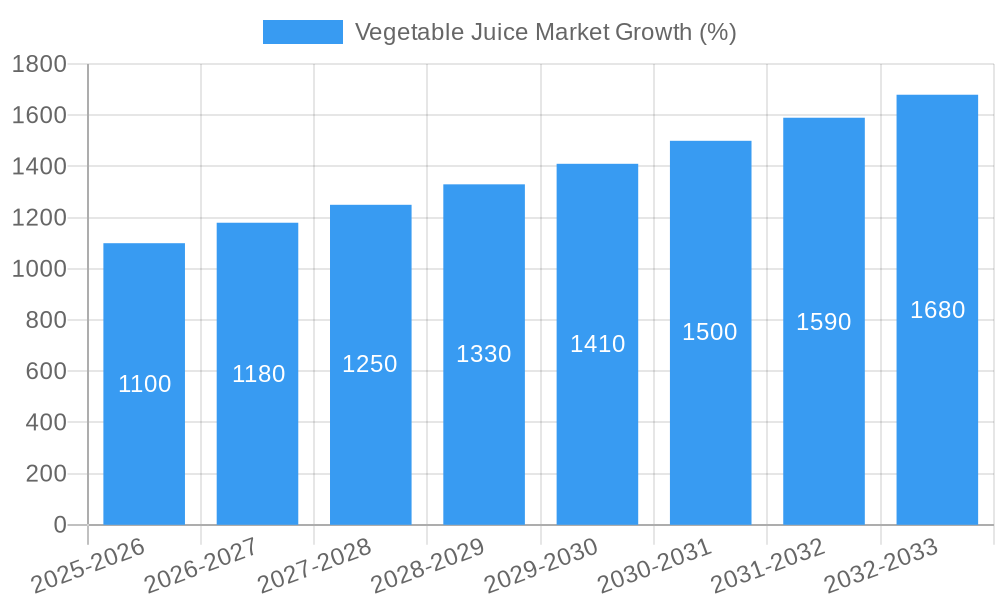
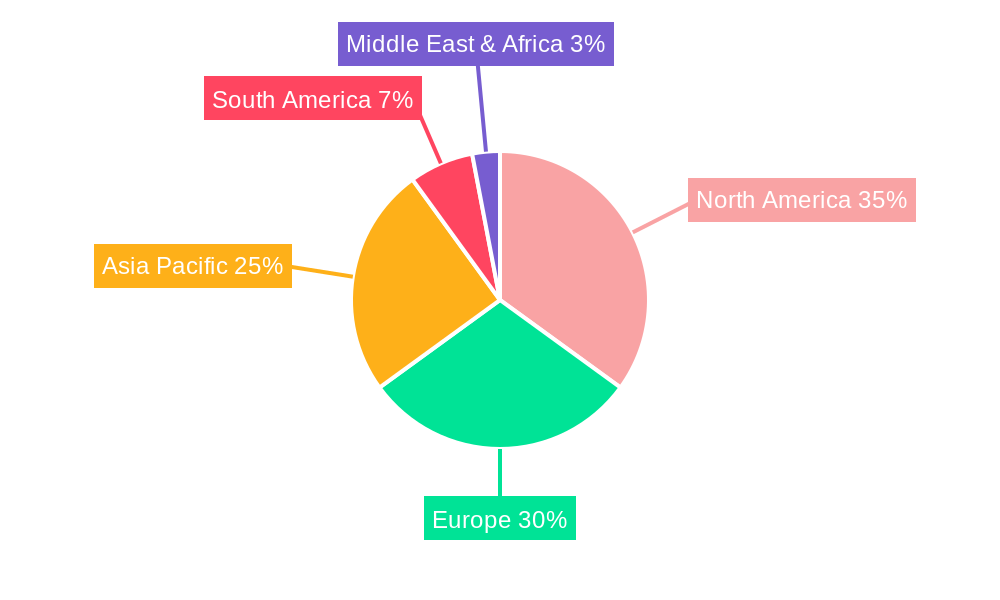
The global vegetable juice market, currently experiencing robust growth, is projected to maintain a significant Compound Annual Growth Rate (CAGR) of 7.30% from 2025 to 2033. This expansion is driven by several key factors. The rising consumer awareness of health and wellness, coupled with a growing preference for convenient and nutritious food and beverage options, fuels demand for vegetable juices. The increasing prevalence of health conditions like obesity and cardiovascular diseases, further motivates consumers to incorporate healthier choices into their diets. Market segmentation reveals strong performance across various categories. Cold-pressed juices are gaining popularity due to their perceived higher nutritional value and fresher taste profile. Bottled packaging dominates the market due to its convenience and perceived quality, although cans are also experiencing growth, especially in the health-conscious consumer segment. Distribution channels are diverse, with supermarkets/hypermarkets holding the largest market share, followed by convenience stores and the rapidly expanding online retail sector. Carrot, spinach, and kale remain the most popular vegetable juice types, but the "other products" segment shows promising growth potential, indicating increasing consumer experimentation with diverse vegetable blends. Key players like Raw Pressery, Naked Juice (PepsiCo), and The Hain Celestial Group are driving innovation and expanding product offerings to cater to evolving consumer preferences and health trends. Competitive landscape is dynamic with both established players and niche brands vying for market dominance. Regional analysis indicates that North America and Europe currently hold significant market shares, attributed to high disposable incomes and established health-conscious consumer bases. However, the Asia-Pacific region is expected to witness substantial growth in the coming years due to rapidly rising middle class and increasing awareness of health benefits.
The market's growth is not without its challenges. Price sensitivity among consumers, particularly in emerging markets, presents a significant restraint. Furthermore, concerns about added sugars and preservatives in some commercially available vegetable juices may negatively impact growth if not effectively addressed through product innovation. Manufacturers are increasingly focusing on natural and organic ingredients to address these concerns. The future trajectory of the vegetable juice market depends on several factors including consistent innovation in product development, expansion of distribution channels, and targeted marketing campaigns to highlight the health benefits of vegetable juices. Successful brands will leverage these opportunities to capitalize on the growing consumer demand for healthy and convenient beverage options.
Vegetable Juice Market: A Comprehensive Report (2019-2033)
This in-depth report provides a comprehensive analysis of the global vegetable juice market, encompassing market size, segmentation, competitive landscape, and future growth projections from 2019 to 2033. The study period covers 2019-2024 (Historical Period), with 2025 serving as the base and estimated year. The forecast period extends from 2025 to 2033. This report is essential for businesses, investors, and stakeholders seeking actionable insights into this dynamic market. The total market value is predicted to reach xx Million by 2033.
Vegetable Juice Market Structure & Competitive Dynamics
The vegetable juice market exhibits a moderately concentrated structure, with both large multinational corporations and smaller niche players vying for market share. Market concentration is influenced by factors like brand recognition, distribution networks, and innovative product offerings. Key players include Raw Pressery, Florida Bottling Inc, Thurella AG, The Hain Celestial Group Inc, The Coca-Cola Company, Campbell Soup Company, Pressed Juicery Inc, Hoogesteger, AllWellO, and Naked Juice Company (PepsiCo Inc). However, this list is not exhaustive, and many regional and smaller brands significantly contribute to overall market volume.
The innovation ecosystem is characterized by ongoing R&D efforts focused on enhancing product quality, extending shelf life, and developing new flavors and functional benefits. Regulatory frameworks, varying across different regions, impact labeling requirements, health claims, and ingredient sourcing. The market faces competition from substitute beverages like fruit juices, smoothies, and other healthy drinks. End-user trends favor healthier and more convenient beverage options, driving demand for organic, cold-pressed, and functional vegetable juices.
Mergers and acquisitions (M&A) play a significant role in shaping the competitive dynamics. While precise M&A deal values are not publicly available for all transactions in this sector, the trend shows larger companies acquiring smaller, innovative brands to expand their product portfolios and market reach. For example, PepsiCo's acquisition of Naked Juice demonstrates the strategic importance of this segment. This competitive landscape further includes factors such as market share, pricing strategies, distribution networks, and marketing efforts of the companies listed above. Market share data for individual companies is not publicly disclosed comprehensively across all regions but varies greatly based on region and distribution channels.
Vegetable Juice Market Industry Trends & Insights
The global vegetable juice market is experiencing robust growth, driven by several key factors. The increasing consumer awareness of health and wellness, coupled with a rising preference for natural and convenient food and beverage choices, fuels market expansion. The growing popularity of veganism and vegetarianism is another significant driver, as vegetable juice provides a convenient source of essential vitamins and minerals. The increasing adoption of functional beverages enriched with added vitamins, minerals, and probiotics further drives the demand for vegetable juices. Technological advancements in processing and packaging, such as high-pressure processing (HPP) for cold-pressed juices and sustainable packaging options, contribute to market growth.
Consumer preference for organic and sustainably sourced ingredients is gaining traction, and this trend influences the type of vegetable juice consumed. This is creating opportunities for brands that emphasize transparency and sustainable practices in their supply chains. The market growth rate (CAGR) is estimated to be xx% during the forecast period (2025-2033), with a market penetration rate of xx% by 2033. Competitive dynamics are characterized by both price competition and differentiation based on product quality, branding, and functional benefits. The intense competition is driving innovation and pushing companies to improve their offerings to meet growing consumer demands.
Dominant Markets & Segments in Vegetable Juice Market
The North American region currently holds a dominant position in the global vegetable juice market, driven by high consumer disposable income, strong health consciousness, and a developed distribution network. Within North America, the United States and Canada are the major contributors.
- By Category: Cold-pressed vegetable juices are gaining popularity due to their perceived superior nutritional value and fresher taste, commanding a higher price point compared to conventionally processed juices.
- By Packaging: Bottles are the most prevalent packaging type, followed by cans and other formats such as pouches and tetra packs. The choice of packaging greatly influences pricing and shelf life.
- By Distribution: Supermarkets/hypermarkets remain the primary distribution channel, offering wide reach and accessibility to consumers. However, online retail and convenience stores are expanding their presence, catering to consumer demand for convenience.
- By Product Type: Carrot, spinach, and kale are among the most popular vegetable juice types, though other blends and combinations are gaining traction. Consumer preferences and seasonal availability influence market share within product types.
Key drivers for the dominance of specific regions and segments include economic policies that promote healthy eating habits, robust infrastructure supporting the food and beverage industry, and strong consumer spending power. For example, government initiatives promoting healthier diets can significantly influence consumption patterns.
Vegetable Juice Market Product Innovations
Recent product innovations in the vegetable juice market focus on enhancing nutritional value, taste, and convenience. This includes the development of functional juices fortified with added nutrients, organic and sustainably sourced ingredients, and innovative packaging options that improve shelf life and reduce environmental impact. Technological advancements such as high-pressure processing (HPP) allow for the creation of cold-pressed juices with extended shelf life while maintaining freshness and nutritional quality. The market is witnessing the rise of ready-to-drink (RTD) vegetable juice shots designed for quick consumption, aligning with busy lifestyles. These innovations are driving market growth and providing competitive advantages for companies that embrace them effectively.
Report Segmentation & Scope
This report segments the vegetable juice market across several key parameters:
- By Category: Cold-pressed and conventional vegetable juices, each exhibiting unique growth trajectories and competitive dynamics. Cold-pressed juices are expected to see faster growth due to increasing health consciousness. Market sizes for both categories are xx Million in the base year and are projected to reach xx Million and xx Million respectively by 2033.
- By Packaging: Bottles, cans, and other packaging options. Bottles currently dominate but flexible packaging is showing growth. Market sizes vary widely based on packaging type and regional preferences, with detailed breakdown provided in the full report.
- By Distribution: Supermarkets/hypermarkets, convenience stores, online retail stores, and other distribution channels. Each channel exhibits unique growth potential. The full report provides a market size and growth projection for each channel.
- By Product Type: Carrot, spinach, kale, and other vegetable juices. Each product type has different market sizes and growth projections based on regional preferences and nutritional value perceptions. The full report details these specifics.
Key Drivers of Vegetable Juice Market Growth
The vegetable juice market is propelled by several key factors: the increasing consumer awareness of health and wellness, the rising demand for convenient and nutritious food and beverage options, and the growing popularity of plant-based diets. Technological advancements in processing and packaging contribute to extended shelf life and improved product quality, further enhancing market appeal. Government regulations promoting healthier lifestyles also exert a positive influence.
Challenges in the Vegetable Juice Market Sector
The vegetable juice market faces several challenges. Maintaining product freshness and extending shelf life remains a key hurdle, particularly for cold-pressed juices. Supply chain disruptions and fluctuations in raw material costs can significantly impact production and profitability. Intense competition from substitute beverages and other healthy options requires continuous innovation and differentiation. Meeting stringent regulatory requirements across different regions can also be challenging. These factors contribute to complexity and necessitate strategic adaptation for success.
Leading Players in the Vegetable Juice Market Market
- Raw Pressery
- Florida Bottling Inc
- Thurella AG
- The Hain Celestial Group Inc
- The Coca-Cola Company
- Campbell Soup Company
- Pressed Juicery Inc
- Hoogesteger
- AllWellO
- Naked Juice Company (PepsiCo Inc)
Key Developments in Vegetable Juice Market Sector
- March 2021: Naked Juice (PepsiCo) launched a new "rainbow machine" juice. This launch signifies PepsiCo’s commitment to innovation in the healthy beverage market.
- October 2021: Just Juice It launched cold-pressed vegetable juice shots. This reflects increasing consumer interest in convenient, high-nutrient options.
- April 2020: Rugani Juice launched its ABC juice. This signifies an increased focus on consumer health and well-being.
Strategic Vegetable Juice Market Outlook
The vegetable juice market holds significant future potential, driven by persistent health and wellness trends, increasing consumer demand for convenient, nutritious beverages, and ongoing innovation in product development and packaging. Strategic opportunities exist for companies to focus on organic and sustainable sourcing, functional formulations, and expanding into emerging markets. Meeting consumer demand for personalization and customized products will also be vital for success in this competitive market. Brands that adopt agile strategies and adapt to changing consumer preferences will likely capture a larger market share and drive significant growth in the coming years.
Vegetable Juice Market Segmentation
-
1. Product Type
- 1.1. Carrot
- 1.2. Spinach
- 1.3. Kale
- 1.4. Other Products
-
2. Category
- 2.1. Cold-Pressed
- 2.2. Conventional
-
3. Packaging
- 3.1. Bottle
- 3.2. Cans
- 3.3. Others
-
4. Distribution
- 4.1. Supermarkets/Hypermarkets
- 4.2. Convenience Stores
- 4.3. Online Retail Stores
- 4.4. Other Distribution Channels
Vegetable Juice Market Segmentation By Geography
-
1. North America
- 1.1. United States
- 1.2. Canada
- 1.3. Mexico
- 1.4. Rest of North America
-
2. Europe
- 2.1. United Kingdom
- 2.2. Germany
- 2.3. Italy
- 2.4. France
- 2.5. Spain
- 2.6. Russia
- 2.7. Rest of Europe
-
3. Asia Pacific
- 3.1. India
- 3.2. China
- 3.3. Japan
- 3.4. Australia
- 3.5. Rest of Asia Pacific
-
4. South America
- 4.1. Brazil
- 4.2. Argentina
- 4.3. Rest of South America
- 5. Middle East
-
6. South Africa
- 6.1. Saudi Arabia
- 6.2. Rest of Middle East
Vegetable Juice Market REPORT HIGHLIGHTS
| Aspects | Details |
|---|---|
| Study Period | 2019-2033 |
| Base Year | 2024 |
| Estimated Year | 2025 |
| Forecast Period | 2025-2033 |
| Historical Period | 2019-2024 |
| Growth Rate | CAGR of 7.30% from 2019-2033 |
| Segmentation |
|
Table of Contents
- 1. Introduction
- 1.1. Research Scope
- 1.2. Market Segmentation
- 1.3. Research Methodology
- 1.4. Definitions and Assumptions
- 2. Executive Summary
- 2.1. Introduction
- 3. Market Dynamics
- 3.1. Introduction
- 3.2. Market Drivers
- 3.2.1. Growing Demand for Convenience and Processed Foods Drives Demand; Expanding Cosmetic and Personal Care Industries Utilize Gelatin for Various Purposes
- 3.3. Market Restrains
- 3.3.1. Fluctuations in Raw Material Proces Affecting Production Costs
- 3.4. Market Trends
- 3.4.1. Rising Inclination Towards Cold-Pressed Vegetable Juice
- 4. Market Factor Analysis
- 4.1. Porters Five Forces
- 4.2. Supply/Value Chain
- 4.3. PESTEL analysis
- 4.4. Market Entropy
- 4.5. Patent/Trademark Analysis
- 5. Global Vegetable Juice Market Analysis, Insights and Forecast, 2019-2031
- 5.1. Market Analysis, Insights and Forecast - by Product Type
- 5.1.1. Carrot
- 5.1.2. Spinach
- 5.1.3. Kale
- 5.1.4. Other Products
- 5.2. Market Analysis, Insights and Forecast - by Category
- 5.2.1. Cold-Pressed
- 5.2.2. Conventional
- 5.3. Market Analysis, Insights and Forecast - by Packaging
- 5.3.1. Bottle
- 5.3.2. Cans
- 5.3.3. Others
- 5.4. Market Analysis, Insights and Forecast - by Distribution
- 5.4.1. Supermarkets/Hypermarkets
- 5.4.2. Convenience Stores
- 5.4.3. Online Retail Stores
- 5.4.4. Other Distribution Channels
- 5.5. Market Analysis, Insights and Forecast - by Region
- 5.5.1. North America
- 5.5.2. Europe
- 5.5.3. Asia Pacific
- 5.5.4. South America
- 5.5.5. Middle East
- 5.5.6. South Africa
- 5.1. Market Analysis, Insights and Forecast - by Product Type
- 6. North America Vegetable Juice Market Analysis, Insights and Forecast, 2019-2031
- 6.1. Market Analysis, Insights and Forecast - by Product Type
- 6.1.1. Carrot
- 6.1.2. Spinach
- 6.1.3. Kale
- 6.1.4. Other Products
- 6.2. Market Analysis, Insights and Forecast - by Category
- 6.2.1. Cold-Pressed
- 6.2.2. Conventional
- 6.3. Market Analysis, Insights and Forecast - by Packaging
- 6.3.1. Bottle
- 6.3.2. Cans
- 6.3.3. Others
- 6.4. Market Analysis, Insights and Forecast - by Distribution
- 6.4.1. Supermarkets/Hypermarkets
- 6.4.2. Convenience Stores
- 6.4.3. Online Retail Stores
- 6.4.4. Other Distribution Channels
- 6.1. Market Analysis, Insights and Forecast - by Product Type
- 7. Europe Vegetable Juice Market Analysis, Insights and Forecast, 2019-2031
- 7.1. Market Analysis, Insights and Forecast - by Product Type
- 7.1.1. Carrot
- 7.1.2. Spinach
- 7.1.3. Kale
- 7.1.4. Other Products
- 7.2. Market Analysis, Insights and Forecast - by Category
- 7.2.1. Cold-Pressed
- 7.2.2. Conventional
- 7.3. Market Analysis, Insights and Forecast - by Packaging
- 7.3.1. Bottle
- 7.3.2. Cans
- 7.3.3. Others
- 7.4. Market Analysis, Insights and Forecast - by Distribution
- 7.4.1. Supermarkets/Hypermarkets
- 7.4.2. Convenience Stores
- 7.4.3. Online Retail Stores
- 7.4.4. Other Distribution Channels
- 7.1. Market Analysis, Insights and Forecast - by Product Type
- 8. Asia Pacific Vegetable Juice Market Analysis, Insights and Forecast, 2019-2031
- 8.1. Market Analysis, Insights and Forecast - by Product Type
- 8.1.1. Carrot
- 8.1.2. Spinach
- 8.1.3. Kale
- 8.1.4. Other Products
- 8.2. Market Analysis, Insights and Forecast - by Category
- 8.2.1. Cold-Pressed
- 8.2.2. Conventional
- 8.3. Market Analysis, Insights and Forecast - by Packaging
- 8.3.1. Bottle
- 8.3.2. Cans
- 8.3.3. Others
- 8.4. Market Analysis, Insights and Forecast - by Distribution
- 8.4.1. Supermarkets/Hypermarkets
- 8.4.2. Convenience Stores
- 8.4.3. Online Retail Stores
- 8.4.4. Other Distribution Channels
- 8.1. Market Analysis, Insights and Forecast - by Product Type
- 9. South America Vegetable Juice Market Analysis, Insights and Forecast, 2019-2031
- 9.1. Market Analysis, Insights and Forecast - by Product Type
- 9.1.1. Carrot
- 9.1.2. Spinach
- 9.1.3. Kale
- 9.1.4. Other Products
- 9.2. Market Analysis, Insights and Forecast - by Category
- 9.2.1. Cold-Pressed
- 9.2.2. Conventional
- 9.3. Market Analysis, Insights and Forecast - by Packaging
- 9.3.1. Bottle
- 9.3.2. Cans
- 9.3.3. Others
- 9.4. Market Analysis, Insights and Forecast - by Distribution
- 9.4.1. Supermarkets/Hypermarkets
- 9.4.2. Convenience Stores
- 9.4.3. Online Retail Stores
- 9.4.4. Other Distribution Channels
- 9.1. Market Analysis, Insights and Forecast - by Product Type
- 10. Middle East Vegetable Juice Market Analysis, Insights and Forecast, 2019-2031
- 10.1. Market Analysis, Insights and Forecast - by Product Type
- 10.1.1. Carrot
- 10.1.2. Spinach
- 10.1.3. Kale
- 10.1.4. Other Products
- 10.2. Market Analysis, Insights and Forecast - by Category
- 10.2.1. Cold-Pressed
- 10.2.2. Conventional
- 10.3. Market Analysis, Insights and Forecast - by Packaging
- 10.3.1. Bottle
- 10.3.2. Cans
- 10.3.3. Others
- 10.4. Market Analysis, Insights and Forecast - by Distribution
- 10.4.1. Supermarkets/Hypermarkets
- 10.4.2. Convenience Stores
- 10.4.3. Online Retail Stores
- 10.4.4. Other Distribution Channels
- 10.1. Market Analysis, Insights and Forecast - by Product Type
- 11. South Africa Vegetable Juice Market Analysis, Insights and Forecast, 2019-2031
- 11.1. Market Analysis, Insights and Forecast - by Product Type
- 11.1.1. Carrot
- 11.1.2. Spinach
- 11.1.3. Kale
- 11.1.4. Other Products
- 11.2. Market Analysis, Insights and Forecast - by Category
- 11.2.1. Cold-Pressed
- 11.2.2. Conventional
- 11.3. Market Analysis, Insights and Forecast - by Packaging
- 11.3.1. Bottle
- 11.3.2. Cans
- 11.3.3. Others
- 11.4. Market Analysis, Insights and Forecast - by Distribution
- 11.4.1. Supermarkets/Hypermarkets
- 11.4.2. Convenience Stores
- 11.4.3. Online Retail Stores
- 11.4.4. Other Distribution Channels
- 11.1. Market Analysis, Insights and Forecast - by Product Type
- 12. North America Vegetable Juice Market Analysis, Insights and Forecast, 2019-2031
- 12.1. Market Analysis, Insights and Forecast - By Country/Sub-region
- 12.1.1 United States
- 12.1.2 Canada
- 12.1.3 Mexico
- 12.1.4 Rest of North America
- 13. Europe Vegetable Juice Market Analysis, Insights and Forecast, 2019-2031
- 13.1. Market Analysis, Insights and Forecast - By Country/Sub-region
- 13.1.1 United Kingdom
- 13.1.2 Germany
- 13.1.3 Italy
- 13.1.4 France
- 13.1.5 Spain
- 13.1.6 Russia
- 13.1.7 Rest of Europe
- 14. Asia Pacific Vegetable Juice Market Analysis, Insights and Forecast, 2019-2031
- 14.1. Market Analysis, Insights and Forecast - By Country/Sub-region
- 14.1.1 India
- 14.1.2 China
- 14.1.3 Japan
- 14.1.4 Australia
- 14.1.5 Rest of Asia Pacific
- 15. South America Vegetable Juice Market Analysis, Insights and Forecast, 2019-2031
- 15.1. Market Analysis, Insights and Forecast - By Country/Sub-region
- 15.1.1 Brazil
- 15.1.2 Argentina
- 15.1.3 Rest of South America
- 16. Middle East & Africa Vegetable Juice Market Analysis, Insights and Forecast, 2019-2031
- 16.1. Market Analysis, Insights and Forecast - By Country/Sub-region
- 16.1.1 UAE
- 16.1.2 South Africa
- 16.1.3 Saudi Arabia
- 16.1.4 Rest of MEA
- 17. Competitive Analysis
- 17.1. Global Market Share Analysis 2024
- 17.2. Company Profiles
- 17.2.1 Raw Pressery
- 17.2.1.1. Overview
- 17.2.1.2. Products
- 17.2.1.3. SWOT Analysis
- 17.2.1.4. Recent Developments
- 17.2.1.5. Financials (Based on Availability)
- 17.2.2 Florida Bottling Inc
- 17.2.2.1. Overview
- 17.2.2.2. Products
- 17.2.2.3. SWOT Analysis
- 17.2.2.4. Recent Developments
- 17.2.2.5. Financials (Based on Availability)
- 17.2.3 Thurella AG
- 17.2.3.1. Overview
- 17.2.3.2. Products
- 17.2.3.3. SWOT Analysis
- 17.2.3.4. Recent Developments
- 17.2.3.5. Financials (Based on Availability)
- 17.2.4 The Hain Celestial Group Inc
- 17.2.4.1. Overview
- 17.2.4.2. Products
- 17.2.4.3. SWOT Analysis
- 17.2.4.4. Recent Developments
- 17.2.4.5. Financials (Based on Availability)
- 17.2.5 The Coca-Cola Company
- 17.2.5.1. Overview
- 17.2.5.2. Products
- 17.2.5.3. SWOT Analysis
- 17.2.5.4. Recent Developments
- 17.2.5.5. Financials (Based on Availability)
- 17.2.6 Campbell Soup Company
- 17.2.6.1. Overview
- 17.2.6.2. Products
- 17.2.6.3. SWOT Analysis
- 17.2.6.4. Recent Developments
- 17.2.6.5. Financials (Based on Availability)
- 17.2.7 Pressed Juicery Inc *List Not Exhaustive
- 17.2.7.1. Overview
- 17.2.7.2. Products
- 17.2.7.3. SWOT Analysis
- 17.2.7.4. Recent Developments
- 17.2.7.5. Financials (Based on Availability)
- 17.2.8 Hoogesteger
- 17.2.8.1. Overview
- 17.2.8.2. Products
- 17.2.8.3. SWOT Analysis
- 17.2.8.4. Recent Developments
- 17.2.8.5. Financials (Based on Availability)
- 17.2.9 AllWellO
- 17.2.9.1. Overview
- 17.2.9.2. Products
- 17.2.9.3. SWOT Analysis
- 17.2.9.4. Recent Developments
- 17.2.9.5. Financials (Based on Availability)
- 17.2.10 Naked Juice Company (PepsiCo Inc )
- 17.2.10.1. Overview
- 17.2.10.2. Products
- 17.2.10.3. SWOT Analysis
- 17.2.10.4. Recent Developments
- 17.2.10.5. Financials (Based on Availability)
- 17.2.1 Raw Pressery
List of Figures
- Figure 1: Global Vegetable Juice Market Revenue Breakdown (Million, %) by Region 2024 & 2032
- Figure 2: Global Vegetable Juice Market Volume Breakdown (K Liters, %) by Region 2024 & 2032
- Figure 3: North America Vegetable Juice Market Revenue (Million), by Country 2024 & 2032
- Figure 4: North America Vegetable Juice Market Volume (K Liters), by Country 2024 & 2032
- Figure 5: North America Vegetable Juice Market Revenue Share (%), by Country 2024 & 2032
- Figure 6: North America Vegetable Juice Market Volume Share (%), by Country 2024 & 2032
- Figure 7: Europe Vegetable Juice Market Revenue (Million), by Country 2024 & 2032
- Figure 8: Europe Vegetable Juice Market Volume (K Liters), by Country 2024 & 2032
- Figure 9: Europe Vegetable Juice Market Revenue Share (%), by Country 2024 & 2032
- Figure 10: Europe Vegetable Juice Market Volume Share (%), by Country 2024 & 2032
- Figure 11: Asia Pacific Vegetable Juice Market Revenue (Million), by Country 2024 & 2032
- Figure 12: Asia Pacific Vegetable Juice Market Volume (K Liters), by Country 2024 & 2032
- Figure 13: Asia Pacific Vegetable Juice Market Revenue Share (%), by Country 2024 & 2032
- Figure 14: Asia Pacific Vegetable Juice Market Volume Share (%), by Country 2024 & 2032
- Figure 15: South America Vegetable Juice Market Revenue (Million), by Country 2024 & 2032
- Figure 16: South America Vegetable Juice Market Volume (K Liters), by Country 2024 & 2032
- Figure 17: South America Vegetable Juice Market Revenue Share (%), by Country 2024 & 2032
- Figure 18: South America Vegetable Juice Market Volume Share (%), by Country 2024 & 2032
- Figure 19: Middle East & Africa Vegetable Juice Market Revenue (Million), by Country 2024 & 2032
- Figure 20: Middle East & Africa Vegetable Juice Market Volume (K Liters), by Country 2024 & 2032
- Figure 21: Middle East & Africa Vegetable Juice Market Revenue Share (%), by Country 2024 & 2032
- Figure 22: Middle East & Africa Vegetable Juice Market Volume Share (%), by Country 2024 & 2032
- Figure 23: North America Vegetable Juice Market Revenue (Million), by Product Type 2024 & 2032
- Figure 24: North America Vegetable Juice Market Volume (K Liters), by Product Type 2024 & 2032
- Figure 25: North America Vegetable Juice Market Revenue Share (%), by Product Type 2024 & 2032
- Figure 26: North America Vegetable Juice Market Volume Share (%), by Product Type 2024 & 2032
- Figure 27: North America Vegetable Juice Market Revenue (Million), by Category 2024 & 2032
- Figure 28: North America Vegetable Juice Market Volume (K Liters), by Category 2024 & 2032
- Figure 29: North America Vegetable Juice Market Revenue Share (%), by Category 2024 & 2032
- Figure 30: North America Vegetable Juice Market Volume Share (%), by Category 2024 & 2032
- Figure 31: North America Vegetable Juice Market Revenue (Million), by Packaging 2024 & 2032
- Figure 32: North America Vegetable Juice Market Volume (K Liters), by Packaging 2024 & 2032
- Figure 33: North America Vegetable Juice Market Revenue Share (%), by Packaging 2024 & 2032
- Figure 34: North America Vegetable Juice Market Volume Share (%), by Packaging 2024 & 2032
- Figure 35: North America Vegetable Juice Market Revenue (Million), by Distribution 2024 & 2032
- Figure 36: North America Vegetable Juice Market Volume (K Liters), by Distribution 2024 & 2032
- Figure 37: North America Vegetable Juice Market Revenue Share (%), by Distribution 2024 & 2032
- Figure 38: North America Vegetable Juice Market Volume Share (%), by Distribution 2024 & 2032
- Figure 39: North America Vegetable Juice Market Revenue (Million), by Country 2024 & 2032
- Figure 40: North America Vegetable Juice Market Volume (K Liters), by Country 2024 & 2032
- Figure 41: North America Vegetable Juice Market Revenue Share (%), by Country 2024 & 2032
- Figure 42: North America Vegetable Juice Market Volume Share (%), by Country 2024 & 2032
- Figure 43: Europe Vegetable Juice Market Revenue (Million), by Product Type 2024 & 2032
- Figure 44: Europe Vegetable Juice Market Volume (K Liters), by Product Type 2024 & 2032
- Figure 45: Europe Vegetable Juice Market Revenue Share (%), by Product Type 2024 & 2032
- Figure 46: Europe Vegetable Juice Market Volume Share (%), by Product Type 2024 & 2032
- Figure 47: Europe Vegetable Juice Market Revenue (Million), by Category 2024 & 2032
- Figure 48: Europe Vegetable Juice Market Volume (K Liters), by Category 2024 & 2032
- Figure 49: Europe Vegetable Juice Market Revenue Share (%), by Category 2024 & 2032
- Figure 50: Europe Vegetable Juice Market Volume Share (%), by Category 2024 & 2032
- Figure 51: Europe Vegetable Juice Market Revenue (Million), by Packaging 2024 & 2032
- Figure 52: Europe Vegetable Juice Market Volume (K Liters), by Packaging 2024 & 2032
- Figure 53: Europe Vegetable Juice Market Revenue Share (%), by Packaging 2024 & 2032
- Figure 54: Europe Vegetable Juice Market Volume Share (%), by Packaging 2024 & 2032
- Figure 55: Europe Vegetable Juice Market Revenue (Million), by Distribution 2024 & 2032
- Figure 56: Europe Vegetable Juice Market Volume (K Liters), by Distribution 2024 & 2032
- Figure 57: Europe Vegetable Juice Market Revenue Share (%), by Distribution 2024 & 2032
- Figure 58: Europe Vegetable Juice Market Volume Share (%), by Distribution 2024 & 2032
- Figure 59: Europe Vegetable Juice Market Revenue (Million), by Country 2024 & 2032
- Figure 60: Europe Vegetable Juice Market Volume (K Liters), by Country 2024 & 2032
- Figure 61: Europe Vegetable Juice Market Revenue Share (%), by Country 2024 & 2032
- Figure 62: Europe Vegetable Juice Market Volume Share (%), by Country 2024 & 2032
- Figure 63: Asia Pacific Vegetable Juice Market Revenue (Million), by Product Type 2024 & 2032
- Figure 64: Asia Pacific Vegetable Juice Market Volume (K Liters), by Product Type 2024 & 2032
- Figure 65: Asia Pacific Vegetable Juice Market Revenue Share (%), by Product Type 2024 & 2032
- Figure 66: Asia Pacific Vegetable Juice Market Volume Share (%), by Product Type 2024 & 2032
- Figure 67: Asia Pacific Vegetable Juice Market Revenue (Million), by Category 2024 & 2032
- Figure 68: Asia Pacific Vegetable Juice Market Volume (K Liters), by Category 2024 & 2032
- Figure 69: Asia Pacific Vegetable Juice Market Revenue Share (%), by Category 2024 & 2032
- Figure 70: Asia Pacific Vegetable Juice Market Volume Share (%), by Category 2024 & 2032
- Figure 71: Asia Pacific Vegetable Juice Market Revenue (Million), by Packaging 2024 & 2032
- Figure 72: Asia Pacific Vegetable Juice Market Volume (K Liters), by Packaging 2024 & 2032
- Figure 73: Asia Pacific Vegetable Juice Market Revenue Share (%), by Packaging 2024 & 2032
- Figure 74: Asia Pacific Vegetable Juice Market Volume Share (%), by Packaging 2024 & 2032
- Figure 75: Asia Pacific Vegetable Juice Market Revenue (Million), by Distribution 2024 & 2032
- Figure 76: Asia Pacific Vegetable Juice Market Volume (K Liters), by Distribution 2024 & 2032
- Figure 77: Asia Pacific Vegetable Juice Market Revenue Share (%), by Distribution 2024 & 2032
- Figure 78: Asia Pacific Vegetable Juice Market Volume Share (%), by Distribution 2024 & 2032
- Figure 79: Asia Pacific Vegetable Juice Market Revenue (Million), by Country 2024 & 2032
- Figure 80: Asia Pacific Vegetable Juice Market Volume (K Liters), by Country 2024 & 2032
- Figure 81: Asia Pacific Vegetable Juice Market Revenue Share (%), by Country 2024 & 2032
- Figure 82: Asia Pacific Vegetable Juice Market Volume Share (%), by Country 2024 & 2032
- Figure 83: South America Vegetable Juice Market Revenue (Million), by Product Type 2024 & 2032
- Figure 84: South America Vegetable Juice Market Volume (K Liters), by Product Type 2024 & 2032
- Figure 85: South America Vegetable Juice Market Revenue Share (%), by Product Type 2024 & 2032
- Figure 86: South America Vegetable Juice Market Volume Share (%), by Product Type 2024 & 2032
- Figure 87: South America Vegetable Juice Market Revenue (Million), by Category 2024 & 2032
- Figure 88: South America Vegetable Juice Market Volume (K Liters), by Category 2024 & 2032
- Figure 89: South America Vegetable Juice Market Revenue Share (%), by Category 2024 & 2032
- Figure 90: South America Vegetable Juice Market Volume Share (%), by Category 2024 & 2032
- Figure 91: South America Vegetable Juice Market Revenue (Million), by Packaging 2024 & 2032
- Figure 92: South America Vegetable Juice Market Volume (K Liters), by Packaging 2024 & 2032
- Figure 93: South America Vegetable Juice Market Revenue Share (%), by Packaging 2024 & 2032
- Figure 94: South America Vegetable Juice Market Volume Share (%), by Packaging 2024 & 2032
- Figure 95: South America Vegetable Juice Market Revenue (Million), by Distribution 2024 & 2032
- Figure 96: South America Vegetable Juice Market Volume (K Liters), by Distribution 2024 & 2032
- Figure 97: South America Vegetable Juice Market Revenue Share (%), by Distribution 2024 & 2032
- Figure 98: South America Vegetable Juice Market Volume Share (%), by Distribution 2024 & 2032
- Figure 99: South America Vegetable Juice Market Revenue (Million), by Country 2024 & 2032
- Figure 100: South America Vegetable Juice Market Volume (K Liters), by Country 2024 & 2032
- Figure 101: South America Vegetable Juice Market Revenue Share (%), by Country 2024 & 2032
- Figure 102: South America Vegetable Juice Market Volume Share (%), by Country 2024 & 2032
- Figure 103: Middle East Vegetable Juice Market Revenue (Million), by Product Type 2024 & 2032
- Figure 104: Middle East Vegetable Juice Market Volume (K Liters), by Product Type 2024 & 2032
- Figure 105: Middle East Vegetable Juice Market Revenue Share (%), by Product Type 2024 & 2032
- Figure 106: Middle East Vegetable Juice Market Volume Share (%), by Product Type 2024 & 2032
- Figure 107: Middle East Vegetable Juice Market Revenue (Million), by Category 2024 & 2032
- Figure 108: Middle East Vegetable Juice Market Volume (K Liters), by Category 2024 & 2032
- Figure 109: Middle East Vegetable Juice Market Revenue Share (%), by Category 2024 & 2032
- Figure 110: Middle East Vegetable Juice Market Volume Share (%), by Category 2024 & 2032
- Figure 111: Middle East Vegetable Juice Market Revenue (Million), by Packaging 2024 & 2032
- Figure 112: Middle East Vegetable Juice Market Volume (K Liters), by Packaging 2024 & 2032
- Figure 113: Middle East Vegetable Juice Market Revenue Share (%), by Packaging 2024 & 2032
- Figure 114: Middle East Vegetable Juice Market Volume Share (%), by Packaging 2024 & 2032
- Figure 115: Middle East Vegetable Juice Market Revenue (Million), by Distribution 2024 & 2032
- Figure 116: Middle East Vegetable Juice Market Volume (K Liters), by Distribution 2024 & 2032
- Figure 117: Middle East Vegetable Juice Market Revenue Share (%), by Distribution 2024 & 2032
- Figure 118: Middle East Vegetable Juice Market Volume Share (%), by Distribution 2024 & 2032
- Figure 119: Middle East Vegetable Juice Market Revenue (Million), by Country 2024 & 2032
- Figure 120: Middle East Vegetable Juice Market Volume (K Liters), by Country 2024 & 2032
- Figure 121: Middle East Vegetable Juice Market Revenue Share (%), by Country 2024 & 2032
- Figure 122: Middle East Vegetable Juice Market Volume Share (%), by Country 2024 & 2032
- Figure 123: South Africa Vegetable Juice Market Revenue (Million), by Product Type 2024 & 2032
- Figure 124: South Africa Vegetable Juice Market Volume (K Liters), by Product Type 2024 & 2032
- Figure 125: South Africa Vegetable Juice Market Revenue Share (%), by Product Type 2024 & 2032
- Figure 126: South Africa Vegetable Juice Market Volume Share (%), by Product Type 2024 & 2032
- Figure 127: South Africa Vegetable Juice Market Revenue (Million), by Category 2024 & 2032
- Figure 128: South Africa Vegetable Juice Market Volume (K Liters), by Category 2024 & 2032
- Figure 129: South Africa Vegetable Juice Market Revenue Share (%), by Category 2024 & 2032
- Figure 130: South Africa Vegetable Juice Market Volume Share (%), by Category 2024 & 2032
- Figure 131: South Africa Vegetable Juice Market Revenue (Million), by Packaging 2024 & 2032
- Figure 132: South Africa Vegetable Juice Market Volume (K Liters), by Packaging 2024 & 2032
- Figure 133: South Africa Vegetable Juice Market Revenue Share (%), by Packaging 2024 & 2032
- Figure 134: South Africa Vegetable Juice Market Volume Share (%), by Packaging 2024 & 2032
- Figure 135: South Africa Vegetable Juice Market Revenue (Million), by Distribution 2024 & 2032
- Figure 136: South Africa Vegetable Juice Market Volume (K Liters), by Distribution 2024 & 2032
- Figure 137: South Africa Vegetable Juice Market Revenue Share (%), by Distribution 2024 & 2032
- Figure 138: South Africa Vegetable Juice Market Volume Share (%), by Distribution 2024 & 2032
- Figure 139: South Africa Vegetable Juice Market Revenue (Million), by Country 2024 & 2032
- Figure 140: South Africa Vegetable Juice Market Volume (K Liters), by Country 2024 & 2032
- Figure 141: South Africa Vegetable Juice Market Revenue Share (%), by Country 2024 & 2032
- Figure 142: South Africa Vegetable Juice Market Volume Share (%), by Country 2024 & 2032
List of Tables
- Table 1: Global Vegetable Juice Market Revenue Million Forecast, by Region 2019 & 2032
- Table 2: Global Vegetable Juice Market Volume K Liters Forecast, by Region 2019 & 2032
- Table 3: Global Vegetable Juice Market Revenue Million Forecast, by Product Type 2019 & 2032
- Table 4: Global Vegetable Juice Market Volume K Liters Forecast, by Product Type 2019 & 2032
- Table 5: Global Vegetable Juice Market Revenue Million Forecast, by Category 2019 & 2032
- Table 6: Global Vegetable Juice Market Volume K Liters Forecast, by Category 2019 & 2032
- Table 7: Global Vegetable Juice Market Revenue Million Forecast, by Packaging 2019 & 2032
- Table 8: Global Vegetable Juice Market Volume K Liters Forecast, by Packaging 2019 & 2032
- Table 9: Global Vegetable Juice Market Revenue Million Forecast, by Distribution 2019 & 2032
- Table 10: Global Vegetable Juice Market Volume K Liters Forecast, by Distribution 2019 & 2032
- Table 11: Global Vegetable Juice Market Revenue Million Forecast, by Region 2019 & 2032
- Table 12: Global Vegetable Juice Market Volume K Liters Forecast, by Region 2019 & 2032
- Table 13: Global Vegetable Juice Market Revenue Million Forecast, by Country 2019 & 2032
- Table 14: Global Vegetable Juice Market Volume K Liters Forecast, by Country 2019 & 2032
- Table 15: United States Vegetable Juice Market Revenue (Million) Forecast, by Application 2019 & 2032
- Table 16: United States Vegetable Juice Market Volume (K Liters) Forecast, by Application 2019 & 2032
- Table 17: Canada Vegetable Juice Market Revenue (Million) Forecast, by Application 2019 & 2032
- Table 18: Canada Vegetable Juice Market Volume (K Liters) Forecast, by Application 2019 & 2032
- Table 19: Mexico Vegetable Juice Market Revenue (Million) Forecast, by Application 2019 & 2032
- Table 20: Mexico Vegetable Juice Market Volume (K Liters) Forecast, by Application 2019 & 2032
- Table 21: Rest of North America Vegetable Juice Market Revenue (Million) Forecast, by Application 2019 & 2032
- Table 22: Rest of North America Vegetable Juice Market Volume (K Liters) Forecast, by Application 2019 & 2032
- Table 23: Global Vegetable Juice Market Revenue Million Forecast, by Country 2019 & 2032
- Table 24: Global Vegetable Juice Market Volume K Liters Forecast, by Country 2019 & 2032
- Table 25: United Kingdom Vegetable Juice Market Revenue (Million) Forecast, by Application 2019 & 2032
- Table 26: United Kingdom Vegetable Juice Market Volume (K Liters) Forecast, by Application 2019 & 2032
- Table 27: Germany Vegetable Juice Market Revenue (Million) Forecast, by Application 2019 & 2032
- Table 28: Germany Vegetable Juice Market Volume (K Liters) Forecast, by Application 2019 & 2032
- Table 29: Italy Vegetable Juice Market Revenue (Million) Forecast, by Application 2019 & 2032
- Table 30: Italy Vegetable Juice Market Volume (K Liters) Forecast, by Application 2019 & 2032
- Table 31: France Vegetable Juice Market Revenue (Million) Forecast, by Application 2019 & 2032
- Table 32: France Vegetable Juice Market Volume (K Liters) Forecast, by Application 2019 & 2032
- Table 33: Spain Vegetable Juice Market Revenue (Million) Forecast, by Application 2019 & 2032
- Table 34: Spain Vegetable Juice Market Volume (K Liters) Forecast, by Application 2019 & 2032
- Table 35: Russia Vegetable Juice Market Revenue (Million) Forecast, by Application 2019 & 2032
- Table 36: Russia Vegetable Juice Market Volume (K Liters) Forecast, by Application 2019 & 2032
- Table 37: Rest of Europe Vegetable Juice Market Revenue (Million) Forecast, by Application 2019 & 2032
- Table 38: Rest of Europe Vegetable Juice Market Volume (K Liters) Forecast, by Application 2019 & 2032
- Table 39: Global Vegetable Juice Market Revenue Million Forecast, by Country 2019 & 2032
- Table 40: Global Vegetable Juice Market Volume K Liters Forecast, by Country 2019 & 2032
- Table 41: India Vegetable Juice Market Revenue (Million) Forecast, by Application 2019 & 2032
- Table 42: India Vegetable Juice Market Volume (K Liters) Forecast, by Application 2019 & 2032
- Table 43: China Vegetable Juice Market Revenue (Million) Forecast, by Application 2019 & 2032
- Table 44: China Vegetable Juice Market Volume (K Liters) Forecast, by Application 2019 & 2032
- Table 45: Japan Vegetable Juice Market Revenue (Million) Forecast, by Application 2019 & 2032
- Table 46: Japan Vegetable Juice Market Volume (K Liters) Forecast, by Application 2019 & 2032
- Table 47: Australia Vegetable Juice Market Revenue (Million) Forecast, by Application 2019 & 2032
- Table 48: Australia Vegetable Juice Market Volume (K Liters) Forecast, by Application 2019 & 2032
- Table 49: Rest of Asia Pacific Vegetable Juice Market Revenue (Million) Forecast, by Application 2019 & 2032
- Table 50: Rest of Asia Pacific Vegetable Juice Market Volume (K Liters) Forecast, by Application 2019 & 2032
- Table 51: Global Vegetable Juice Market Revenue Million Forecast, by Country 2019 & 2032
- Table 52: Global Vegetable Juice Market Volume K Liters Forecast, by Country 2019 & 2032
- Table 53: Brazil Vegetable Juice Market Revenue (Million) Forecast, by Application 2019 & 2032
- Table 54: Brazil Vegetable Juice Market Volume (K Liters) Forecast, by Application 2019 & 2032
- Table 55: Argentina Vegetable Juice Market Revenue (Million) Forecast, by Application 2019 & 2032
- Table 56: Argentina Vegetable Juice Market Volume (K Liters) Forecast, by Application 2019 & 2032
- Table 57: Rest of South America Vegetable Juice Market Revenue (Million) Forecast, by Application 2019 & 2032
- Table 58: Rest of South America Vegetable Juice Market Volume (K Liters) Forecast, by Application 2019 & 2032
- Table 59: Global Vegetable Juice Market Revenue Million Forecast, by Country 2019 & 2032
- Table 60: Global Vegetable Juice Market Volume K Liters Forecast, by Country 2019 & 2032
- Table 61: UAE Vegetable Juice Market Revenue (Million) Forecast, by Application 2019 & 2032
- Table 62: UAE Vegetable Juice Market Volume (K Liters) Forecast, by Application 2019 & 2032
- Table 63: South Africa Vegetable Juice Market Revenue (Million) Forecast, by Application 2019 & 2032
- Table 64: South Africa Vegetable Juice Market Volume (K Liters) Forecast, by Application 2019 & 2032
- Table 65: Saudi Arabia Vegetable Juice Market Revenue (Million) Forecast, by Application 2019 & 2032
- Table 66: Saudi Arabia Vegetable Juice Market Volume (K Liters) Forecast, by Application 2019 & 2032
- Table 67: Rest of MEA Vegetable Juice Market Revenue (Million) Forecast, by Application 2019 & 2032
- Table 68: Rest of MEA Vegetable Juice Market Volume (K Liters) Forecast, by Application 2019 & 2032
- Table 69: Global Vegetable Juice Market Revenue Million Forecast, by Product Type 2019 & 2032
- Table 70: Global Vegetable Juice Market Volume K Liters Forecast, by Product Type 2019 & 2032
- Table 71: Global Vegetable Juice Market Revenue Million Forecast, by Category 2019 & 2032
- Table 72: Global Vegetable Juice Market Volume K Liters Forecast, by Category 2019 & 2032
- Table 73: Global Vegetable Juice Market Revenue Million Forecast, by Packaging 2019 & 2032
- Table 74: Global Vegetable Juice Market Volume K Liters Forecast, by Packaging 2019 & 2032
- Table 75: Global Vegetable Juice Market Revenue Million Forecast, by Distribution 2019 & 2032
- Table 76: Global Vegetable Juice Market Volume K Liters Forecast, by Distribution 2019 & 2032
- Table 77: Global Vegetable Juice Market Revenue Million Forecast, by Country 2019 & 2032
- Table 78: Global Vegetable Juice Market Volume K Liters Forecast, by Country 2019 & 2032
- Table 79: United States Vegetable Juice Market Revenue (Million) Forecast, by Application 2019 & 2032
- Table 80: United States Vegetable Juice Market Volume (K Liters) Forecast, by Application 2019 & 2032
- Table 81: Canada Vegetable Juice Market Revenue (Million) Forecast, by Application 2019 & 2032
- Table 82: Canada Vegetable Juice Market Volume (K Liters) Forecast, by Application 2019 & 2032
- Table 83: Mexico Vegetable Juice Market Revenue (Million) Forecast, by Application 2019 & 2032
- Table 84: Mexico Vegetable Juice Market Volume (K Liters) Forecast, by Application 2019 & 2032
- Table 85: Rest of North America Vegetable Juice Market Revenue (Million) Forecast, by Application 2019 & 2032
- Table 86: Rest of North America Vegetable Juice Market Volume (K Liters) Forecast, by Application 2019 & 2032
- Table 87: Global Vegetable Juice Market Revenue Million Forecast, by Product Type 2019 & 2032
- Table 88: Global Vegetable Juice Market Volume K Liters Forecast, by Product Type 2019 & 2032
- Table 89: Global Vegetable Juice Market Revenue Million Forecast, by Category 2019 & 2032
- Table 90: Global Vegetable Juice Market Volume K Liters Forecast, by Category 2019 & 2032
- Table 91: Global Vegetable Juice Market Revenue Million Forecast, by Packaging 2019 & 2032
- Table 92: Global Vegetable Juice Market Volume K Liters Forecast, by Packaging 2019 & 2032
- Table 93: Global Vegetable Juice Market Revenue Million Forecast, by Distribution 2019 & 2032
- Table 94: Global Vegetable Juice Market Volume K Liters Forecast, by Distribution 2019 & 2032
- Table 95: Global Vegetable Juice Market Revenue Million Forecast, by Country 2019 & 2032
- Table 96: Global Vegetable Juice Market Volume K Liters Forecast, by Country 2019 & 2032
- Table 97: United Kingdom Vegetable Juice Market Revenue (Million) Forecast, by Application 2019 & 2032
- Table 98: United Kingdom Vegetable Juice Market Volume (K Liters) Forecast, by Application 2019 & 2032
- Table 99: Germany Vegetable Juice Market Revenue (Million) Forecast, by Application 2019 & 2032
- Table 100: Germany Vegetable Juice Market Volume (K Liters) Forecast, by Application 2019 & 2032
- Table 101: Italy Vegetable Juice Market Revenue (Million) Forecast, by Application 2019 & 2032
- Table 102: Italy Vegetable Juice Market Volume (K Liters) Forecast, by Application 2019 & 2032
- Table 103: France Vegetable Juice Market Revenue (Million) Forecast, by Application 2019 & 2032
- Table 104: France Vegetable Juice Market Volume (K Liters) Forecast, by Application 2019 & 2032
- Table 105: Spain Vegetable Juice Market Revenue (Million) Forecast, by Application 2019 & 2032
- Table 106: Spain Vegetable Juice Market Volume (K Liters) Forecast, by Application 2019 & 2032
- Table 107: Russia Vegetable Juice Market Revenue (Million) Forecast, by Application 2019 & 2032
- Table 108: Russia Vegetable Juice Market Volume (K Liters) Forecast, by Application 2019 & 2032
- Table 109: Rest of Europe Vegetable Juice Market Revenue (Million) Forecast, by Application 2019 & 2032
- Table 110: Rest of Europe Vegetable Juice Market Volume (K Liters) Forecast, by Application 2019 & 2032
- Table 111: Global Vegetable Juice Market Revenue Million Forecast, by Product Type 2019 & 2032
- Table 112: Global Vegetable Juice Market Volume K Liters Forecast, by Product Type 2019 & 2032
- Table 113: Global Vegetable Juice Market Revenue Million Forecast, by Category 2019 & 2032
- Table 114: Global Vegetable Juice Market Volume K Liters Forecast, by Category 2019 & 2032
- Table 115: Global Vegetable Juice Market Revenue Million Forecast, by Packaging 2019 & 2032
- Table 116: Global Vegetable Juice Market Volume K Liters Forecast, by Packaging 2019 & 2032
- Table 117: Global Vegetable Juice Market Revenue Million Forecast, by Distribution 2019 & 2032
- Table 118: Global Vegetable Juice Market Volume K Liters Forecast, by Distribution 2019 & 2032
- Table 119: Global Vegetable Juice Market Revenue Million Forecast, by Country 2019 & 2032
- Table 120: Global Vegetable Juice Market Volume K Liters Forecast, by Country 2019 & 2032
- Table 121: India Vegetable Juice Market Revenue (Million) Forecast, by Application 2019 & 2032
- Table 122: India Vegetable Juice Market Volume (K Liters) Forecast, by Application 2019 & 2032
- Table 123: China Vegetable Juice Market Revenue (Million) Forecast, by Application 2019 & 2032
- Table 124: China Vegetable Juice Market Volume (K Liters) Forecast, by Application 2019 & 2032
- Table 125: Japan Vegetable Juice Market Revenue (Million) Forecast, by Application 2019 & 2032
- Table 126: Japan Vegetable Juice Market Volume (K Liters) Forecast, by Application 2019 & 2032
- Table 127: Australia Vegetable Juice Market Revenue (Million) Forecast, by Application 2019 & 2032
- Table 128: Australia Vegetable Juice Market Volume (K Liters) Forecast, by Application 2019 & 2032
- Table 129: Rest of Asia Pacific Vegetable Juice Market Revenue (Million) Forecast, by Application 2019 & 2032
- Table 130: Rest of Asia Pacific Vegetable Juice Market Volume (K Liters) Forecast, by Application 2019 & 2032
- Table 131: Global Vegetable Juice Market Revenue Million Forecast, by Product Type 2019 & 2032
- Table 132: Global Vegetable Juice Market Volume K Liters Forecast, by Product Type 2019 & 2032
- Table 133: Global Vegetable Juice Market Revenue Million Forecast, by Category 2019 & 2032
- Table 134: Global Vegetable Juice Market Volume K Liters Forecast, by Category 2019 & 2032
- Table 135: Global Vegetable Juice Market Revenue Million Forecast, by Packaging 2019 & 2032
- Table 136: Global Vegetable Juice Market Volume K Liters Forecast, by Packaging 2019 & 2032
- Table 137: Global Vegetable Juice Market Revenue Million Forecast, by Distribution 2019 & 2032
- Table 138: Global Vegetable Juice Market Volume K Liters Forecast, by Distribution 2019 & 2032
- Table 139: Global Vegetable Juice Market Revenue Million Forecast, by Country 2019 & 2032
- Table 140: Global Vegetable Juice Market Volume K Liters Forecast, by Country 2019 & 2032
- Table 141: Brazil Vegetable Juice Market Revenue (Million) Forecast, by Application 2019 & 2032
- Table 142: Brazil Vegetable Juice Market Volume (K Liters) Forecast, by Application 2019 & 2032
- Table 143: Argentina Vegetable Juice Market Revenue (Million) Forecast, by Application 2019 & 2032
- Table 144: Argentina Vegetable Juice Market Volume (K Liters) Forecast, by Application 2019 & 2032
- Table 145: Rest of South America Vegetable Juice Market Revenue (Million) Forecast, by Application 2019 & 2032
- Table 146: Rest of South America Vegetable Juice Market Volume (K Liters) Forecast, by Application 2019 & 2032
- Table 147: Global Vegetable Juice Market Revenue Million Forecast, by Product Type 2019 & 2032
- Table 148: Global Vegetable Juice Market Volume K Liters Forecast, by Product Type 2019 & 2032
- Table 149: Global Vegetable Juice Market Revenue Million Forecast, by Category 2019 & 2032
- Table 150: Global Vegetable Juice Market Volume K Liters Forecast, by Category 2019 & 2032
- Table 151: Global Vegetable Juice Market Revenue Million Forecast, by Packaging 2019 & 2032
- Table 152: Global Vegetable Juice Market Volume K Liters Forecast, by Packaging 2019 & 2032
- Table 153: Global Vegetable Juice Market Revenue Million Forecast, by Distribution 2019 & 2032
- Table 154: Global Vegetable Juice Market Volume K Liters Forecast, by Distribution 2019 & 2032
- Table 155: Global Vegetable Juice Market Revenue Million Forecast, by Country 2019 & 2032
- Table 156: Global Vegetable Juice Market Volume K Liters Forecast, by Country 2019 & 2032
- Table 157: Global Vegetable Juice Market Revenue Million Forecast, by Product Type 2019 & 2032
- Table 158: Global Vegetable Juice Market Volume K Liters Forecast, by Product Type 2019 & 2032
- Table 159: Global Vegetable Juice Market Revenue Million Forecast, by Category 2019 & 2032
- Table 160: Global Vegetable Juice Market Volume K Liters Forecast, by Category 2019 & 2032
- Table 161: Global Vegetable Juice Market Revenue Million Forecast, by Packaging 2019 & 2032
- Table 162: Global Vegetable Juice Market Volume K Liters Forecast, by Packaging 2019 & 2032
- Table 163: Global Vegetable Juice Market Revenue Million Forecast, by Distribution 2019 & 2032
- Table 164: Global Vegetable Juice Market Volume K Liters Forecast, by Distribution 2019 & 2032
- Table 165: Global Vegetable Juice Market Revenue Million Forecast, by Country 2019 & 2032
- Table 166: Global Vegetable Juice Market Volume K Liters Forecast, by Country 2019 & 2032
- Table 167: Saudi Arabia Vegetable Juice Market Revenue (Million) Forecast, by Application 2019 & 2032
- Table 168: Saudi Arabia Vegetable Juice Market Volume (K Liters) Forecast, by Application 2019 & 2032
- Table 169: Rest of Middle East Vegetable Juice Market Revenue (Million) Forecast, by Application 2019 & 2032
- Table 170: Rest of Middle East Vegetable Juice Market Volume (K Liters) Forecast, by Application 2019 & 2032
Frequently Asked Questions
1. What is the projected Compound Annual Growth Rate (CAGR) of the Vegetable Juice Market?
The projected CAGR is approximately 7.30%.
2. Which companies are prominent players in the Vegetable Juice Market?
Key companies in the market include Raw Pressery, Florida Bottling Inc, Thurella AG, The Hain Celestial Group Inc, The Coca-Cola Company, Campbell Soup Company, Pressed Juicery Inc *List Not Exhaustive, Hoogesteger, AllWellO, Naked Juice Company (PepsiCo Inc ).
3. What are the main segments of the Vegetable Juice Market?
The market segments include Product Type, Category, Packaging, Distribution.
4. Can you provide details about the market size?
The market size is estimated to be USD XX Million as of 2022.
5. What are some drivers contributing to market growth?
Growing Demand for Convenience and Processed Foods Drives Demand; Expanding Cosmetic and Personal Care Industries Utilize Gelatin for Various Purposes.
6. What are the notable trends driving market growth?
Rising Inclination Towards Cold-Pressed Vegetable Juice.
7. Are there any restraints impacting market growth?
Fluctuations in Raw Material Proces Affecting Production Costs.
8. Can you provide examples of recent developments in the market?
In March 2021, Naked Juice, a brand of PepsiCo, declared they have inaugurated a rainbow machine, which is a nutrient-dense juice made from mangoes, bananas, kiwis, blueberries, and blackberries.
9. What pricing options are available for accessing the report?
Pricing options include single-user, multi-user, and enterprise licenses priced at USD 4750, USD 5250, and USD 8750 respectively.
10. Is the market size provided in terms of value or volume?
The market size is provided in terms of value, measured in Million and volume, measured in K Liters.
11. Are there any specific market keywords associated with the report?
Yes, the market keyword associated with the report is "Vegetable Juice Market," which aids in identifying and referencing the specific market segment covered.
12. How do I determine which pricing option suits my needs best?
The pricing options vary based on user requirements and access needs. Individual users may opt for single-user licenses, while businesses requiring broader access may choose multi-user or enterprise licenses for cost-effective access to the report.
13. Are there any additional resources or data provided in the Vegetable Juice Market report?
While the report offers comprehensive insights, it's advisable to review the specific contents or supplementary materials provided to ascertain if additional resources or data are available.
14. How can I stay updated on further developments or reports in the Vegetable Juice Market?
To stay informed about further developments, trends, and reports in the Vegetable Juice Market, consider subscribing to industry newsletters, following relevant companies and organizations, or regularly checking reputable industry news sources and publications.
Methodology
Step 1 - Identification of Relevant Samples Size from Population Database


Step 2 - Approaches for Defining Global Market Size (Value, Volume* & Price*)

Note*: In applicable scenarios
Step 3 - Data Sources
Primary Research
- Web Analytics
- Survey Reports
- Research Institute
- Latest Research Reports
- Opinion Leaders
Secondary Research
- Annual Reports
- White Paper
- Latest Press Release
- Industry Association
- Paid Database
- Investor Presentations

Step 4 - Data Triangulation
Involves using different sources of information in order to increase the validity of a study
These sources are likely to be stakeholders in a program - participants, other researchers, program staff, other community members, and so on.
Then we put all data in single framework & apply various statistical tools to find out the dynamic on the market.
During the analysis stage, feedback from the stakeholder groups would be compared to determine areas of agreement as well as areas of divergence


