
Key Insights
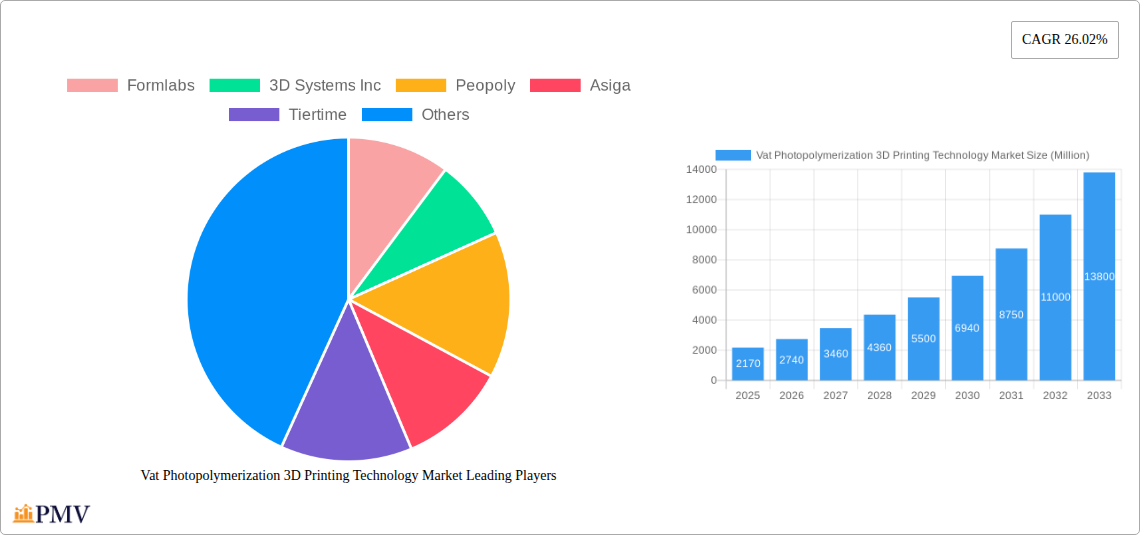
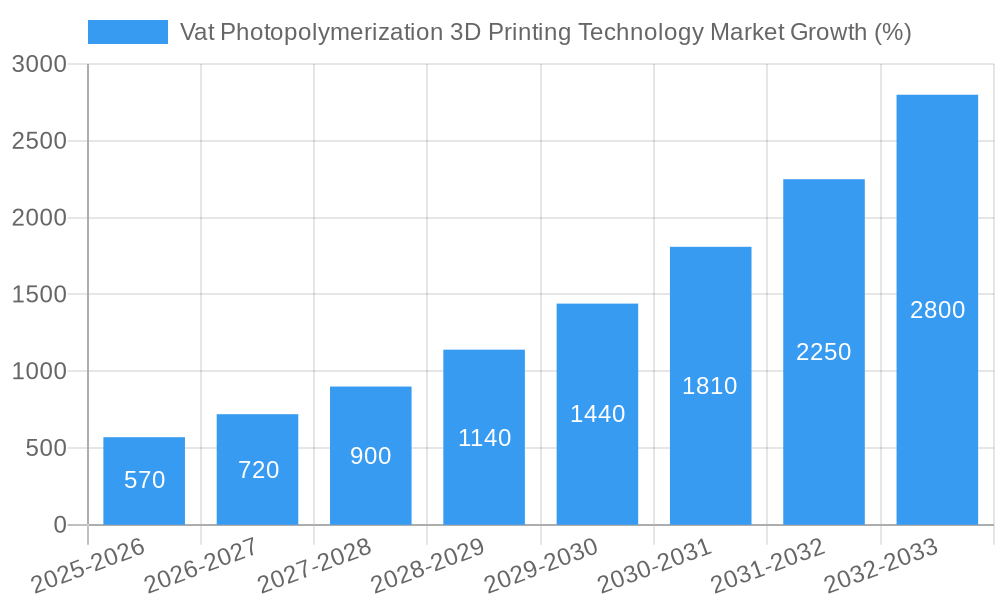
The Vat Photopolymerization 3D Printing Technology market is experiencing robust growth, projected to reach $2.17 billion in 2025 and maintain a significant Compound Annual Growth Rate (CAGR) of 26.02% from 2025 to 2033. This expansion is driven by several key factors. Increasing demand for high-precision prototypes and end-use parts across diverse industries like healthcare (dental models, surgical guides), jewelry, and consumer goods fuels market expansion. Advancements in resin technology, offering improved material properties like biocompatibility and strength, are further boosting adoption. The emergence of more affordable and user-friendly printers is democratizing access to this technology, attracting both established businesses and individual creators. Furthermore, the growing need for rapid prototyping and customized manufacturing solutions is propelling the market forward. Competition among key players like Formlabs, 3D Systems, Peopoly, and others is fostering innovation and driving down prices, making this technology increasingly accessible.
Despite the positive trajectory, market growth faces certain challenges. The relatively high initial investment in printers and materials could hinder wider adoption, particularly for smaller businesses or individual users. The complexity of some post-processing steps and the need for specialized skills can also present barriers. However, ongoing technological advancements, along with the development of more streamlined workflows and user-friendly software, are mitigating these challenges. The market's continued expansion is anticipated, driven by ongoing technological innovation and increasing application across diverse industries. The consistent demand for high-resolution, detailed 3D prints continues to solidify the long-term outlook for vat photopolymerization 3D printing.
Vat Photopolymerization 3D Printing Technology Market: A Comprehensive Report (2019-2033)
This comprehensive report provides an in-depth analysis of the Vat Photopolymerization 3D Printing Technology market, encompassing market size, segmentation, competitive landscape, growth drivers, challenges, and future outlook. The study period covers 2019-2033, with 2025 as the base year and forecast period extending to 2033. The historical period analyzed is 2019-2024. The report leverages extensive primary and secondary research to deliver actionable insights for stakeholders across the value chain. Expected market value in 2025 is estimated at XX Million.
Vat Photopolymerization 3D Printing Technology Market Market Structure & Competitive Dynamics
The Vat Photopolymerization 3D printing market exhibits a moderately concentrated structure, with several key players vying for market share. The competitive landscape is characterized by intense innovation, focusing on improved resin formulations, faster printing speeds, and enhanced print quality. Regulatory frameworks, while generally supportive of 3D printing advancements, vary across regions, influencing market access and adoption rates. Product substitutes, such as other additive manufacturing technologies (e.g., FDM, SLS), present competitive pressures. However, the unique capabilities of Vat Photopolymerization, such as high resolution and detail, maintain its strong market position. End-user trends indicate increasing demand across diverse sectors, including healthcare, jewelry, and prototyping.
- Market Concentration: The top five players hold an estimated xx% market share in 2025.
- Innovation Ecosystems: Significant R&D investments by major players and startups drive continuous product improvements.
- Regulatory Frameworks: Varied regional regulations impacting material safety and medical device approvals.
- Product Substitutes: Competition from FDM, SLS, and other 3D printing technologies.
- End-User Trends: Growing adoption in healthcare, dental, jewelry, and industrial prototyping.
- M&A Activities: The past five years have seen xx M&A deals, totaling approximately XX Million in value, reflecting consolidation within the sector.
Vat Photopolymerization 3D Printing Technology Market Industry Trends & Insights
The Vat Photopolymerization 3D printing market is experiencing robust growth, driven by factors such as the increasing adoption of additive manufacturing across industries, technological advancements resulting in improved print quality and speed, and the rising demand for customized products. The market is expected to achieve a CAGR of xx% during the forecast period (2025-2033). This growth is further fueled by decreasing equipment costs and the growing availability of high-quality resins. However, challenges such as the relatively high cost of entry, the need for specialized skills, and the potential environmental impact of resin use are moderating factors. Market penetration is steadily increasing, particularly in sectors such as healthcare and prototyping, with a projected xx% penetration rate by 2033. Competitive dynamics are shaping market evolution, with companies focusing on differentiated offerings, strategic partnerships, and geographic expansion.
Dominant Markets & Segments in Vat Photopolymerization 3D Printing Technology Market
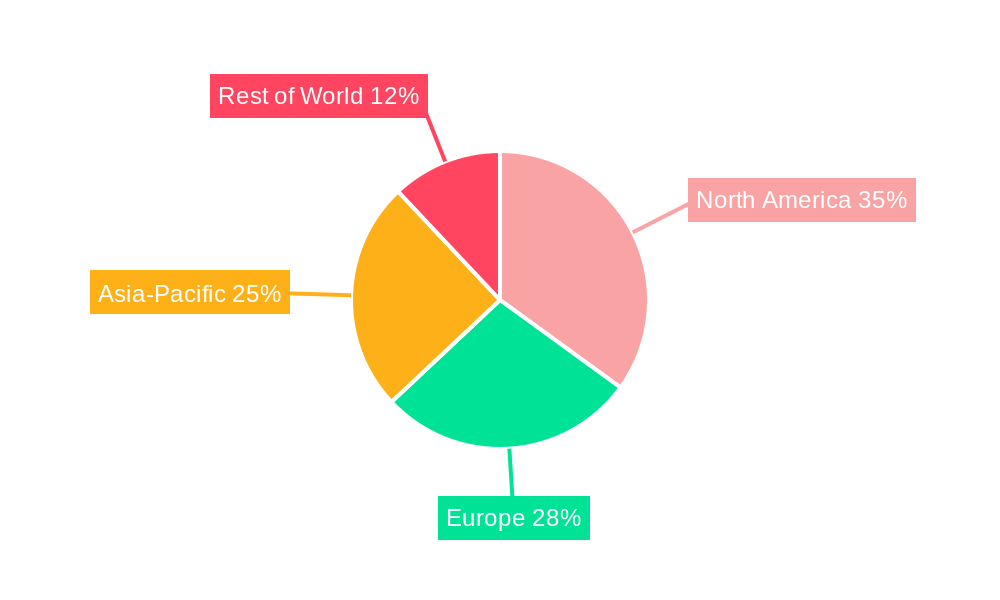
North America currently holds the largest market share in Vat Photopolymerization 3D printing, driven by significant investments in R&D, a strong manufacturing base, and high adoption rates across various industries.
- Key Drivers in North America:
- Strong presence of major players and established supply chains.
- High technological maturity and adoption rates in key sectors like healthcare.
- Favorable government policies and funding initiatives.
- Robust infrastructure for logistics and distribution.
Europe follows as a significant market, with growth driven by increasing investments in advanced manufacturing and the growing demand for personalized products. The Asia-Pacific region shows strong potential for future growth, driven by increasing industrialization and rising disposable income. Within segments, the dental and medical device applications currently dominate, owing to the high precision and detail achievable with Vat Photopolymerization. The rapid expansion of 3D-printed prosthetics and dental models significantly contributes to market growth.
Vat Photopolymerization 3D Printing Technology Market Product Innovations
Recent innovations focus on enhancing print speed, resolution, and material versatility. New resin formulations offer improved mechanical properties and biocompatibility, expanding applications in healthcare and other demanding fields. The development of automated post-processing solutions is streamlining workflows and reducing production time, increasing the efficiency of the technology. Integration with software solutions for design and workflow management is also improving usability and accessibility. These innovations are expanding the market reach and strengthening the competitive advantages of leading players.
Report Segmentation & Scope
The report segments the Vat Photopolymerization 3D printing market by technology (SLA, DLP), resin type (rigid, flexible, biocompatible), application (dental, medical, jewelry, prototyping, others), and region (North America, Europe, Asia Pacific, Rest of the World). Each segment's growth trajectory, market size, and competitive dynamics are analyzed in detail. Growth projections vary across segments, with the medical and dental applications expected to witness the fastest growth rates. Competitive intensity differs across segments, with some exhibiting higher concentration than others.
Key Drivers of Vat Photopolymerization 3D Printing Technology Market Growth
Technological advancements, particularly in resin formulations and printing speed, are key drivers of market growth. Decreasing equipment costs and increased accessibility are also significant factors. The rising demand for personalized products in healthcare, jewelry, and other sectors boosts market adoption. Government initiatives and funding for additive manufacturing further accelerate market expansion.
Challenges in the Vat Photopolymerization 3D Printing Technology Market Sector
High initial investment costs and the need for specialized skills pose entry barriers. The relatively high cost of resins and the need for efficient post-processing contribute to overall production expenses. Concerns regarding the environmental impact of resin disposal and the potential for health risks associated with certain resins present challenges to wider adoption. Competitive pressures from other 3D printing technologies also influence market dynamics. These factors combined are estimated to impact market growth by approximately xx% by 2033.
Leading Players in the Vat Photopolymerization 3D Printing Technology Market Market
- Formlabs
- 3D Systems Inc
- Peopoly
- Asiga
- Tiertime
- Tasly Holding Group
- UnionTech
- Zortrax
- Rayshape
Key Developments in Vat Photopolymerization 3D Printing Technology Market Sector
- March 2024: Sprybuild launched an SLA 3D printer with a patented continuous build process, expanding applications in dental, orthopedic, and hearing aid production. This is expected to significantly impact the market share of companies offering traditional SLA printers.
- February 2024: SHINING 3D launched AccuFab-CEL, a dental 3D printer, at LabDay 2024, indicating a growing focus on specialized applications within the dental sector. This launch is expected to boost market competition in the dental 3D printing niche.
Strategic Vat Photopolymerization 3D Printing Technology Market Market Outlook
The Vat Photopolymerization 3D printing market holds significant future potential, driven by continuous technological innovation, expanding applications, and increasing demand for personalized products. Strategic opportunities lie in developing high-performance resins, improving printing speed and resolution, and streamlining post-processing workflows. Partnerships and collaborations across the value chain will be crucial for enhancing market reach and capturing significant market share. Focusing on sustainable and environmentally friendly solutions will also become increasingly important.
Vat Photopolymerization 3D Printing Technology Market Segmentation
-
1. Component
- 1.1. Hardware
- 1.2. Software
- 1.3. Services
- 1.4. Materials
-
2. Technology
- 2.1. Stereolithography (SLA)
- 2.2. Digital Light Processing (DLP)
- 2.3. Continuous Digital Light Processing (CDLP)
-
3. Application
- 3.1. Dentistry
- 3.2. Orthopedics
- 3.3. Tissue Engineering
- 3.4. Other Ap
Vat Photopolymerization 3D Printing Technology Market Segmentation By Geography
-
1. North America
- 1.1. United States
- 1.2. Canada
- 1.3. Mexico
-
2. Europe
- 2.1. Germany
- 2.2. United Kingdom
- 2.3. France
- 2.4. Italy
- 2.5. Spain
- 2.6. Rest of Europe
-
3. Asia Pacific
- 3.1. China
- 3.2. Japan
- 3.3. India
- 3.4. Australia
- 3.5. South Korea
- 3.6. Rest of Asia Pacific
-
4. Middle East and Africa
- 4.1. GCC
- 4.2. South Africa
- 4.3. Rest of Middle East and Africa
-
5. South America
- 5.1. Brazil
- 5.2. Argentina
- 5.3. Rest of South America
Vat Photopolymerization 3D Printing Technology Market REPORT HIGHLIGHTS
| Aspects | Details |
|---|---|
| Study Period | 2019-2033 |
| Base Year | 2024 |
| Estimated Year | 2025 |
| Forecast Period | 2025-2033 |
| Historical Period | 2019-2024 |
| Growth Rate | CAGR of 26.02% from 2019-2033 |
| Segmentation |
|
Table of Contents
- 1. Introduction
- 1.1. Research Scope
- 1.2. Market Segmentation
- 1.3. Research Methodology
- 1.4. Definitions and Assumptions
- 2. Executive Summary
- 2.1. Introduction
- 3. Market Dynamics
- 3.1. Introduction
- 3.2. Market Drivers
- 3.2.1. Rising Demand for Minimally Invasive Procedures; Growing Technological Advancements
- 3.3. Market Restrains
- 3.3.1. Rising Demand for Minimally Invasive Procedures; Growing Technological Advancements
- 3.4. Market Trends
- 3.4.1. Orthopedics Segment Expected to Hold a Significant Market Share Over the Forecast Period
- 4. Market Factor Analysis
- 4.1. Porters Five Forces
- 4.2. Supply/Value Chain
- 4.3. PESTEL analysis
- 4.4. Market Entropy
- 4.5. Patent/Trademark Analysis
- 5. Global Vat Photopolymerization 3D Printing Technology Market Analysis, Insights and Forecast, 2019-2031
- 5.1. Market Analysis, Insights and Forecast - by Component
- 5.1.1. Hardware
- 5.1.2. Software
- 5.1.3. Services
- 5.1.4. Materials
- 5.2. Market Analysis, Insights and Forecast - by Technology
- 5.2.1. Stereolithography (SLA)
- 5.2.2. Digital Light Processing (DLP)
- 5.2.3. Continuous Digital Light Processing (CDLP)
- 5.3. Market Analysis, Insights and Forecast - by Application
- 5.3.1. Dentistry
- 5.3.2. Orthopedics
- 5.3.3. Tissue Engineering
- 5.3.4. Other Ap
- 5.4. Market Analysis, Insights and Forecast - by Region
- 5.4.1. North America
- 5.4.2. Europe
- 5.4.3. Asia Pacific
- 5.4.4. Middle East and Africa
- 5.4.5. South America
- 5.1. Market Analysis, Insights and Forecast - by Component
- 6. North America Vat Photopolymerization 3D Printing Technology Market Analysis, Insights and Forecast, 2019-2031
- 6.1. Market Analysis, Insights and Forecast - by Component
- 6.1.1. Hardware
- 6.1.2. Software
- 6.1.3. Services
- 6.1.4. Materials
- 6.2. Market Analysis, Insights and Forecast - by Technology
- 6.2.1. Stereolithography (SLA)
- 6.2.2. Digital Light Processing (DLP)
- 6.2.3. Continuous Digital Light Processing (CDLP)
- 6.3. Market Analysis, Insights and Forecast - by Application
- 6.3.1. Dentistry
- 6.3.2. Orthopedics
- 6.3.3. Tissue Engineering
- 6.3.4. Other Ap
- 6.1. Market Analysis, Insights and Forecast - by Component
- 7. Europe Vat Photopolymerization 3D Printing Technology Market Analysis, Insights and Forecast, 2019-2031
- 7.1. Market Analysis, Insights and Forecast - by Component
- 7.1.1. Hardware
- 7.1.2. Software
- 7.1.3. Services
- 7.1.4. Materials
- 7.2. Market Analysis, Insights and Forecast - by Technology
- 7.2.1. Stereolithography (SLA)
- 7.2.2. Digital Light Processing (DLP)
- 7.2.3. Continuous Digital Light Processing (CDLP)
- 7.3. Market Analysis, Insights and Forecast - by Application
- 7.3.1. Dentistry
- 7.3.2. Orthopedics
- 7.3.3. Tissue Engineering
- 7.3.4. Other Ap
- 7.1. Market Analysis, Insights and Forecast - by Component
- 8. Asia Pacific Vat Photopolymerization 3D Printing Technology Market Analysis, Insights and Forecast, 2019-2031
- 8.1. Market Analysis, Insights and Forecast - by Component
- 8.1.1. Hardware
- 8.1.2. Software
- 8.1.3. Services
- 8.1.4. Materials
- 8.2. Market Analysis, Insights and Forecast - by Technology
- 8.2.1. Stereolithography (SLA)
- 8.2.2. Digital Light Processing (DLP)
- 8.2.3. Continuous Digital Light Processing (CDLP)
- 8.3. Market Analysis, Insights and Forecast - by Application
- 8.3.1. Dentistry
- 8.3.2. Orthopedics
- 8.3.3. Tissue Engineering
- 8.3.4. Other Ap
- 8.1. Market Analysis, Insights and Forecast - by Component
- 9. Middle East and Africa Vat Photopolymerization 3D Printing Technology Market Analysis, Insights and Forecast, 2019-2031
- 9.1. Market Analysis, Insights and Forecast - by Component
- 9.1.1. Hardware
- 9.1.2. Software
- 9.1.3. Services
- 9.1.4. Materials
- 9.2. Market Analysis, Insights and Forecast - by Technology
- 9.2.1. Stereolithography (SLA)
- 9.2.2. Digital Light Processing (DLP)
- 9.2.3. Continuous Digital Light Processing (CDLP)
- 9.3. Market Analysis, Insights and Forecast - by Application
- 9.3.1. Dentistry
- 9.3.2. Orthopedics
- 9.3.3. Tissue Engineering
- 9.3.4. Other Ap
- 9.1. Market Analysis, Insights and Forecast - by Component
- 10. South America Vat Photopolymerization 3D Printing Technology Market Analysis, Insights and Forecast, 2019-2031
- 10.1. Market Analysis, Insights and Forecast - by Component
- 10.1.1. Hardware
- 10.1.2. Software
- 10.1.3. Services
- 10.1.4. Materials
- 10.2. Market Analysis, Insights and Forecast - by Technology
- 10.2.1. Stereolithography (SLA)
- 10.2.2. Digital Light Processing (DLP)
- 10.2.3. Continuous Digital Light Processing (CDLP)
- 10.3. Market Analysis, Insights and Forecast - by Application
- 10.3.1. Dentistry
- 10.3.2. Orthopedics
- 10.3.3. Tissue Engineering
- 10.3.4. Other Ap
- 10.1. Market Analysis, Insights and Forecast - by Component
- 11. Competitive Analysis
- 11.1. Global Market Share Analysis 2024
- 11.2. Company Profiles
- 11.2.1 Formlabs
- 11.2.1.1. Overview
- 11.2.1.2. Products
- 11.2.1.3. SWOT Analysis
- 11.2.1.4. Recent Developments
- 11.2.1.5. Financials (Based on Availability)
- 11.2.2 3D Systems Inc
- 11.2.2.1. Overview
- 11.2.2.2. Products
- 11.2.2.3. SWOT Analysis
- 11.2.2.4. Recent Developments
- 11.2.2.5. Financials (Based on Availability)
- 11.2.3 Peopoly
- 11.2.3.1. Overview
- 11.2.3.2. Products
- 11.2.3.3. SWOT Analysis
- 11.2.3.4. Recent Developments
- 11.2.3.5. Financials (Based on Availability)
- 11.2.4 Asiga
- 11.2.4.1. Overview
- 11.2.4.2. Products
- 11.2.4.3. SWOT Analysis
- 11.2.4.4. Recent Developments
- 11.2.4.5. Financials (Based on Availability)
- 11.2.5 Tiertime
- 11.2.5.1. Overview
- 11.2.5.2. Products
- 11.2.5.3. SWOT Analysis
- 11.2.5.4. Recent Developments
- 11.2.5.5. Financials (Based on Availability)
- 11.2.6 Tasly Holding Group
- 11.2.6.1. Overview
- 11.2.6.2. Products
- 11.2.6.3. SWOT Analysis
- 11.2.6.4. Recent Developments
- 11.2.6.5. Financials (Based on Availability)
- 11.2.7 UnionTech
- 11.2.7.1. Overview
- 11.2.7.2. Products
- 11.2.7.3. SWOT Analysis
- 11.2.7.4. Recent Developments
- 11.2.7.5. Financials (Based on Availability)
- 11.2.8 Zortrax
- 11.2.8.1. Overview
- 11.2.8.2. Products
- 11.2.8.3. SWOT Analysis
- 11.2.8.4. Recent Developments
- 11.2.8.5. Financials (Based on Availability)
- 11.2.9 Rayshape*List Not Exhaustive
- 11.2.9.1. Overview
- 11.2.9.2. Products
- 11.2.9.3. SWOT Analysis
- 11.2.9.4. Recent Developments
- 11.2.9.5. Financials (Based on Availability)
- 11.2.1 Formlabs
List of Figures
- Figure 1: Global Vat Photopolymerization 3D Printing Technology Market Revenue Breakdown (Million, %) by Region 2024 & 2032
- Figure 2: Global Vat Photopolymerization 3D Printing Technology Market Volume Breakdown (Billion, %) by Region 2024 & 2032
- Figure 3: North America Vat Photopolymerization 3D Printing Technology Market Revenue (Million), by Component 2024 & 2032
- Figure 4: North America Vat Photopolymerization 3D Printing Technology Market Volume (Billion), by Component 2024 & 2032
- Figure 5: North America Vat Photopolymerization 3D Printing Technology Market Revenue Share (%), by Component 2024 & 2032
- Figure 6: North America Vat Photopolymerization 3D Printing Technology Market Volume Share (%), by Component 2024 & 2032
- Figure 7: North America Vat Photopolymerization 3D Printing Technology Market Revenue (Million), by Technology 2024 & 2032
- Figure 8: North America Vat Photopolymerization 3D Printing Technology Market Volume (Billion), by Technology 2024 & 2032
- Figure 9: North America Vat Photopolymerization 3D Printing Technology Market Revenue Share (%), by Technology 2024 & 2032
- Figure 10: North America Vat Photopolymerization 3D Printing Technology Market Volume Share (%), by Technology 2024 & 2032
- Figure 11: North America Vat Photopolymerization 3D Printing Technology Market Revenue (Million), by Application 2024 & 2032
- Figure 12: North America Vat Photopolymerization 3D Printing Technology Market Volume (Billion), by Application 2024 & 2032
- Figure 13: North America Vat Photopolymerization 3D Printing Technology Market Revenue Share (%), by Application 2024 & 2032
- Figure 14: North America Vat Photopolymerization 3D Printing Technology Market Volume Share (%), by Application 2024 & 2032
- Figure 15: North America Vat Photopolymerization 3D Printing Technology Market Revenue (Million), by Country 2024 & 2032
- Figure 16: North America Vat Photopolymerization 3D Printing Technology Market Volume (Billion), by Country 2024 & 2032
- Figure 17: North America Vat Photopolymerization 3D Printing Technology Market Revenue Share (%), by Country 2024 & 2032
- Figure 18: North America Vat Photopolymerization 3D Printing Technology Market Volume Share (%), by Country 2024 & 2032
- Figure 19: Europe Vat Photopolymerization 3D Printing Technology Market Revenue (Million), by Component 2024 & 2032
- Figure 20: Europe Vat Photopolymerization 3D Printing Technology Market Volume (Billion), by Component 2024 & 2032
- Figure 21: Europe Vat Photopolymerization 3D Printing Technology Market Revenue Share (%), by Component 2024 & 2032
- Figure 22: Europe Vat Photopolymerization 3D Printing Technology Market Volume Share (%), by Component 2024 & 2032
- Figure 23: Europe Vat Photopolymerization 3D Printing Technology Market Revenue (Million), by Technology 2024 & 2032
- Figure 24: Europe Vat Photopolymerization 3D Printing Technology Market Volume (Billion), by Technology 2024 & 2032
- Figure 25: Europe Vat Photopolymerization 3D Printing Technology Market Revenue Share (%), by Technology 2024 & 2032
- Figure 26: Europe Vat Photopolymerization 3D Printing Technology Market Volume Share (%), by Technology 2024 & 2032
- Figure 27: Europe Vat Photopolymerization 3D Printing Technology Market Revenue (Million), by Application 2024 & 2032
- Figure 28: Europe Vat Photopolymerization 3D Printing Technology Market Volume (Billion), by Application 2024 & 2032
- Figure 29: Europe Vat Photopolymerization 3D Printing Technology Market Revenue Share (%), by Application 2024 & 2032
- Figure 30: Europe Vat Photopolymerization 3D Printing Technology Market Volume Share (%), by Application 2024 & 2032
- Figure 31: Europe Vat Photopolymerization 3D Printing Technology Market Revenue (Million), by Country 2024 & 2032
- Figure 32: Europe Vat Photopolymerization 3D Printing Technology Market Volume (Billion), by Country 2024 & 2032
- Figure 33: Europe Vat Photopolymerization 3D Printing Technology Market Revenue Share (%), by Country 2024 & 2032
- Figure 34: Europe Vat Photopolymerization 3D Printing Technology Market Volume Share (%), by Country 2024 & 2032
- Figure 35: Asia Pacific Vat Photopolymerization 3D Printing Technology Market Revenue (Million), by Component 2024 & 2032
- Figure 36: Asia Pacific Vat Photopolymerization 3D Printing Technology Market Volume (Billion), by Component 2024 & 2032
- Figure 37: Asia Pacific Vat Photopolymerization 3D Printing Technology Market Revenue Share (%), by Component 2024 & 2032
- Figure 38: Asia Pacific Vat Photopolymerization 3D Printing Technology Market Volume Share (%), by Component 2024 & 2032
- Figure 39: Asia Pacific Vat Photopolymerization 3D Printing Technology Market Revenue (Million), by Technology 2024 & 2032
- Figure 40: Asia Pacific Vat Photopolymerization 3D Printing Technology Market Volume (Billion), by Technology 2024 & 2032
- Figure 41: Asia Pacific Vat Photopolymerization 3D Printing Technology Market Revenue Share (%), by Technology 2024 & 2032
- Figure 42: Asia Pacific Vat Photopolymerization 3D Printing Technology Market Volume Share (%), by Technology 2024 & 2032
- Figure 43: Asia Pacific Vat Photopolymerization 3D Printing Technology Market Revenue (Million), by Application 2024 & 2032
- Figure 44: Asia Pacific Vat Photopolymerization 3D Printing Technology Market Volume (Billion), by Application 2024 & 2032
- Figure 45: Asia Pacific Vat Photopolymerization 3D Printing Technology Market Revenue Share (%), by Application 2024 & 2032
- Figure 46: Asia Pacific Vat Photopolymerization 3D Printing Technology Market Volume Share (%), by Application 2024 & 2032
- Figure 47: Asia Pacific Vat Photopolymerization 3D Printing Technology Market Revenue (Million), by Country 2024 & 2032
- Figure 48: Asia Pacific Vat Photopolymerization 3D Printing Technology Market Volume (Billion), by Country 2024 & 2032
- Figure 49: Asia Pacific Vat Photopolymerization 3D Printing Technology Market Revenue Share (%), by Country 2024 & 2032
- Figure 50: Asia Pacific Vat Photopolymerization 3D Printing Technology Market Volume Share (%), by Country 2024 & 2032
- Figure 51: Middle East and Africa Vat Photopolymerization 3D Printing Technology Market Revenue (Million), by Component 2024 & 2032
- Figure 52: Middle East and Africa Vat Photopolymerization 3D Printing Technology Market Volume (Billion), by Component 2024 & 2032
- Figure 53: Middle East and Africa Vat Photopolymerization 3D Printing Technology Market Revenue Share (%), by Component 2024 & 2032
- Figure 54: Middle East and Africa Vat Photopolymerization 3D Printing Technology Market Volume Share (%), by Component 2024 & 2032
- Figure 55: Middle East and Africa Vat Photopolymerization 3D Printing Technology Market Revenue (Million), by Technology 2024 & 2032
- Figure 56: Middle East and Africa Vat Photopolymerization 3D Printing Technology Market Volume (Billion), by Technology 2024 & 2032
- Figure 57: Middle East and Africa Vat Photopolymerization 3D Printing Technology Market Revenue Share (%), by Technology 2024 & 2032
- Figure 58: Middle East and Africa Vat Photopolymerization 3D Printing Technology Market Volume Share (%), by Technology 2024 & 2032
- Figure 59: Middle East and Africa Vat Photopolymerization 3D Printing Technology Market Revenue (Million), by Application 2024 & 2032
- Figure 60: Middle East and Africa Vat Photopolymerization 3D Printing Technology Market Volume (Billion), by Application 2024 & 2032
- Figure 61: Middle East and Africa Vat Photopolymerization 3D Printing Technology Market Revenue Share (%), by Application 2024 & 2032
- Figure 62: Middle East and Africa Vat Photopolymerization 3D Printing Technology Market Volume Share (%), by Application 2024 & 2032
- Figure 63: Middle East and Africa Vat Photopolymerization 3D Printing Technology Market Revenue (Million), by Country 2024 & 2032
- Figure 64: Middle East and Africa Vat Photopolymerization 3D Printing Technology Market Volume (Billion), by Country 2024 & 2032
- Figure 65: Middle East and Africa Vat Photopolymerization 3D Printing Technology Market Revenue Share (%), by Country 2024 & 2032
- Figure 66: Middle East and Africa Vat Photopolymerization 3D Printing Technology Market Volume Share (%), by Country 2024 & 2032
- Figure 67: South America Vat Photopolymerization 3D Printing Technology Market Revenue (Million), by Component 2024 & 2032
- Figure 68: South America Vat Photopolymerization 3D Printing Technology Market Volume (Billion), by Component 2024 & 2032
- Figure 69: South America Vat Photopolymerization 3D Printing Technology Market Revenue Share (%), by Component 2024 & 2032
- Figure 70: South America Vat Photopolymerization 3D Printing Technology Market Volume Share (%), by Component 2024 & 2032
- Figure 71: South America Vat Photopolymerization 3D Printing Technology Market Revenue (Million), by Technology 2024 & 2032
- Figure 72: South America Vat Photopolymerization 3D Printing Technology Market Volume (Billion), by Technology 2024 & 2032
- Figure 73: South America Vat Photopolymerization 3D Printing Technology Market Revenue Share (%), by Technology 2024 & 2032
- Figure 74: South America Vat Photopolymerization 3D Printing Technology Market Volume Share (%), by Technology 2024 & 2032
- Figure 75: South America Vat Photopolymerization 3D Printing Technology Market Revenue (Million), by Application 2024 & 2032
- Figure 76: South America Vat Photopolymerization 3D Printing Technology Market Volume (Billion), by Application 2024 & 2032
- Figure 77: South America Vat Photopolymerization 3D Printing Technology Market Revenue Share (%), by Application 2024 & 2032
- Figure 78: South America Vat Photopolymerization 3D Printing Technology Market Volume Share (%), by Application 2024 & 2032
- Figure 79: South America Vat Photopolymerization 3D Printing Technology Market Revenue (Million), by Country 2024 & 2032
- Figure 80: South America Vat Photopolymerization 3D Printing Technology Market Volume (Billion), by Country 2024 & 2032
- Figure 81: South America Vat Photopolymerization 3D Printing Technology Market Revenue Share (%), by Country 2024 & 2032
- Figure 82: South America Vat Photopolymerization 3D Printing Technology Market Volume Share (%), by Country 2024 & 2032
List of Tables
- Table 1: Global Vat Photopolymerization 3D Printing Technology Market Revenue Million Forecast, by Region 2019 & 2032
- Table 2: Global Vat Photopolymerization 3D Printing Technology Market Volume Billion Forecast, by Region 2019 & 2032
- Table 3: Global Vat Photopolymerization 3D Printing Technology Market Revenue Million Forecast, by Component 2019 & 2032
- Table 4: Global Vat Photopolymerization 3D Printing Technology Market Volume Billion Forecast, by Component 2019 & 2032
- Table 5: Global Vat Photopolymerization 3D Printing Technology Market Revenue Million Forecast, by Technology 2019 & 2032
- Table 6: Global Vat Photopolymerization 3D Printing Technology Market Volume Billion Forecast, by Technology 2019 & 2032
- Table 7: Global Vat Photopolymerization 3D Printing Technology Market Revenue Million Forecast, by Application 2019 & 2032
- Table 8: Global Vat Photopolymerization 3D Printing Technology Market Volume Billion Forecast, by Application 2019 & 2032
- Table 9: Global Vat Photopolymerization 3D Printing Technology Market Revenue Million Forecast, by Region 2019 & 2032
- Table 10: Global Vat Photopolymerization 3D Printing Technology Market Volume Billion Forecast, by Region 2019 & 2032
- Table 11: Global Vat Photopolymerization 3D Printing Technology Market Revenue Million Forecast, by Component 2019 & 2032
- Table 12: Global Vat Photopolymerization 3D Printing Technology Market Volume Billion Forecast, by Component 2019 & 2032
- Table 13: Global Vat Photopolymerization 3D Printing Technology Market Revenue Million Forecast, by Technology 2019 & 2032
- Table 14: Global Vat Photopolymerization 3D Printing Technology Market Volume Billion Forecast, by Technology 2019 & 2032
- Table 15: Global Vat Photopolymerization 3D Printing Technology Market Revenue Million Forecast, by Application 2019 & 2032
- Table 16: Global Vat Photopolymerization 3D Printing Technology Market Volume Billion Forecast, by Application 2019 & 2032
- Table 17: Global Vat Photopolymerization 3D Printing Technology Market Revenue Million Forecast, by Country 2019 & 2032
- Table 18: Global Vat Photopolymerization 3D Printing Technology Market Volume Billion Forecast, by Country 2019 & 2032
- Table 19: United States Vat Photopolymerization 3D Printing Technology Market Revenue (Million) Forecast, by Application 2019 & 2032
- Table 20: United States Vat Photopolymerization 3D Printing Technology Market Volume (Billion) Forecast, by Application 2019 & 2032
- Table 21: Canada Vat Photopolymerization 3D Printing Technology Market Revenue (Million) Forecast, by Application 2019 & 2032
- Table 22: Canada Vat Photopolymerization 3D Printing Technology Market Volume (Billion) Forecast, by Application 2019 & 2032
- Table 23: Mexico Vat Photopolymerization 3D Printing Technology Market Revenue (Million) Forecast, by Application 2019 & 2032
- Table 24: Mexico Vat Photopolymerization 3D Printing Technology Market Volume (Billion) Forecast, by Application 2019 & 2032
- Table 25: Global Vat Photopolymerization 3D Printing Technology Market Revenue Million Forecast, by Component 2019 & 2032
- Table 26: Global Vat Photopolymerization 3D Printing Technology Market Volume Billion Forecast, by Component 2019 & 2032
- Table 27: Global Vat Photopolymerization 3D Printing Technology Market Revenue Million Forecast, by Technology 2019 & 2032
- Table 28: Global Vat Photopolymerization 3D Printing Technology Market Volume Billion Forecast, by Technology 2019 & 2032
- Table 29: Global Vat Photopolymerization 3D Printing Technology Market Revenue Million Forecast, by Application 2019 & 2032
- Table 30: Global Vat Photopolymerization 3D Printing Technology Market Volume Billion Forecast, by Application 2019 & 2032
- Table 31: Global Vat Photopolymerization 3D Printing Technology Market Revenue Million Forecast, by Country 2019 & 2032
- Table 32: Global Vat Photopolymerization 3D Printing Technology Market Volume Billion Forecast, by Country 2019 & 2032
- Table 33: Germany Vat Photopolymerization 3D Printing Technology Market Revenue (Million) Forecast, by Application 2019 & 2032
- Table 34: Germany Vat Photopolymerization 3D Printing Technology Market Volume (Billion) Forecast, by Application 2019 & 2032
- Table 35: United Kingdom Vat Photopolymerization 3D Printing Technology Market Revenue (Million) Forecast, by Application 2019 & 2032
- Table 36: United Kingdom Vat Photopolymerization 3D Printing Technology Market Volume (Billion) Forecast, by Application 2019 & 2032
- Table 37: France Vat Photopolymerization 3D Printing Technology Market Revenue (Million) Forecast, by Application 2019 & 2032
- Table 38: France Vat Photopolymerization 3D Printing Technology Market Volume (Billion) Forecast, by Application 2019 & 2032
- Table 39: Italy Vat Photopolymerization 3D Printing Technology Market Revenue (Million) Forecast, by Application 2019 & 2032
- Table 40: Italy Vat Photopolymerization 3D Printing Technology Market Volume (Billion) Forecast, by Application 2019 & 2032
- Table 41: Spain Vat Photopolymerization 3D Printing Technology Market Revenue (Million) Forecast, by Application 2019 & 2032
- Table 42: Spain Vat Photopolymerization 3D Printing Technology Market Volume (Billion) Forecast, by Application 2019 & 2032
- Table 43: Rest of Europe Vat Photopolymerization 3D Printing Technology Market Revenue (Million) Forecast, by Application 2019 & 2032
- Table 44: Rest of Europe Vat Photopolymerization 3D Printing Technology Market Volume (Billion) Forecast, by Application 2019 & 2032
- Table 45: Global Vat Photopolymerization 3D Printing Technology Market Revenue Million Forecast, by Component 2019 & 2032
- Table 46: Global Vat Photopolymerization 3D Printing Technology Market Volume Billion Forecast, by Component 2019 & 2032
- Table 47: Global Vat Photopolymerization 3D Printing Technology Market Revenue Million Forecast, by Technology 2019 & 2032
- Table 48: Global Vat Photopolymerization 3D Printing Technology Market Volume Billion Forecast, by Technology 2019 & 2032
- Table 49: Global Vat Photopolymerization 3D Printing Technology Market Revenue Million Forecast, by Application 2019 & 2032
- Table 50: Global Vat Photopolymerization 3D Printing Technology Market Volume Billion Forecast, by Application 2019 & 2032
- Table 51: Global Vat Photopolymerization 3D Printing Technology Market Revenue Million Forecast, by Country 2019 & 2032
- Table 52: Global Vat Photopolymerization 3D Printing Technology Market Volume Billion Forecast, by Country 2019 & 2032
- Table 53: China Vat Photopolymerization 3D Printing Technology Market Revenue (Million) Forecast, by Application 2019 & 2032
- Table 54: China Vat Photopolymerization 3D Printing Technology Market Volume (Billion) Forecast, by Application 2019 & 2032
- Table 55: Japan Vat Photopolymerization 3D Printing Technology Market Revenue (Million) Forecast, by Application 2019 & 2032
- Table 56: Japan Vat Photopolymerization 3D Printing Technology Market Volume (Billion) Forecast, by Application 2019 & 2032
- Table 57: India Vat Photopolymerization 3D Printing Technology Market Revenue (Million) Forecast, by Application 2019 & 2032
- Table 58: India Vat Photopolymerization 3D Printing Technology Market Volume (Billion) Forecast, by Application 2019 & 2032
- Table 59: Australia Vat Photopolymerization 3D Printing Technology Market Revenue (Million) Forecast, by Application 2019 & 2032
- Table 60: Australia Vat Photopolymerization 3D Printing Technology Market Volume (Billion) Forecast, by Application 2019 & 2032
- Table 61: South Korea Vat Photopolymerization 3D Printing Technology Market Revenue (Million) Forecast, by Application 2019 & 2032
- Table 62: South Korea Vat Photopolymerization 3D Printing Technology Market Volume (Billion) Forecast, by Application 2019 & 2032
- Table 63: Rest of Asia Pacific Vat Photopolymerization 3D Printing Technology Market Revenue (Million) Forecast, by Application 2019 & 2032
- Table 64: Rest of Asia Pacific Vat Photopolymerization 3D Printing Technology Market Volume (Billion) Forecast, by Application 2019 & 2032
- Table 65: Global Vat Photopolymerization 3D Printing Technology Market Revenue Million Forecast, by Component 2019 & 2032
- Table 66: Global Vat Photopolymerization 3D Printing Technology Market Volume Billion Forecast, by Component 2019 & 2032
- Table 67: Global Vat Photopolymerization 3D Printing Technology Market Revenue Million Forecast, by Technology 2019 & 2032
- Table 68: Global Vat Photopolymerization 3D Printing Technology Market Volume Billion Forecast, by Technology 2019 & 2032
- Table 69: Global Vat Photopolymerization 3D Printing Technology Market Revenue Million Forecast, by Application 2019 & 2032
- Table 70: Global Vat Photopolymerization 3D Printing Technology Market Volume Billion Forecast, by Application 2019 & 2032
- Table 71: Global Vat Photopolymerization 3D Printing Technology Market Revenue Million Forecast, by Country 2019 & 2032
- Table 72: Global Vat Photopolymerization 3D Printing Technology Market Volume Billion Forecast, by Country 2019 & 2032
- Table 73: GCC Vat Photopolymerization 3D Printing Technology Market Revenue (Million) Forecast, by Application 2019 & 2032
- Table 74: GCC Vat Photopolymerization 3D Printing Technology Market Volume (Billion) Forecast, by Application 2019 & 2032
- Table 75: South Africa Vat Photopolymerization 3D Printing Technology Market Revenue (Million) Forecast, by Application 2019 & 2032
- Table 76: South Africa Vat Photopolymerization 3D Printing Technology Market Volume (Billion) Forecast, by Application 2019 & 2032
- Table 77: Rest of Middle East and Africa Vat Photopolymerization 3D Printing Technology Market Revenue (Million) Forecast, by Application 2019 & 2032
- Table 78: Rest of Middle East and Africa Vat Photopolymerization 3D Printing Technology Market Volume (Billion) Forecast, by Application 2019 & 2032
- Table 79: Global Vat Photopolymerization 3D Printing Technology Market Revenue Million Forecast, by Component 2019 & 2032
- Table 80: Global Vat Photopolymerization 3D Printing Technology Market Volume Billion Forecast, by Component 2019 & 2032
- Table 81: Global Vat Photopolymerization 3D Printing Technology Market Revenue Million Forecast, by Technology 2019 & 2032
- Table 82: Global Vat Photopolymerization 3D Printing Technology Market Volume Billion Forecast, by Technology 2019 & 2032
- Table 83: Global Vat Photopolymerization 3D Printing Technology Market Revenue Million Forecast, by Application 2019 & 2032
- Table 84: Global Vat Photopolymerization 3D Printing Technology Market Volume Billion Forecast, by Application 2019 & 2032
- Table 85: Global Vat Photopolymerization 3D Printing Technology Market Revenue Million Forecast, by Country 2019 & 2032
- Table 86: Global Vat Photopolymerization 3D Printing Technology Market Volume Billion Forecast, by Country 2019 & 2032
- Table 87: Brazil Vat Photopolymerization 3D Printing Technology Market Revenue (Million) Forecast, by Application 2019 & 2032
- Table 88: Brazil Vat Photopolymerization 3D Printing Technology Market Volume (Billion) Forecast, by Application 2019 & 2032
- Table 89: Argentina Vat Photopolymerization 3D Printing Technology Market Revenue (Million) Forecast, by Application 2019 & 2032
- Table 90: Argentina Vat Photopolymerization 3D Printing Technology Market Volume (Billion) Forecast, by Application 2019 & 2032
- Table 91: Rest of South America Vat Photopolymerization 3D Printing Technology Market Revenue (Million) Forecast, by Application 2019 & 2032
- Table 92: Rest of South America Vat Photopolymerization 3D Printing Technology Market Volume (Billion) Forecast, by Application 2019 & 2032
Frequently Asked Questions
1. What is the projected Compound Annual Growth Rate (CAGR) of the Vat Photopolymerization 3D Printing Technology Market?
The projected CAGR is approximately 26.02%.
2. Which companies are prominent players in the Vat Photopolymerization 3D Printing Technology Market?
Key companies in the market include Formlabs, 3D Systems Inc, Peopoly, Asiga, Tiertime, Tasly Holding Group, UnionTech, Zortrax, Rayshape*List Not Exhaustive.
3. What are the main segments of the Vat Photopolymerization 3D Printing Technology Market?
The market segments include Component, Technology, Application.
4. Can you provide details about the market size?
The market size is estimated to be USD 2.17 Million as of 2022.
5. What are some drivers contributing to market growth?
Rising Demand for Minimally Invasive Procedures; Growing Technological Advancements.
6. What are the notable trends driving market growth?
Orthopedics Segment Expected to Hold a Significant Market Share Over the Forecast Period.
7. Are there any restraints impacting market growth?
Rising Demand for Minimally Invasive Procedures; Growing Technological Advancements.
8. Can you provide examples of recent developments in the market?
March 2024: Sprybuild, an Israeli start-up, reported the launch of its SLA 3D printer featuring a patented continuous build process on a conveyor belt and rigid optical interface. This 3D printer can be used in the production of dental models, orthopedic insoles, eyeglass frames, hearing aids, and prosthetic components.February 2024: SHINING 3D, a 3D digitization and printing solutions provider, reported the launch of AccuFab-CEL, a dental 3D printer, at the largest dental laboratory event in the United States, LabDay 2024.
9. What pricing options are available for accessing the report?
Pricing options include single-user, multi-user, and enterprise licenses priced at USD 4750, USD 5250, and USD 8750 respectively.
10. Is the market size provided in terms of value or volume?
The market size is provided in terms of value, measured in Million and volume, measured in Billion.
11. Are there any specific market keywords associated with the report?
Yes, the market keyword associated with the report is "Vat Photopolymerization 3D Printing Technology Market," which aids in identifying and referencing the specific market segment covered.
12. How do I determine which pricing option suits my needs best?
The pricing options vary based on user requirements and access needs. Individual users may opt for single-user licenses, while businesses requiring broader access may choose multi-user or enterprise licenses for cost-effective access to the report.
13. Are there any additional resources or data provided in the Vat Photopolymerization 3D Printing Technology Market report?
While the report offers comprehensive insights, it's advisable to review the specific contents or supplementary materials provided to ascertain if additional resources or data are available.
14. How can I stay updated on further developments or reports in the Vat Photopolymerization 3D Printing Technology Market?
To stay informed about further developments, trends, and reports in the Vat Photopolymerization 3D Printing Technology Market, consider subscribing to industry newsletters, following relevant companies and organizations, or regularly checking reputable industry news sources and publications.
Methodology
Step 1 - Identification of Relevant Samples Size from Population Database


Step 2 - Approaches for Defining Global Market Size (Value, Volume* & Price*)

Note*: In applicable scenarios
Step 3 - Data Sources
Primary Research
- Web Analytics
- Survey Reports
- Research Institute
- Latest Research Reports
- Opinion Leaders
Secondary Research
- Annual Reports
- White Paper
- Latest Press Release
- Industry Association
- Paid Database
- Investor Presentations

Step 4 - Data Triangulation
Involves using different sources of information in order to increase the validity of a study
These sources are likely to be stakeholders in a program - participants, other researchers, program staff, other community members, and so on.
Then we put all data in single framework & apply various statistical tools to find out the dynamic on the market.
During the analysis stage, feedback from the stakeholder groups would be compared to determine areas of agreement as well as areas of divergence


