
Key Insights
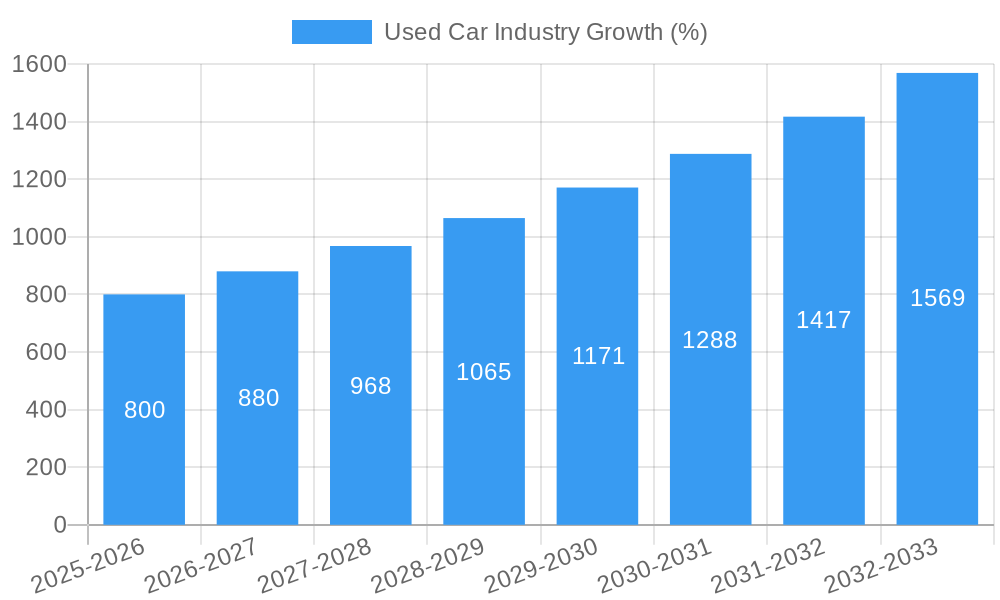
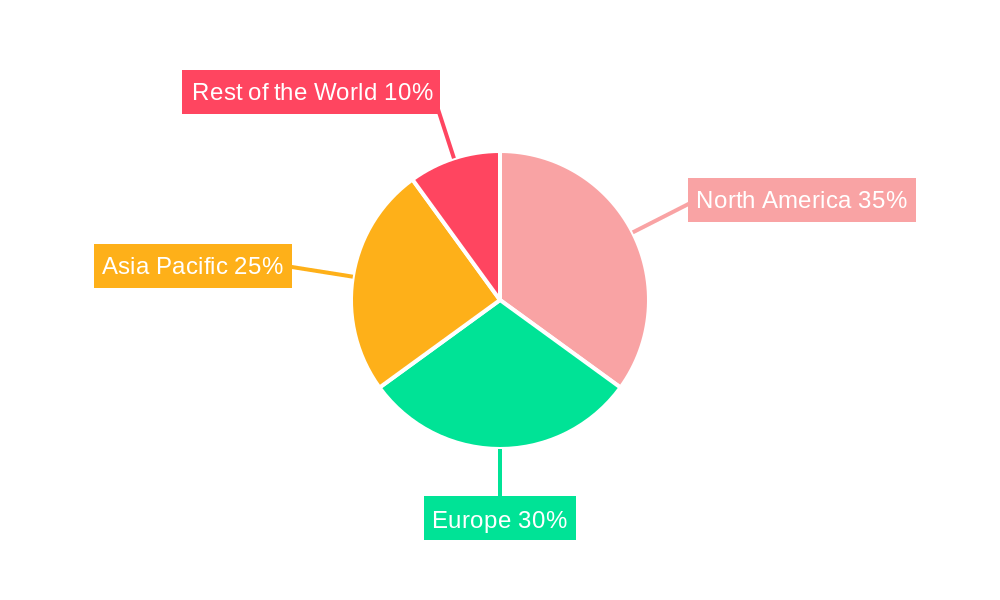
The global used car market, currently experiencing robust growth, is projected to maintain a Compound Annual Growth Rate (CAGR) of 10% from 2025 to 2033. This expansion is driven by several factors. Increasing vehicle ownership in developing economies, particularly in Asia-Pacific regions like India and China, fuels significant demand for more affordable used cars. Simultaneously, the rising cost of new vehicles and economic uncertainty are pushing consumers towards the pre-owned market in developed nations like the US and across Europe. Furthermore, the emergence of online marketplaces and improved vehicle inspection processes have enhanced transparency and trust, boosting consumer confidence in used car purchases. The market is segmented by vehicle type (hatchbacks, sedans, SUVs, MPVs) and vendor type (organized and unorganized). Organized vendors, including large dealerships and online platforms like CarMax and Cox Automotive, are witnessing growth due to their streamlined processes, financing options, and warranty programs. However, the unorganized sector still holds a significant share, particularly in emerging markets. Geographic variations exist, with North America and Europe currently dominating the market, but Asia-Pacific is expected to experience the fastest growth in the coming years. The restraints on market growth include concerns regarding vehicle reliability and maintenance costs, along with stringent emission regulations in some regions impacting the resale value of older vehicles.
The competitive landscape is dominated by a mix of global players and regional dealerships. Companies like Hertz, Arnold Clark, and AutoNation cater to a diverse clientele, while regional players focus on localized markets. The growth of online platforms is reshaping the industry, facilitating direct consumer-to-consumer transactions and improved price transparency. Future growth will depend on factors such as evolving consumer preferences, technological advancements in vehicle inspection and valuation, and the overall economic climate. The increasing integration of data analytics and artificial intelligence will play a crucial role in optimizing pricing strategies, enhancing customer experience, and improving risk assessment within the used car market. The market will likely see continued consolidation, with larger players acquiring smaller dealerships to expand their reach and market share.
Used Car Industry Market Report: 2019-2033
This comprehensive report provides a detailed analysis of the global used car industry, projecting a market value exceeding $XX Million by 2033. The study covers the period 2019-2033, with 2025 as the base and estimated year. It offers actionable insights for industry stakeholders, investors, and businesses seeking to navigate this dynamic market. The report meticulously segments the market by vehicle type (Hatchbacks, Sedan, Sports Utility Vehicles, and Multi-Purpose Vehicles) and vendor (Organized and Unorganized), analyzing key trends, competitive dynamics, and future growth potential.
Used Car Industry Market Structure & Competitive Dynamics
The global used car market is characterized by a complex interplay of established players and emerging disruptors. Market concentration is moderate, with key players such as CarMax Inc., AutoNation, and Cox Automotive holding significant market share, but a large fragmented segment exists amongst independent dealers. The industry’s innovation ecosystem is vibrant, driven by technological advancements in online marketplaces, vehicle inspection technologies, and financing solutions. Regulatory frameworks, varying by region, influence market access and operations. Product substitutes, including public transportation and ride-sharing services, pose a competitive threat, particularly in urban areas. End-user trends toward online purchasing and flexible financing options are transforming the buying experience. M&A activity has been robust, with deal values exceeding $XX Million in recent years, reflecting consolidation within the organized sector. For example, the acquisition of smaller dealerships by larger corporations has been a notable trend, impacting market concentration and competitive dynamics.
Used Car Industry Industry Trends & Insights
The used car market exhibits robust growth, driven by factors such as increasing vehicle affordability, fluctuating new car prices, and the rising popularity of pre-owned vehicles among budget-conscious consumers. Technological advancements, particularly the proliferation of online marketplaces and mobile apps such as Mobil88's Mo88i, have significantly streamlined the buying and selling process. Consumer preferences are shifting towards vehicles with advanced safety features and lower mileage. The competitive landscape is highly dynamic, with new entrants adopting innovative business models and established players focusing on expanding their digital presence and service offerings. The Compound Annual Growth Rate (CAGR) during the forecast period (2025-2033) is projected to be XX%, driven by strong growth in key regions and segments. Market penetration of online platforms continues to rise, with an estimated XX% of used car transactions taking place online by 2033.
Dominant Markets & Segments in Used Car Industry
The United States remains the dominant market for used cars globally, driven by a large consumer base, established infrastructure, and a mature automotive market. Within the segments:
- By Vehicle Type: SUVs and Multi-Purpose Vehicles are experiencing the highest growth rates due to increasing consumer demand for spacious and versatile vehicles.
- By Vendor: The organized sector, dominated by large dealerships and online platforms, is growing faster than the unorganized sector, reflecting the increasing adoption of professionalized and transparent transaction processes.
Key drivers of dominance include:
- Favorable economic conditions and consumer spending patterns.
- Well-developed automotive retail infrastructure.
- Robust financing options and consumer credit availability.
Used Car Industry Product Innovations
Recent product innovations focus on enhancing the customer experience through technology. This includes online marketplaces providing transparent pricing and detailed vehicle history reports, mobile apps that simplify the buying and selling process, and data-driven tools for vehicle valuation and condition assessment. These innovations aim to address consumer concerns about transparency and trust in the used car market, increasing customer adoption.
Report Segmentation & Scope
This report segments the used car market by:
By Vehicle Type: Hatchbacks, Sedan, Sports Utility Vehicles, and Multi-Purpose Vehicles. Each segment's market size, growth projections, and competitive dynamics are analyzed based on factors like consumer preferences and pricing.
By Vendor: Organized (large dealerships, franchises, and online marketplaces) and Unorganized (individual sellers and small dealerships). The organized sector is exhibiting faster growth due to scalability and access to funding. Competition within this segment is intense, with a focus on expanding online platforms and building brand trust.
Key Drivers of Used Car Industry Growth
Several factors are driving the growth of the used car industry:
- Increasing affordability: Used cars offer a more affordable entry point into vehicle ownership compared to new cars.
- Technological advancements: Online marketplaces and mobile apps simplify the buying and selling process.
- Growing consumer preference: Consumers increasingly favor used cars due to value and lower depreciation.
Challenges in the Used Car Industry Sector
The used car industry faces several challenges:
- Regulatory hurdles: Varying regulations across regions add complexity and compliance costs.
- Supply chain disruptions: Global supply chain issues impact the availability of certain vehicles.
- Competitive pressures: Intense competition from established players and new entrants requires constant innovation. These pressures are driving a downward pressure on margins for some actors in the market.
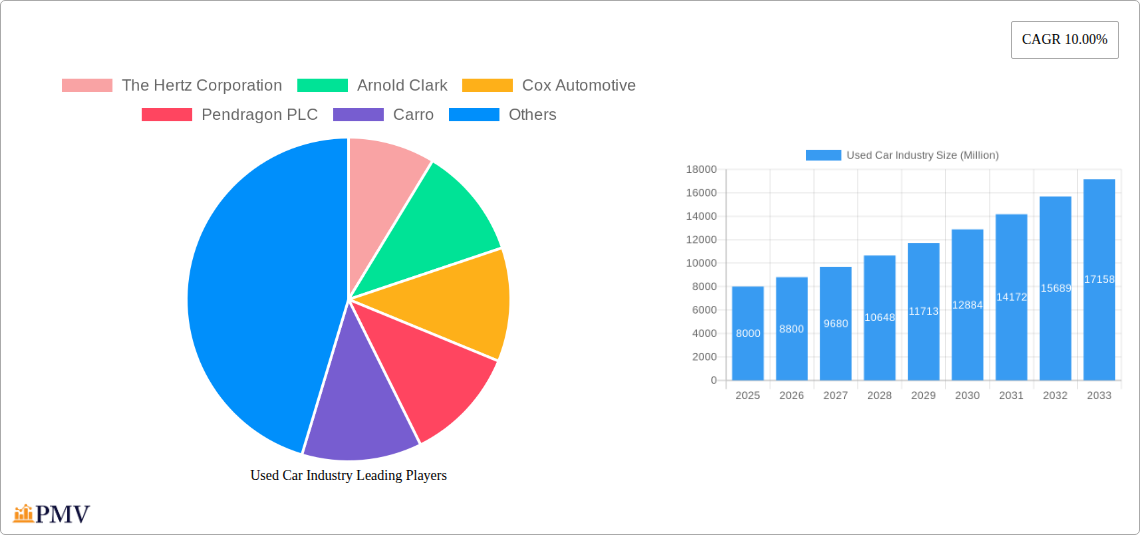
Leading Players in the Used Car Industry Market
- The Hertz Corporation
- Arnold Clark
- Cox Automotive
- Pendragon PLC
- Carro
- AutoNation
- Asbury Automotive Group
- Mahindra First Choice Wheels
- Penske Cars
- CarMax Inc
- Maruti Suzuki True Value
- Emil Frey AG
Key Developments in Used Car Industry Sector
- March 2022: TrueCar Inc. launched TrueCar+, a new online car-buying marketplace.
- January 2022: General Motors launched Carvago, a used car platform.
- September 2021: Mobil88 launched the Mo88i app for used car buying and selling.
- March 2021: Penske Automotive Group adopted CarShop as its global used vehicle brand.
These developments reflect the industry's ongoing shift toward digitalization and enhanced consumer experiences.
Strategic Used Car Industry Market Outlook
The used car market is poised for continued growth, driven by technological innovation, evolving consumer preferences, and increasing affordability. Strategic opportunities exist for companies that can leverage technology to improve transparency, streamline transactions, and enhance the overall customer experience. The focus on providing financing options and data-driven valuations is crucial for attracting a broader customer base and maintaining a competitive edge in the expanding market. This creates a highly dynamic and competitive environment poised for further consolidation and expansion in the coming years.
Used Car Industry Segmentation
-
1. Vehicle Type
- 1.1. Hatchbacks
- 1.2. Sedan
- 1.3. Sports Utility Vehicles and Multi-Purpose Vehicles
-
2. Vendor
- 2.1. Organized
- 2.2. Unorganized
Used Car Industry Segmentation By Geography
-
1. North America
- 1.1. United States
- 1.2. Canada
- 1.3. Rest of North America
-
2. Europe
- 2.1. Germany
- 2.2. United Kingdom
- 2.3. France
- 2.4. Spain
- 2.5. Rest of Europe
-
3. Asia Pacific
- 3.1. China
- 3.2. India
- 3.3. Japan
- 3.4. South Korea
- 3.5. Rest of Asia Pacific
-
4. Rest of the World
- 4.1. Brazil
- 4.2. United Arab Emirates
- 4.3. South Africa
- 4.4. Other Countries
Used Car Industry REPORT HIGHLIGHTS
| Aspects | Details |
|---|---|
| Study Period | 2019-2033 |
| Base Year | 2024 |
| Estimated Year | 2025 |
| Forecast Period | 2025-2033 |
| Historical Period | 2019-2024 |
| Growth Rate | CAGR of 10.00% from 2019-2033 |
| Segmentation |
|
Table of Contents
- 1. Introduction
- 1.1. Research Scope
- 1.2. Market Segmentation
- 1.3. Research Methodology
- 1.4. Definitions and Assumptions
- 2. Executive Summary
- 2.1. Introduction
- 3. Market Dynamics
- 3.1. Introduction
- 3.2. Market Drivers
- 3.2.1. Increasing Demand For Electric School Buses
- 3.3. Market Restrains
- 3.3.1. Uncertainty of The Global Pandemic
- 3.4. Market Trends
- 3.4.1. Strengthening of Online Infrastructure Positively Affecting the Used Cars Market
- 4. Market Factor Analysis
- 4.1. Porters Five Forces
- 4.2. Supply/Value Chain
- 4.3. PESTEL analysis
- 4.4. Market Entropy
- 4.5. Patent/Trademark Analysis
- 5. Global Used Car Industry Analysis, Insights and Forecast, 2019-2031
- 5.1. Market Analysis, Insights and Forecast - by Vehicle Type
- 5.1.1. Hatchbacks
- 5.1.2. Sedan
- 5.1.3. Sports Utility Vehicles and Multi-Purpose Vehicles
- 5.2. Market Analysis, Insights and Forecast - by Vendor
- 5.2.1. Organized
- 5.2.2. Unorganized
- 5.3. Market Analysis, Insights and Forecast - by Region
- 5.3.1. North America
- 5.3.2. Europe
- 5.3.3. Asia Pacific
- 5.3.4. Rest of the World
- 5.1. Market Analysis, Insights and Forecast - by Vehicle Type
- 6. North America Used Car Industry Analysis, Insights and Forecast, 2019-2031
- 6.1. Market Analysis, Insights and Forecast - by Vehicle Type
- 6.1.1. Hatchbacks
- 6.1.2. Sedan
- 6.1.3. Sports Utility Vehicles and Multi-Purpose Vehicles
- 6.2. Market Analysis, Insights and Forecast - by Vendor
- 6.2.1. Organized
- 6.2.2. Unorganized
- 6.1. Market Analysis, Insights and Forecast - by Vehicle Type
- 7. Europe Used Car Industry Analysis, Insights and Forecast, 2019-2031
- 7.1. Market Analysis, Insights and Forecast - by Vehicle Type
- 7.1.1. Hatchbacks
- 7.1.2. Sedan
- 7.1.3. Sports Utility Vehicles and Multi-Purpose Vehicles
- 7.2. Market Analysis, Insights and Forecast - by Vendor
- 7.2.1. Organized
- 7.2.2. Unorganized
- 7.1. Market Analysis, Insights and Forecast - by Vehicle Type
- 8. Asia Pacific Used Car Industry Analysis, Insights and Forecast, 2019-2031
- 8.1. Market Analysis, Insights and Forecast - by Vehicle Type
- 8.1.1. Hatchbacks
- 8.1.2. Sedan
- 8.1.3. Sports Utility Vehicles and Multi-Purpose Vehicles
- 8.2. Market Analysis, Insights and Forecast - by Vendor
- 8.2.1. Organized
- 8.2.2. Unorganized
- 8.1. Market Analysis, Insights and Forecast - by Vehicle Type
- 9. Rest of the World Used Car Industry Analysis, Insights and Forecast, 2019-2031
- 9.1. Market Analysis, Insights and Forecast - by Vehicle Type
- 9.1.1. Hatchbacks
- 9.1.2. Sedan
- 9.1.3. Sports Utility Vehicles and Multi-Purpose Vehicles
- 9.2. Market Analysis, Insights and Forecast - by Vendor
- 9.2.1. Organized
- 9.2.2. Unorganized
- 9.1. Market Analysis, Insights and Forecast - by Vehicle Type
- 10. North America Used Car Industry Analysis, Insights and Forecast, 2019-2031
- 10.1. Market Analysis, Insights and Forecast - By Country/Sub-region
- 10.1.1 United States
- 10.1.2 Canada
- 10.1.3 Rest of North America
- 11. Europe Used Car Industry Analysis, Insights and Forecast, 2019-2031
- 11.1. Market Analysis, Insights and Forecast - By Country/Sub-region
- 11.1.1 Germany
- 11.1.2 United Kingdom
- 11.1.3 France
- 11.1.4 Spain
- 11.1.5 Rest of Europe
- 12. Asia Pacific Used Car Industry Analysis, Insights and Forecast, 2019-2031
- 12.1. Market Analysis, Insights and Forecast - By Country/Sub-region
- 12.1.1 China
- 12.1.2 India
- 12.1.3 Japan
- 12.1.4 South Korea
- 12.1.5 Rest of Asia Pacific
- 13. Rest of the World Used Car Industry Analysis, Insights and Forecast, 2019-2031
- 13.1. Market Analysis, Insights and Forecast - By Country/Sub-region
- 13.1.1 Brazil
- 13.1.2 United Arab Emirates
- 13.1.3 South Africa
- 13.1.4 Other Countries
- 14. Competitive Analysis
- 14.1. Global Market Share Analysis 2024
- 14.2. Company Profiles
- 14.2.1 The Hertz Corporation
- 14.2.1.1. Overview
- 14.2.1.2. Products
- 14.2.1.3. SWOT Analysis
- 14.2.1.4. Recent Developments
- 14.2.1.5. Financials (Based on Availability)
- 14.2.2 Arnold Clark
- 14.2.2.1. Overview
- 14.2.2.2. Products
- 14.2.2.3. SWOT Analysis
- 14.2.2.4. Recent Developments
- 14.2.2.5. Financials (Based on Availability)
- 14.2.3 Cox Automotive
- 14.2.3.1. Overview
- 14.2.3.2. Products
- 14.2.3.3. SWOT Analysis
- 14.2.3.4. Recent Developments
- 14.2.3.5. Financials (Based on Availability)
- 14.2.4 Pendragon PLC
- 14.2.4.1. Overview
- 14.2.4.2. Products
- 14.2.4.3. SWOT Analysis
- 14.2.4.4. Recent Developments
- 14.2.4.5. Financials (Based on Availability)
- 14.2.5 Carro
- 14.2.5.1. Overview
- 14.2.5.2. Products
- 14.2.5.3. SWOT Analysis
- 14.2.5.4. Recent Developments
- 14.2.5.5. Financials (Based on Availability)
- 14.2.6 AutoNation
- 14.2.6.1. Overview
- 14.2.6.2. Products
- 14.2.6.3. SWOT Analysis
- 14.2.6.4. Recent Developments
- 14.2.6.5. Financials (Based on Availability)
- 14.2.7 Asbury Automotive Grou
- 14.2.7.1. Overview
- 14.2.7.2. Products
- 14.2.7.3. SWOT Analysis
- 14.2.7.4. Recent Developments
- 14.2.7.5. Financials (Based on Availability)
- 14.2.8 Mahindra First Choice Wheels
- 14.2.8.1. Overview
- 14.2.8.2. Products
- 14.2.8.3. SWOT Analysis
- 14.2.8.4. Recent Developments
- 14.2.8.5. Financials (Based on Availability)
- 14.2.9 Penske Cars
- 14.2.9.1. Overview
- 14.2.9.2. Products
- 14.2.9.3. SWOT Analysis
- 14.2.9.4. Recent Developments
- 14.2.9.5. Financials (Based on Availability)
- 14.2.10 CarMax Inc
- 14.2.10.1. Overview
- 14.2.10.2. Products
- 14.2.10.3. SWOT Analysis
- 14.2.10.4. Recent Developments
- 14.2.10.5. Financials (Based on Availability)
- 14.2.11 Maruti Suzuki True Value
- 14.2.11.1. Overview
- 14.2.11.2. Products
- 14.2.11.3. SWOT Analysis
- 14.2.11.4. Recent Developments
- 14.2.11.5. Financials (Based on Availability)
- 14.2.12 Emil Frey AG
- 14.2.12.1. Overview
- 14.2.12.2. Products
- 14.2.12.3. SWOT Analysis
- 14.2.12.4. Recent Developments
- 14.2.12.5. Financials (Based on Availability)
- 14.2.1 The Hertz Corporation
List of Figures
- Figure 1: Global Used Car Industry Revenue Breakdown (Million, %) by Region 2024 & 2032
- Figure 2: North America Used Car Industry Revenue (Million), by Country 2024 & 2032
- Figure 3: North America Used Car Industry Revenue Share (%), by Country 2024 & 2032
- Figure 4: Europe Used Car Industry Revenue (Million), by Country 2024 & 2032
- Figure 5: Europe Used Car Industry Revenue Share (%), by Country 2024 & 2032
- Figure 6: Asia Pacific Used Car Industry Revenue (Million), by Country 2024 & 2032
- Figure 7: Asia Pacific Used Car Industry Revenue Share (%), by Country 2024 & 2032
- Figure 8: Rest of the World Used Car Industry Revenue (Million), by Country 2024 & 2032
- Figure 9: Rest of the World Used Car Industry Revenue Share (%), by Country 2024 & 2032
- Figure 10: North America Used Car Industry Revenue (Million), by Vehicle Type 2024 & 2032
- Figure 11: North America Used Car Industry Revenue Share (%), by Vehicle Type 2024 & 2032
- Figure 12: North America Used Car Industry Revenue (Million), by Vendor 2024 & 2032
- Figure 13: North America Used Car Industry Revenue Share (%), by Vendor 2024 & 2032
- Figure 14: North America Used Car Industry Revenue (Million), by Country 2024 & 2032
- Figure 15: North America Used Car Industry Revenue Share (%), by Country 2024 & 2032
- Figure 16: Europe Used Car Industry Revenue (Million), by Vehicle Type 2024 & 2032
- Figure 17: Europe Used Car Industry Revenue Share (%), by Vehicle Type 2024 & 2032
- Figure 18: Europe Used Car Industry Revenue (Million), by Vendor 2024 & 2032
- Figure 19: Europe Used Car Industry Revenue Share (%), by Vendor 2024 & 2032
- Figure 20: Europe Used Car Industry Revenue (Million), by Country 2024 & 2032
- Figure 21: Europe Used Car Industry Revenue Share (%), by Country 2024 & 2032
- Figure 22: Asia Pacific Used Car Industry Revenue (Million), by Vehicle Type 2024 & 2032
- Figure 23: Asia Pacific Used Car Industry Revenue Share (%), by Vehicle Type 2024 & 2032
- Figure 24: Asia Pacific Used Car Industry Revenue (Million), by Vendor 2024 & 2032
- Figure 25: Asia Pacific Used Car Industry Revenue Share (%), by Vendor 2024 & 2032
- Figure 26: Asia Pacific Used Car Industry Revenue (Million), by Country 2024 & 2032
- Figure 27: Asia Pacific Used Car Industry Revenue Share (%), by Country 2024 & 2032
- Figure 28: Rest of the World Used Car Industry Revenue (Million), by Vehicle Type 2024 & 2032
- Figure 29: Rest of the World Used Car Industry Revenue Share (%), by Vehicle Type 2024 & 2032
- Figure 30: Rest of the World Used Car Industry Revenue (Million), by Vendor 2024 & 2032
- Figure 31: Rest of the World Used Car Industry Revenue Share (%), by Vendor 2024 & 2032
- Figure 32: Rest of the World Used Car Industry Revenue (Million), by Country 2024 & 2032
- Figure 33: Rest of the World Used Car Industry Revenue Share (%), by Country 2024 & 2032
List of Tables
- Table 1: Global Used Car Industry Revenue Million Forecast, by Region 2019 & 2032
- Table 2: Global Used Car Industry Revenue Million Forecast, by Vehicle Type 2019 & 2032
- Table 3: Global Used Car Industry Revenue Million Forecast, by Vendor 2019 & 2032
- Table 4: Global Used Car Industry Revenue Million Forecast, by Region 2019 & 2032
- Table 5: Global Used Car Industry Revenue Million Forecast, by Country 2019 & 2032
- Table 6: United States Used Car Industry Revenue (Million) Forecast, by Application 2019 & 2032
- Table 7: Canada Used Car Industry Revenue (Million) Forecast, by Application 2019 & 2032
- Table 8: Rest of North America Used Car Industry Revenue (Million) Forecast, by Application 2019 & 2032
- Table 9: Global Used Car Industry Revenue Million Forecast, by Country 2019 & 2032
- Table 10: Germany Used Car Industry Revenue (Million) Forecast, by Application 2019 & 2032
- Table 11: United Kingdom Used Car Industry Revenue (Million) Forecast, by Application 2019 & 2032
- Table 12: France Used Car Industry Revenue (Million) Forecast, by Application 2019 & 2032
- Table 13: Spain Used Car Industry Revenue (Million) Forecast, by Application 2019 & 2032
- Table 14: Rest of Europe Used Car Industry Revenue (Million) Forecast, by Application 2019 & 2032
- Table 15: Global Used Car Industry Revenue Million Forecast, by Country 2019 & 2032
- Table 16: China Used Car Industry Revenue (Million) Forecast, by Application 2019 & 2032
- Table 17: India Used Car Industry Revenue (Million) Forecast, by Application 2019 & 2032
- Table 18: Japan Used Car Industry Revenue (Million) Forecast, by Application 2019 & 2032
- Table 19: South Korea Used Car Industry Revenue (Million) Forecast, by Application 2019 & 2032
- Table 20: Rest of Asia Pacific Used Car Industry Revenue (Million) Forecast, by Application 2019 & 2032
- Table 21: Global Used Car Industry Revenue Million Forecast, by Country 2019 & 2032
- Table 22: Brazil Used Car Industry Revenue (Million) Forecast, by Application 2019 & 2032
- Table 23: United Arab Emirates Used Car Industry Revenue (Million) Forecast, by Application 2019 & 2032
- Table 24: South Africa Used Car Industry Revenue (Million) Forecast, by Application 2019 & 2032
- Table 25: Other Countries Used Car Industry Revenue (Million) Forecast, by Application 2019 & 2032
- Table 26: Global Used Car Industry Revenue Million Forecast, by Vehicle Type 2019 & 2032
- Table 27: Global Used Car Industry Revenue Million Forecast, by Vendor 2019 & 2032
- Table 28: Global Used Car Industry Revenue Million Forecast, by Country 2019 & 2032
- Table 29: United States Used Car Industry Revenue (Million) Forecast, by Application 2019 & 2032
- Table 30: Canada Used Car Industry Revenue (Million) Forecast, by Application 2019 & 2032
- Table 31: Rest of North America Used Car Industry Revenue (Million) Forecast, by Application 2019 & 2032
- Table 32: Global Used Car Industry Revenue Million Forecast, by Vehicle Type 2019 & 2032
- Table 33: Global Used Car Industry Revenue Million Forecast, by Vendor 2019 & 2032
- Table 34: Global Used Car Industry Revenue Million Forecast, by Country 2019 & 2032
- Table 35: Germany Used Car Industry Revenue (Million) Forecast, by Application 2019 & 2032
- Table 36: United Kingdom Used Car Industry Revenue (Million) Forecast, by Application 2019 & 2032
- Table 37: France Used Car Industry Revenue (Million) Forecast, by Application 2019 & 2032
- Table 38: Spain Used Car Industry Revenue (Million) Forecast, by Application 2019 & 2032
- Table 39: Rest of Europe Used Car Industry Revenue (Million) Forecast, by Application 2019 & 2032
- Table 40: Global Used Car Industry Revenue Million Forecast, by Vehicle Type 2019 & 2032
- Table 41: Global Used Car Industry Revenue Million Forecast, by Vendor 2019 & 2032
- Table 42: Global Used Car Industry Revenue Million Forecast, by Country 2019 & 2032
- Table 43: China Used Car Industry Revenue (Million) Forecast, by Application 2019 & 2032
- Table 44: India Used Car Industry Revenue (Million) Forecast, by Application 2019 & 2032
- Table 45: Japan Used Car Industry Revenue (Million) Forecast, by Application 2019 & 2032
- Table 46: South Korea Used Car Industry Revenue (Million) Forecast, by Application 2019 & 2032
- Table 47: Rest of Asia Pacific Used Car Industry Revenue (Million) Forecast, by Application 2019 & 2032
- Table 48: Global Used Car Industry Revenue Million Forecast, by Vehicle Type 2019 & 2032
- Table 49: Global Used Car Industry Revenue Million Forecast, by Vendor 2019 & 2032
- Table 50: Global Used Car Industry Revenue Million Forecast, by Country 2019 & 2032
- Table 51: Brazil Used Car Industry Revenue (Million) Forecast, by Application 2019 & 2032
- Table 52: United Arab Emirates Used Car Industry Revenue (Million) Forecast, by Application 2019 & 2032
- Table 53: South Africa Used Car Industry Revenue (Million) Forecast, by Application 2019 & 2032
- Table 54: Other Countries Used Car Industry Revenue (Million) Forecast, by Application 2019 & 2032
Frequently Asked Questions
1. What is the projected Compound Annual Growth Rate (CAGR) of the Used Car Industry?
The projected CAGR is approximately 10.00%.
2. Which companies are prominent players in the Used Car Industry?
Key companies in the market include The Hertz Corporation, Arnold Clark, Cox Automotive, Pendragon PLC, Carro, AutoNation, Asbury Automotive Grou, Mahindra First Choice Wheels, Penske Cars, CarMax Inc, Maruti Suzuki True Value, Emil Frey AG.
3. What are the main segments of the Used Car Industry?
The market segments include Vehicle Type, Vendor.
4. Can you provide details about the market size?
The market size is estimated to be USD XX Million as of 2022.
5. What are some drivers contributing to market growth?
Increasing Demand For Electric School Buses.
6. What are the notable trends driving market growth?
Strengthening of Online Infrastructure Positively Affecting the Used Cars Market.
7. Are there any restraints impacting market growth?
Uncertainty of The Global Pandemic.
8. Can you provide examples of recent developments in the market?
March 2022: TrueCar Inc. launched a new online car-buying marketplace called TrueCar+. TrueCar+ will provide consumers with a more flexible and personalized car buying experience for new and used vehicles.
9. What pricing options are available for accessing the report?
Pricing options include single-user, multi-user, and enterprise licenses priced at USD 4750, USD 5250, and USD 8750 respectively.
10. Is the market size provided in terms of value or volume?
The market size is provided in terms of value, measured in Million.
11. Are there any specific market keywords associated with the report?
Yes, the market keyword associated with the report is "Used Car Industry," which aids in identifying and referencing the specific market segment covered.
12. How do I determine which pricing option suits my needs best?
The pricing options vary based on user requirements and access needs. Individual users may opt for single-user licenses, while businesses requiring broader access may choose multi-user or enterprise licenses for cost-effective access to the report.
13. Are there any additional resources or data provided in the Used Car Industry report?
While the report offers comprehensive insights, it's advisable to review the specific contents or supplementary materials provided to ascertain if additional resources or data are available.
14. How can I stay updated on further developments or reports in the Used Car Industry?
To stay informed about further developments, trends, and reports in the Used Car Industry, consider subscribing to industry newsletters, following relevant companies and organizations, or regularly checking reputable industry news sources and publications.
Methodology
Step 1 - Identification of Relevant Samples Size from Population Database


Step 2 - Approaches for Defining Global Market Size (Value, Volume* & Price*)

Note*: In applicable scenarios
Step 3 - Data Sources
Primary Research
- Web Analytics
- Survey Reports
- Research Institute
- Latest Research Reports
- Opinion Leaders
Secondary Research
- Annual Reports
- White Paper
- Latest Press Release
- Industry Association
- Paid Database
- Investor Presentations

Step 4 - Data Triangulation
Involves using different sources of information in order to increase the validity of a study
These sources are likely to be stakeholders in a program - participants, other researchers, program staff, other community members, and so on.
Then we put all data in single framework & apply various statistical tools to find out the dynamic on the market.
During the analysis stage, feedback from the stakeholder groups would be compared to determine areas of agreement as well as areas of divergence


