
Key Insights
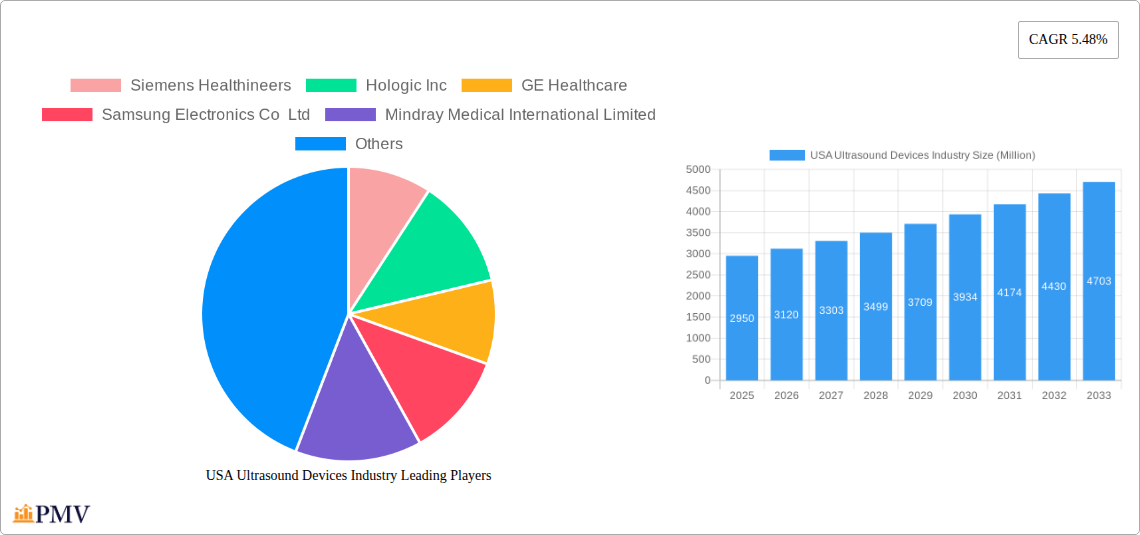
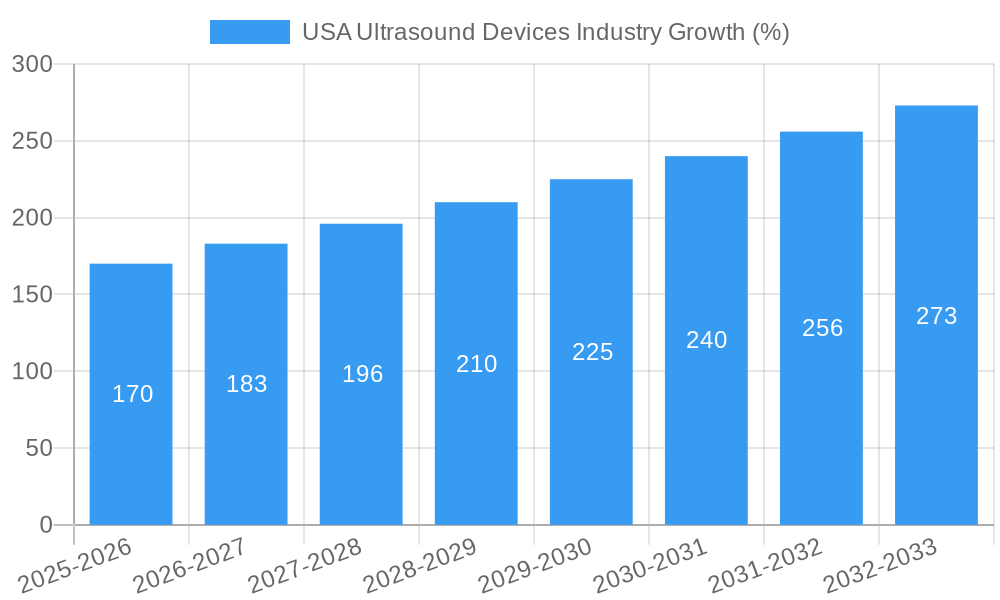
The US ultrasound devices market, valued at $2.95 billion in 2025, is projected to experience robust growth, driven by a rising geriatric population necessitating increased diagnostic imaging, technological advancements in ultrasound imaging (like AI-powered image analysis and portable ultrasound systems), and expanding applications across various medical specialties. The 5.48% CAGR indicates a steady increase in demand throughout the forecast period (2025-2033). Key growth drivers include the increasing prevalence of chronic diseases requiring regular monitoring (e.g., cardiovascular disease), the rising adoption of minimally invasive procedures guided by ultrasound, and a growing preference for cost-effective, non-invasive diagnostic tools. Technological advancements, particularly in 3D/4D imaging and AI-integrated systems, are enhancing diagnostic capabilities and driving market expansion. While regulatory hurdles and high initial investment costs could act as restraints, the overall market outlook remains positive, propelled by the continuous evolution of ultrasound technology and its increasing integration into various healthcare settings.
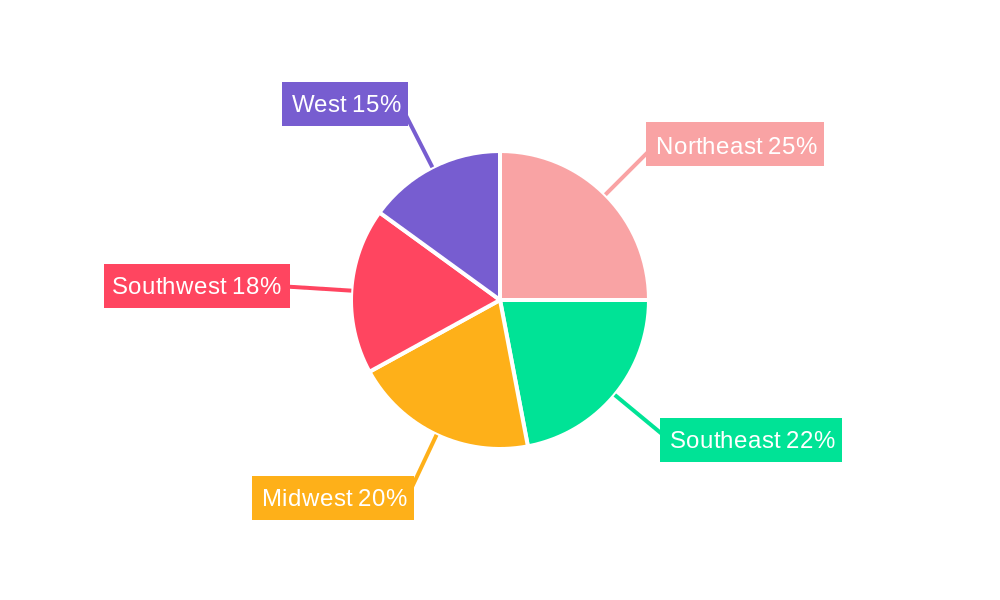
The market segmentation reveals significant opportunities within specific applications. Cardiology and obstetrics/gynecology are major segments, reflecting the widespread use of ultrasound in cardiovascular diagnostics and prenatal care. The growing adoption of portable ultrasound systems is expanding access to point-of-care diagnostics, particularly in rural areas and emergency settings. Key players like Siemens Healthineers, GE Healthcare, and Philips are investing heavily in research and development to innovate and maintain their market leadership, fostering competition and driving further advancements in ultrasound technology. Regional analysis shows strong demand across the United States, with variations in market share across the Northeast, Southeast, Midwest, Southwest, and West, potentially influenced by factors like healthcare infrastructure and population density. Continued innovation and a focus on improving accessibility are likely to shape the future of the US ultrasound devices market.
This comprehensive report provides a detailed analysis of the USA ultrasound devices market, offering invaluable insights for industry stakeholders. Covering the period 2019-2033, with a base year of 2025 and a forecast period of 2025-2033, this report meticulously examines market structure, competitive dynamics, technological advancements, and future growth projections. The report segments the market by application, technology, and device type, providing granular data and analysis for informed decision-making. With a projected market value of xx Million by 2033, this report is an essential resource for understanding this dynamic sector.
USA Ultrasound Devices Industry Market Structure & Competitive Dynamics
The USA ultrasound devices market is characterized by a moderately concentrated landscape with several key players holding significant market share. Key competitors include Siemens Healthineers, Hologic Inc, GE Healthcare, Samsung Electronics Co Ltd, Mindray Medical International Limited, Koninklijke Philips NV, Canon Medical Systems Corporation, Carestream Health Inc, Esaote SpA, and Fujifilm Holdings Corporation. Market share analysis reveals that the top five players collectively account for approximately xx% of the market, indicating a competitive but not overly saturated environment. The industry witnesses continuous innovation, driven by advancements in imaging technologies and increasing demand for portable and advanced ultrasound systems.
The regulatory framework governing the manufacture and sale of ultrasound devices in the USA is stringent, ensuring high quality and safety standards. This robust regulatory environment necessitates significant investments in research and development, and compliance, influencing market dynamics. While some degree of product substitution exists (e.g., MRI for certain applications), ultrasound remains a cost-effective and widely accessible imaging modality. End-user trends, such as an increasing preference for minimally invasive procedures and point-of-care diagnostics, are fueling growth in the portable ultrasound segment. Mergers and acquisitions (M&A) activities are frequent, with deal values exceeding xx Million in recent years, consolidating market share and accelerating technological integration. These M&A activities often focus on expanding product portfolios, strengthening geographical reach, and gaining access to cutting-edge technologies.
USA Ultrasound Devices Industry Industry Trends & Insights
The USA ultrasound devices market demonstrates robust growth, driven primarily by technological advancements, increasing prevalence of chronic diseases requiring diagnostic imaging, and rising healthcare expenditure. The compound annual growth rate (CAGR) during the forecast period (2025-2033) is estimated to be xx%, reflecting strong market momentum. Technological advancements, such as AI-powered image analysis and the development of high-intensity focused ultrasound (HIFU) systems for non-invasive therapy, are creating new market opportunities and driving market penetration. Consumer preferences are shifting towards advanced imaging technologies, including 3D/4D ultrasound and Doppler imaging, leading to increased demand for sophisticated systems. The competitive landscape is highly dynamic, with companies investing heavily in R&D to develop innovative products and expand their market reach. Several factors influence market dynamics, including pricing strategies, technological superiority, and effective distribution networks. The market penetration of portable ultrasound systems is particularly notable, reflecting a growing need for point-of-care diagnostics in various settings.
Dominant Markets & Segments in USA Ultrasound Devices Industry
- Leading Application Segment: Cardiology holds the largest market share within the application segment, driven by high prevalence of cardiovascular diseases and the widespread use of ultrasound for echocardiography.
- Leading Technology Segment: 2D ultrasound imaging remains the dominant technology segment, owing to its cost-effectiveness and widespread availability, but 3D/4D and Doppler imaging are experiencing rapid growth.
- Leading Device Type Segment: Portable ultrasound devices are witnessing significant growth, driven by the increasing demand for point-of-care diagnostics and remote healthcare applications.
Several key drivers contribute to this dominance. For Cardiology, the high prevalence of heart conditions and the routine use of echocardiography in diagnosis and monitoring create a significant demand. In the technology segment, 2D ultrasound’s simplicity and established infrastructure ensure its leading position, though 3D/4D and Doppler technologies are rapidly gaining traction thanks to their enhanced diagnostic capabilities. The portable ultrasound market is driven by factors like improved mobility, cost-effectiveness for smaller healthcare facilities, and its crucial role in immediate patient assessment. These factors highlight the dynamic nature of the market, with traditional segments maintaining prominence while new technologies and applications continually challenge and reshape its structure.
USA Ultrasound Devices Industry Product Innovations
Recent years have witnessed significant advancements in ultrasound technology, encompassing improvements in image quality, portability, and integration with other healthcare IT systems. AI-powered image analysis tools are becoming increasingly common, enabling faster and more accurate diagnoses. The development of portable, handheld ultrasound devices is expanding point-of-care diagnostic capabilities in various settings. These innovations directly address market demands for enhanced diagnostic accuracy, improved efficiency, and accessibility to quality healthcare. The competitive landscape encourages continuous innovation, pushing the boundaries of ultrasound technology to meet the evolving needs of healthcare providers and patients.
Report Segmentation & Scope
This report comprehensively segments the USA ultrasound devices market across several key parameters:
Application: Anesthesiology, Cardiology, Gynecology/Obstetrics, Musculoskeletal, Radiology, Critical Care, Other Applications. Each segment exhibits unique growth trajectories based on specific needs and technological advancements.
Technology: 2D Ultrasound Imaging, 3D and 4D Ultrasound Imaging, Doppler Imaging, High-intensity Focused Ultrasound. Market size and growth vary across these technologies, with 2D still dominant but 3D/4D and Doppler gaining momentum.
Type: Stationary Ultrasound, Portable Ultrasound. Portable ultrasound's growth is exceptionally strong, reflecting changing healthcare priorities and technological improvements. Competitive dynamics differ for each type, with varying price points and target markets.
Key Drivers of USA Ultrasound Devices Industry Growth
Several factors propel the growth of the USA ultrasound devices market. Technological advancements, such as improved image resolution and AI integration, enable more accurate and efficient diagnoses. Rising prevalence of chronic diseases creates increased demand for diagnostic imaging. Favorable reimbursement policies and increasing healthcare spending facilitate market expansion. Furthermore, the growing adoption of minimally invasive procedures further strengthens the demand for ultrasound guidance.
Challenges in the USA Ultrasound Devices Industry Sector
The USA ultrasound devices market faces challenges including stringent regulatory approvals, which extend product development timelines and increase costs. Supply chain disruptions can impact device availability and pricing. Intense competition from established and emerging players necessitates continuous innovation and effective market strategies. Additionally, cost-containment measures within healthcare systems can affect the pricing and adoption of advanced ultrasound technologies. These factors can potentially limit market growth if not effectively addressed.
Leading Players in the USA Ultrasound Devices Industry Market
- Siemens Healthineers
- Hologic Inc
- GE Healthcare
- Samsung Electronics Co Ltd
- Mindray Medical International Limited
- Koninklijke Philips NV
- Canon Medical Systems Corporation
- Carestream Health Inc
- Esaote SpA
- Fujifilm Holdings Corporation
Key Developments in USA Ultrasound Devices Industry Sector
- March 2022: Royal Philips launched Ultrasound Workspace, a vendor-neutral echocardiography solution. This enhances remote access and analysis capabilities, improving workflow efficiency.
- November 2021: GE Healthcare unveiled Vscan Air, a portable ultrasound system designed for point-of-care diagnostics, facilitating faster clinical decision-making.
These developments signify a trend toward improved accessibility, efficiency, and integration of ultrasound technology within healthcare workflows.
Strategic USA Ultrasound Devices Industry Market Outlook
The future of the USA ultrasound devices market appears promising, driven by continuous technological innovation, increasing healthcare expenditure, and the growing prevalence of chronic diseases requiring diagnostic imaging. Strategic opportunities exist in developing AI-powered diagnostic tools, expanding point-of-care applications, and focusing on cost-effective solutions for underserved populations. Continued focus on enhancing image quality, portability, and system integration will further drive market growth and attract new players. The market’s evolution suggests a bright future characterized by advanced technologies and improved healthcare outcomes.
USA Ultrasound Devices Industry Segmentation
-
1. Application
- 1.1. Anesthesiology
- 1.2. Cardiology
- 1.3. Gynecology/Obstetrics
- 1.4. Musculoskeletal
- 1.5. Radiology
- 1.6. Critical Care
- 1.7. Other Applications
-
2. Technology
- 2.1. 2D Ultrasound Imaging
- 2.2. 3D and 4D Ultrasound Imaging
- 2.3. Doppler Imaging
- 2.4. High-intensity Focused Ultrasound
-
3. Type
- 3.1. Stationary Ultrasound
- 3.2. Portable Ultrasound
USA Ultrasound Devices Industry Segmentation By Geography
-
1. North America
- 1.1. United States
- 1.2. Canada
- 1.3. Mexico
-
2. South America
- 2.1. Brazil
- 2.2. Argentina
- 2.3. Rest of South America
-
3. Europe
- 3.1. United Kingdom
- 3.2. Germany
- 3.3. France
- 3.4. Italy
- 3.5. Spain
- 3.6. Russia
- 3.7. Benelux
- 3.8. Nordics
- 3.9. Rest of Europe
-
4. Middle East & Africa
- 4.1. Turkey
- 4.2. Israel
- 4.3. GCC
- 4.4. North Africa
- 4.5. South Africa
- 4.6. Rest of Middle East & Africa
-
5. Asia Pacific
- 5.1. China
- 5.2. India
- 5.3. Japan
- 5.4. South Korea
- 5.5. ASEAN
- 5.6. Oceania
- 5.7. Rest of Asia Pacific
USA Ultrasound Devices Industry REPORT HIGHLIGHTS
| Aspects | Details |
|---|---|
| Study Period | 2019-2033 |
| Base Year | 2024 |
| Estimated Year | 2025 |
| Forecast Period | 2025-2033 |
| Historical Period | 2019-2024 |
| Growth Rate | CAGR of 5.48% from 2019-2033 |
| Segmentation |
|
Table of Contents
- 1. Introduction
- 1.1. Research Scope
- 1.2. Market Segmentation
- 1.3. Research Methodology
- 1.4. Definitions and Assumptions
- 2. Executive Summary
- 2.1. Introduction
- 3. Market Dynamics
- 3.1. Introduction
- 3.2. Market Drivers
- 3.2.1. Technological Advancements; Increasing Incidences of Chronic Diseases
- 3.3. Market Restrains
- 3.3.1. Strict Regulations
- 3.4. Market Trends
- 3.4.1. Anesthesiology is Expected to Witness Rapid Growth
- 4. Market Factor Analysis
- 4.1. Porters Five Forces
- 4.2. Supply/Value Chain
- 4.3. PESTEL analysis
- 4.4. Market Entropy
- 4.5. Patent/Trademark Analysis
- 5. Global USA Ultrasound Devices Industry Analysis, Insights and Forecast, 2019-2031
- 5.1. Market Analysis, Insights and Forecast - by Application
- 5.1.1. Anesthesiology
- 5.1.2. Cardiology
- 5.1.3. Gynecology/Obstetrics
- 5.1.4. Musculoskeletal
- 5.1.5. Radiology
- 5.1.6. Critical Care
- 5.1.7. Other Applications
- 5.2. Market Analysis, Insights and Forecast - by Technology
- 5.2.1. 2D Ultrasound Imaging
- 5.2.2. 3D and 4D Ultrasound Imaging
- 5.2.3. Doppler Imaging
- 5.2.4. High-intensity Focused Ultrasound
- 5.3. Market Analysis, Insights and Forecast - by Type
- 5.3.1. Stationary Ultrasound
- 5.3.2. Portable Ultrasound
- 5.4. Market Analysis, Insights and Forecast - by Region
- 5.4.1. North America
- 5.4.2. South America
- 5.4.3. Europe
- 5.4.4. Middle East & Africa
- 5.4.5. Asia Pacific
- 5.1. Market Analysis, Insights and Forecast - by Application
- 6. North America USA Ultrasound Devices Industry Analysis, Insights and Forecast, 2019-2031
- 6.1. Market Analysis, Insights and Forecast - by Application
- 6.1.1. Anesthesiology
- 6.1.2. Cardiology
- 6.1.3. Gynecology/Obstetrics
- 6.1.4. Musculoskeletal
- 6.1.5. Radiology
- 6.1.6. Critical Care
- 6.1.7. Other Applications
- 6.2. Market Analysis, Insights and Forecast - by Technology
- 6.2.1. 2D Ultrasound Imaging
- 6.2.2. 3D and 4D Ultrasound Imaging
- 6.2.3. Doppler Imaging
- 6.2.4. High-intensity Focused Ultrasound
- 6.3. Market Analysis, Insights and Forecast - by Type
- 6.3.1. Stationary Ultrasound
- 6.3.2. Portable Ultrasound
- 6.1. Market Analysis, Insights and Forecast - by Application
- 7. South America USA Ultrasound Devices Industry Analysis, Insights and Forecast, 2019-2031
- 7.1. Market Analysis, Insights and Forecast - by Application
- 7.1.1. Anesthesiology
- 7.1.2. Cardiology
- 7.1.3. Gynecology/Obstetrics
- 7.1.4. Musculoskeletal
- 7.1.5. Radiology
- 7.1.6. Critical Care
- 7.1.7. Other Applications
- 7.2. Market Analysis, Insights and Forecast - by Technology
- 7.2.1. 2D Ultrasound Imaging
- 7.2.2. 3D and 4D Ultrasound Imaging
- 7.2.3. Doppler Imaging
- 7.2.4. High-intensity Focused Ultrasound
- 7.3. Market Analysis, Insights and Forecast - by Type
- 7.3.1. Stationary Ultrasound
- 7.3.2. Portable Ultrasound
- 7.1. Market Analysis, Insights and Forecast - by Application
- 8. Europe USA Ultrasound Devices Industry Analysis, Insights and Forecast, 2019-2031
- 8.1. Market Analysis, Insights and Forecast - by Application
- 8.1.1. Anesthesiology
- 8.1.2. Cardiology
- 8.1.3. Gynecology/Obstetrics
- 8.1.4. Musculoskeletal
- 8.1.5. Radiology
- 8.1.6. Critical Care
- 8.1.7. Other Applications
- 8.2. Market Analysis, Insights and Forecast - by Technology
- 8.2.1. 2D Ultrasound Imaging
- 8.2.2. 3D and 4D Ultrasound Imaging
- 8.2.3. Doppler Imaging
- 8.2.4. High-intensity Focused Ultrasound
- 8.3. Market Analysis, Insights and Forecast - by Type
- 8.3.1. Stationary Ultrasound
- 8.3.2. Portable Ultrasound
- 8.1. Market Analysis, Insights and Forecast - by Application
- 9. Middle East & Africa USA Ultrasound Devices Industry Analysis, Insights and Forecast, 2019-2031
- 9.1. Market Analysis, Insights and Forecast - by Application
- 9.1.1. Anesthesiology
- 9.1.2. Cardiology
- 9.1.3. Gynecology/Obstetrics
- 9.1.4. Musculoskeletal
- 9.1.5. Radiology
- 9.1.6. Critical Care
- 9.1.7. Other Applications
- 9.2. Market Analysis, Insights and Forecast - by Technology
- 9.2.1. 2D Ultrasound Imaging
- 9.2.2. 3D and 4D Ultrasound Imaging
- 9.2.3. Doppler Imaging
- 9.2.4. High-intensity Focused Ultrasound
- 9.3. Market Analysis, Insights and Forecast - by Type
- 9.3.1. Stationary Ultrasound
- 9.3.2. Portable Ultrasound
- 9.1. Market Analysis, Insights and Forecast - by Application
- 10. Asia Pacific USA Ultrasound Devices Industry Analysis, Insights and Forecast, 2019-2031
- 10.1. Market Analysis, Insights and Forecast - by Application
- 10.1.1. Anesthesiology
- 10.1.2. Cardiology
- 10.1.3. Gynecology/Obstetrics
- 10.1.4. Musculoskeletal
- 10.1.5. Radiology
- 10.1.6. Critical Care
- 10.1.7. Other Applications
- 10.2. Market Analysis, Insights and Forecast - by Technology
- 10.2.1. 2D Ultrasound Imaging
- 10.2.2. 3D and 4D Ultrasound Imaging
- 10.2.3. Doppler Imaging
- 10.2.4. High-intensity Focused Ultrasound
- 10.3. Market Analysis, Insights and Forecast - by Type
- 10.3.1. Stationary Ultrasound
- 10.3.2. Portable Ultrasound
- 10.1. Market Analysis, Insights and Forecast - by Application
- 11. Northeast USA Ultrasound Devices Industry Analysis, Insights and Forecast, 2019-2031
- 12. Southeast USA Ultrasound Devices Industry Analysis, Insights and Forecast, 2019-2031
- 13. Midwest USA Ultrasound Devices Industry Analysis, Insights and Forecast, 2019-2031
- 14. Southwest USA Ultrasound Devices Industry Analysis, Insights and Forecast, 2019-2031
- 15. West USA Ultrasound Devices Industry Analysis, Insights and Forecast, 2019-2031
- 16. Competitive Analysis
- 16.1. Global Market Share Analysis 2024
- 16.2. Company Profiles
- 16.2.1 Siemens Healthineers
- 16.2.1.1. Overview
- 16.2.1.2. Products
- 16.2.1.3. SWOT Analysis
- 16.2.1.4. Recent Developments
- 16.2.1.5. Financials (Based on Availability)
- 16.2.2 Hologic Inc
- 16.2.2.1. Overview
- 16.2.2.2. Products
- 16.2.2.3. SWOT Analysis
- 16.2.2.4. Recent Developments
- 16.2.2.5. Financials (Based on Availability)
- 16.2.3 GE Healthcare
- 16.2.3.1. Overview
- 16.2.3.2. Products
- 16.2.3.3. SWOT Analysis
- 16.2.3.4. Recent Developments
- 16.2.3.5. Financials (Based on Availability)
- 16.2.4 Samsung Electronics Co Ltd
- 16.2.4.1. Overview
- 16.2.4.2. Products
- 16.2.4.3. SWOT Analysis
- 16.2.4.4. Recent Developments
- 16.2.4.5. Financials (Based on Availability)
- 16.2.5 Mindray Medical International Limited
- 16.2.5.1. Overview
- 16.2.5.2. Products
- 16.2.5.3. SWOT Analysis
- 16.2.5.4. Recent Developments
- 16.2.5.5. Financials (Based on Availability)
- 16.2.6 Koninklijke Philips NV
- 16.2.6.1. Overview
- 16.2.6.2. Products
- 16.2.6.3. SWOT Analysis
- 16.2.6.4. Recent Developments
- 16.2.6.5. Financials (Based on Availability)
- 16.2.7 Canon Medical Systems Corporation
- 16.2.7.1. Overview
- 16.2.7.2. Products
- 16.2.7.3. SWOT Analysis
- 16.2.7.4. Recent Developments
- 16.2.7.5. Financials (Based on Availability)
- 16.2.8 Carestream Health Inc
- 16.2.8.1. Overview
- 16.2.8.2. Products
- 16.2.8.3. SWOT Analysis
- 16.2.8.4. Recent Developments
- 16.2.8.5. Financials (Based on Availability)
- 16.2.9 Esaote SpA
- 16.2.9.1. Overview
- 16.2.9.2. Products
- 16.2.9.3. SWOT Analysis
- 16.2.9.4. Recent Developments
- 16.2.9.5. Financials (Based on Availability)
- 16.2.10 Fujifilm Holdings Corporation
- 16.2.10.1. Overview
- 16.2.10.2. Products
- 16.2.10.3. SWOT Analysis
- 16.2.10.4. Recent Developments
- 16.2.10.5. Financials (Based on Availability)
- 16.2.1 Siemens Healthineers
List of Figures
- Figure 1: Global USA Ultrasound Devices Industry Revenue Breakdown (Million, %) by Region 2024 & 2032
- Figure 2: Global USA Ultrasound Devices Industry Volume Breakdown (K Unit, %) by Region 2024 & 2032
- Figure 3: United states USA Ultrasound Devices Industry Revenue (Million), by Country 2024 & 2032
- Figure 4: United states USA Ultrasound Devices Industry Volume (K Unit), by Country 2024 & 2032
- Figure 5: United states USA Ultrasound Devices Industry Revenue Share (%), by Country 2024 & 2032
- Figure 6: United states USA Ultrasound Devices Industry Volume Share (%), by Country 2024 & 2032
- Figure 7: North America USA Ultrasound Devices Industry Revenue (Million), by Application 2024 & 2032
- Figure 8: North America USA Ultrasound Devices Industry Volume (K Unit), by Application 2024 & 2032
- Figure 9: North America USA Ultrasound Devices Industry Revenue Share (%), by Application 2024 & 2032
- Figure 10: North America USA Ultrasound Devices Industry Volume Share (%), by Application 2024 & 2032
- Figure 11: North America USA Ultrasound Devices Industry Revenue (Million), by Technology 2024 & 2032
- Figure 12: North America USA Ultrasound Devices Industry Volume (K Unit), by Technology 2024 & 2032
- Figure 13: North America USA Ultrasound Devices Industry Revenue Share (%), by Technology 2024 & 2032
- Figure 14: North America USA Ultrasound Devices Industry Volume Share (%), by Technology 2024 & 2032
- Figure 15: North America USA Ultrasound Devices Industry Revenue (Million), by Type 2024 & 2032
- Figure 16: North America USA Ultrasound Devices Industry Volume (K Unit), by Type 2024 & 2032
- Figure 17: North America USA Ultrasound Devices Industry Revenue Share (%), by Type 2024 & 2032
- Figure 18: North America USA Ultrasound Devices Industry Volume Share (%), by Type 2024 & 2032
- Figure 19: North America USA Ultrasound Devices Industry Revenue (Million), by Country 2024 & 2032
- Figure 20: North America USA Ultrasound Devices Industry Volume (K Unit), by Country 2024 & 2032
- Figure 21: North America USA Ultrasound Devices Industry Revenue Share (%), by Country 2024 & 2032
- Figure 22: North America USA Ultrasound Devices Industry Volume Share (%), by Country 2024 & 2032
- Figure 23: South America USA Ultrasound Devices Industry Revenue (Million), by Application 2024 & 2032
- Figure 24: South America USA Ultrasound Devices Industry Volume (K Unit), by Application 2024 & 2032
- Figure 25: South America USA Ultrasound Devices Industry Revenue Share (%), by Application 2024 & 2032
- Figure 26: South America USA Ultrasound Devices Industry Volume Share (%), by Application 2024 & 2032
- Figure 27: South America USA Ultrasound Devices Industry Revenue (Million), by Technology 2024 & 2032
- Figure 28: South America USA Ultrasound Devices Industry Volume (K Unit), by Technology 2024 & 2032
- Figure 29: South America USA Ultrasound Devices Industry Revenue Share (%), by Technology 2024 & 2032
- Figure 30: South America USA Ultrasound Devices Industry Volume Share (%), by Technology 2024 & 2032
- Figure 31: South America USA Ultrasound Devices Industry Revenue (Million), by Type 2024 & 2032
- Figure 32: South America USA Ultrasound Devices Industry Volume (K Unit), by Type 2024 & 2032
- Figure 33: South America USA Ultrasound Devices Industry Revenue Share (%), by Type 2024 & 2032
- Figure 34: South America USA Ultrasound Devices Industry Volume Share (%), by Type 2024 & 2032
- Figure 35: South America USA Ultrasound Devices Industry Revenue (Million), by Country 2024 & 2032
- Figure 36: South America USA Ultrasound Devices Industry Volume (K Unit), by Country 2024 & 2032
- Figure 37: South America USA Ultrasound Devices Industry Revenue Share (%), by Country 2024 & 2032
- Figure 38: South America USA Ultrasound Devices Industry Volume Share (%), by Country 2024 & 2032
- Figure 39: Europe USA Ultrasound Devices Industry Revenue (Million), by Application 2024 & 2032
- Figure 40: Europe USA Ultrasound Devices Industry Volume (K Unit), by Application 2024 & 2032
- Figure 41: Europe USA Ultrasound Devices Industry Revenue Share (%), by Application 2024 & 2032
- Figure 42: Europe USA Ultrasound Devices Industry Volume Share (%), by Application 2024 & 2032
- Figure 43: Europe USA Ultrasound Devices Industry Revenue (Million), by Technology 2024 & 2032
- Figure 44: Europe USA Ultrasound Devices Industry Volume (K Unit), by Technology 2024 & 2032
- Figure 45: Europe USA Ultrasound Devices Industry Revenue Share (%), by Technology 2024 & 2032
- Figure 46: Europe USA Ultrasound Devices Industry Volume Share (%), by Technology 2024 & 2032
- Figure 47: Europe USA Ultrasound Devices Industry Revenue (Million), by Type 2024 & 2032
- Figure 48: Europe USA Ultrasound Devices Industry Volume (K Unit), by Type 2024 & 2032
- Figure 49: Europe USA Ultrasound Devices Industry Revenue Share (%), by Type 2024 & 2032
- Figure 50: Europe USA Ultrasound Devices Industry Volume Share (%), by Type 2024 & 2032
- Figure 51: Europe USA Ultrasound Devices Industry Revenue (Million), by Country 2024 & 2032
- Figure 52: Europe USA Ultrasound Devices Industry Volume (K Unit), by Country 2024 & 2032
- Figure 53: Europe USA Ultrasound Devices Industry Revenue Share (%), by Country 2024 & 2032
- Figure 54: Europe USA Ultrasound Devices Industry Volume Share (%), by Country 2024 & 2032
- Figure 55: Middle East & Africa USA Ultrasound Devices Industry Revenue (Million), by Application 2024 & 2032
- Figure 56: Middle East & Africa USA Ultrasound Devices Industry Volume (K Unit), by Application 2024 & 2032
- Figure 57: Middle East & Africa USA Ultrasound Devices Industry Revenue Share (%), by Application 2024 & 2032
- Figure 58: Middle East & Africa USA Ultrasound Devices Industry Volume Share (%), by Application 2024 & 2032
- Figure 59: Middle East & Africa USA Ultrasound Devices Industry Revenue (Million), by Technology 2024 & 2032
- Figure 60: Middle East & Africa USA Ultrasound Devices Industry Volume (K Unit), by Technology 2024 & 2032
- Figure 61: Middle East & Africa USA Ultrasound Devices Industry Revenue Share (%), by Technology 2024 & 2032
- Figure 62: Middle East & Africa USA Ultrasound Devices Industry Volume Share (%), by Technology 2024 & 2032
- Figure 63: Middle East & Africa USA Ultrasound Devices Industry Revenue (Million), by Type 2024 & 2032
- Figure 64: Middle East & Africa USA Ultrasound Devices Industry Volume (K Unit), by Type 2024 & 2032
- Figure 65: Middle East & Africa USA Ultrasound Devices Industry Revenue Share (%), by Type 2024 & 2032
- Figure 66: Middle East & Africa USA Ultrasound Devices Industry Volume Share (%), by Type 2024 & 2032
- Figure 67: Middle East & Africa USA Ultrasound Devices Industry Revenue (Million), by Country 2024 & 2032
- Figure 68: Middle East & Africa USA Ultrasound Devices Industry Volume (K Unit), by Country 2024 & 2032
- Figure 69: Middle East & Africa USA Ultrasound Devices Industry Revenue Share (%), by Country 2024 & 2032
- Figure 70: Middle East & Africa USA Ultrasound Devices Industry Volume Share (%), by Country 2024 & 2032
- Figure 71: Asia Pacific USA Ultrasound Devices Industry Revenue (Million), by Application 2024 & 2032
- Figure 72: Asia Pacific USA Ultrasound Devices Industry Volume (K Unit), by Application 2024 & 2032
- Figure 73: Asia Pacific USA Ultrasound Devices Industry Revenue Share (%), by Application 2024 & 2032
- Figure 74: Asia Pacific USA Ultrasound Devices Industry Volume Share (%), by Application 2024 & 2032
- Figure 75: Asia Pacific USA Ultrasound Devices Industry Revenue (Million), by Technology 2024 & 2032
- Figure 76: Asia Pacific USA Ultrasound Devices Industry Volume (K Unit), by Technology 2024 & 2032
- Figure 77: Asia Pacific USA Ultrasound Devices Industry Revenue Share (%), by Technology 2024 & 2032
- Figure 78: Asia Pacific USA Ultrasound Devices Industry Volume Share (%), by Technology 2024 & 2032
- Figure 79: Asia Pacific USA Ultrasound Devices Industry Revenue (Million), by Type 2024 & 2032
- Figure 80: Asia Pacific USA Ultrasound Devices Industry Volume (K Unit), by Type 2024 & 2032
- Figure 81: Asia Pacific USA Ultrasound Devices Industry Revenue Share (%), by Type 2024 & 2032
- Figure 82: Asia Pacific USA Ultrasound Devices Industry Volume Share (%), by Type 2024 & 2032
- Figure 83: Asia Pacific USA Ultrasound Devices Industry Revenue (Million), by Country 2024 & 2032
- Figure 84: Asia Pacific USA Ultrasound Devices Industry Volume (K Unit), by Country 2024 & 2032
- Figure 85: Asia Pacific USA Ultrasound Devices Industry Revenue Share (%), by Country 2024 & 2032
- Figure 86: Asia Pacific USA Ultrasound Devices Industry Volume Share (%), by Country 2024 & 2032
List of Tables
- Table 1: Global USA Ultrasound Devices Industry Revenue Million Forecast, by Region 2019 & 2032
- Table 2: Global USA Ultrasound Devices Industry Volume K Unit Forecast, by Region 2019 & 2032
- Table 3: Global USA Ultrasound Devices Industry Revenue Million Forecast, by Application 2019 & 2032
- Table 4: Global USA Ultrasound Devices Industry Volume K Unit Forecast, by Application 2019 & 2032
- Table 5: Global USA Ultrasound Devices Industry Revenue Million Forecast, by Technology 2019 & 2032
- Table 6: Global USA Ultrasound Devices Industry Volume K Unit Forecast, by Technology 2019 & 2032
- Table 7: Global USA Ultrasound Devices Industry Revenue Million Forecast, by Type 2019 & 2032
- Table 8: Global USA Ultrasound Devices Industry Volume K Unit Forecast, by Type 2019 & 2032
- Table 9: Global USA Ultrasound Devices Industry Revenue Million Forecast, by Region 2019 & 2032
- Table 10: Global USA Ultrasound Devices Industry Volume K Unit Forecast, by Region 2019 & 2032
- Table 11: Global USA Ultrasound Devices Industry Revenue Million Forecast, by Country 2019 & 2032
- Table 12: Global USA Ultrasound Devices Industry Volume K Unit Forecast, by Country 2019 & 2032
- Table 13: Northeast USA Ultrasound Devices Industry Revenue (Million) Forecast, by Application 2019 & 2032
- Table 14: Northeast USA Ultrasound Devices Industry Volume (K Unit) Forecast, by Application 2019 & 2032
- Table 15: Southeast USA Ultrasound Devices Industry Revenue (Million) Forecast, by Application 2019 & 2032
- Table 16: Southeast USA Ultrasound Devices Industry Volume (K Unit) Forecast, by Application 2019 & 2032
- Table 17: Midwest USA Ultrasound Devices Industry Revenue (Million) Forecast, by Application 2019 & 2032
- Table 18: Midwest USA Ultrasound Devices Industry Volume (K Unit) Forecast, by Application 2019 & 2032
- Table 19: Southwest USA Ultrasound Devices Industry Revenue (Million) Forecast, by Application 2019 & 2032
- Table 20: Southwest USA Ultrasound Devices Industry Volume (K Unit) Forecast, by Application 2019 & 2032
- Table 21: West USA Ultrasound Devices Industry Revenue (Million) Forecast, by Application 2019 & 2032
- Table 22: West USA Ultrasound Devices Industry Volume (K Unit) Forecast, by Application 2019 & 2032
- Table 23: Global USA Ultrasound Devices Industry Revenue Million Forecast, by Application 2019 & 2032
- Table 24: Global USA Ultrasound Devices Industry Volume K Unit Forecast, by Application 2019 & 2032
- Table 25: Global USA Ultrasound Devices Industry Revenue Million Forecast, by Technology 2019 & 2032
- Table 26: Global USA Ultrasound Devices Industry Volume K Unit Forecast, by Technology 2019 & 2032
- Table 27: Global USA Ultrasound Devices Industry Revenue Million Forecast, by Type 2019 & 2032
- Table 28: Global USA Ultrasound Devices Industry Volume K Unit Forecast, by Type 2019 & 2032
- Table 29: Global USA Ultrasound Devices Industry Revenue Million Forecast, by Country 2019 & 2032
- Table 30: Global USA Ultrasound Devices Industry Volume K Unit Forecast, by Country 2019 & 2032
- Table 31: United States USA Ultrasound Devices Industry Revenue (Million) Forecast, by Application 2019 & 2032
- Table 32: United States USA Ultrasound Devices Industry Volume (K Unit) Forecast, by Application 2019 & 2032
- Table 33: Canada USA Ultrasound Devices Industry Revenue (Million) Forecast, by Application 2019 & 2032
- Table 34: Canada USA Ultrasound Devices Industry Volume (K Unit) Forecast, by Application 2019 & 2032
- Table 35: Mexico USA Ultrasound Devices Industry Revenue (Million) Forecast, by Application 2019 & 2032
- Table 36: Mexico USA Ultrasound Devices Industry Volume (K Unit) Forecast, by Application 2019 & 2032
- Table 37: Global USA Ultrasound Devices Industry Revenue Million Forecast, by Application 2019 & 2032
- Table 38: Global USA Ultrasound Devices Industry Volume K Unit Forecast, by Application 2019 & 2032
- Table 39: Global USA Ultrasound Devices Industry Revenue Million Forecast, by Technology 2019 & 2032
- Table 40: Global USA Ultrasound Devices Industry Volume K Unit Forecast, by Technology 2019 & 2032
- Table 41: Global USA Ultrasound Devices Industry Revenue Million Forecast, by Type 2019 & 2032
- Table 42: Global USA Ultrasound Devices Industry Volume K Unit Forecast, by Type 2019 & 2032
- Table 43: Global USA Ultrasound Devices Industry Revenue Million Forecast, by Country 2019 & 2032
- Table 44: Global USA Ultrasound Devices Industry Volume K Unit Forecast, by Country 2019 & 2032
- Table 45: Brazil USA Ultrasound Devices Industry Revenue (Million) Forecast, by Application 2019 & 2032
- Table 46: Brazil USA Ultrasound Devices Industry Volume (K Unit) Forecast, by Application 2019 & 2032
- Table 47: Argentina USA Ultrasound Devices Industry Revenue (Million) Forecast, by Application 2019 & 2032
- Table 48: Argentina USA Ultrasound Devices Industry Volume (K Unit) Forecast, by Application 2019 & 2032
- Table 49: Rest of South America USA Ultrasound Devices Industry Revenue (Million) Forecast, by Application 2019 & 2032
- Table 50: Rest of South America USA Ultrasound Devices Industry Volume (K Unit) Forecast, by Application 2019 & 2032
- Table 51: Global USA Ultrasound Devices Industry Revenue Million Forecast, by Application 2019 & 2032
- Table 52: Global USA Ultrasound Devices Industry Volume K Unit Forecast, by Application 2019 & 2032
- Table 53: Global USA Ultrasound Devices Industry Revenue Million Forecast, by Technology 2019 & 2032
- Table 54: Global USA Ultrasound Devices Industry Volume K Unit Forecast, by Technology 2019 & 2032
- Table 55: Global USA Ultrasound Devices Industry Revenue Million Forecast, by Type 2019 & 2032
- Table 56: Global USA Ultrasound Devices Industry Volume K Unit Forecast, by Type 2019 & 2032
- Table 57: Global USA Ultrasound Devices Industry Revenue Million Forecast, by Country 2019 & 2032
- Table 58: Global USA Ultrasound Devices Industry Volume K Unit Forecast, by Country 2019 & 2032
- Table 59: United Kingdom USA Ultrasound Devices Industry Revenue (Million) Forecast, by Application 2019 & 2032
- Table 60: United Kingdom USA Ultrasound Devices Industry Volume (K Unit) Forecast, by Application 2019 & 2032
- Table 61: Germany USA Ultrasound Devices Industry Revenue (Million) Forecast, by Application 2019 & 2032
- Table 62: Germany USA Ultrasound Devices Industry Volume (K Unit) Forecast, by Application 2019 & 2032
- Table 63: France USA Ultrasound Devices Industry Revenue (Million) Forecast, by Application 2019 & 2032
- Table 64: France USA Ultrasound Devices Industry Volume (K Unit) Forecast, by Application 2019 & 2032
- Table 65: Italy USA Ultrasound Devices Industry Revenue (Million) Forecast, by Application 2019 & 2032
- Table 66: Italy USA Ultrasound Devices Industry Volume (K Unit) Forecast, by Application 2019 & 2032
- Table 67: Spain USA Ultrasound Devices Industry Revenue (Million) Forecast, by Application 2019 & 2032
- Table 68: Spain USA Ultrasound Devices Industry Volume (K Unit) Forecast, by Application 2019 & 2032
- Table 69: Russia USA Ultrasound Devices Industry Revenue (Million) Forecast, by Application 2019 & 2032
- Table 70: Russia USA Ultrasound Devices Industry Volume (K Unit) Forecast, by Application 2019 & 2032
- Table 71: Benelux USA Ultrasound Devices Industry Revenue (Million) Forecast, by Application 2019 & 2032
- Table 72: Benelux USA Ultrasound Devices Industry Volume (K Unit) Forecast, by Application 2019 & 2032
- Table 73: Nordics USA Ultrasound Devices Industry Revenue (Million) Forecast, by Application 2019 & 2032
- Table 74: Nordics USA Ultrasound Devices Industry Volume (K Unit) Forecast, by Application 2019 & 2032
- Table 75: Rest of Europe USA Ultrasound Devices Industry Revenue (Million) Forecast, by Application 2019 & 2032
- Table 76: Rest of Europe USA Ultrasound Devices Industry Volume (K Unit) Forecast, by Application 2019 & 2032
- Table 77: Global USA Ultrasound Devices Industry Revenue Million Forecast, by Application 2019 & 2032
- Table 78: Global USA Ultrasound Devices Industry Volume K Unit Forecast, by Application 2019 & 2032
- Table 79: Global USA Ultrasound Devices Industry Revenue Million Forecast, by Technology 2019 & 2032
- Table 80: Global USA Ultrasound Devices Industry Volume K Unit Forecast, by Technology 2019 & 2032
- Table 81: Global USA Ultrasound Devices Industry Revenue Million Forecast, by Type 2019 & 2032
- Table 82: Global USA Ultrasound Devices Industry Volume K Unit Forecast, by Type 2019 & 2032
- Table 83: Global USA Ultrasound Devices Industry Revenue Million Forecast, by Country 2019 & 2032
- Table 84: Global USA Ultrasound Devices Industry Volume K Unit Forecast, by Country 2019 & 2032
- Table 85: Turkey USA Ultrasound Devices Industry Revenue (Million) Forecast, by Application 2019 & 2032
- Table 86: Turkey USA Ultrasound Devices Industry Volume (K Unit) Forecast, by Application 2019 & 2032
- Table 87: Israel USA Ultrasound Devices Industry Revenue (Million) Forecast, by Application 2019 & 2032
- Table 88: Israel USA Ultrasound Devices Industry Volume (K Unit) Forecast, by Application 2019 & 2032
- Table 89: GCC USA Ultrasound Devices Industry Revenue (Million) Forecast, by Application 2019 & 2032
- Table 90: GCC USA Ultrasound Devices Industry Volume (K Unit) Forecast, by Application 2019 & 2032
- Table 91: North Africa USA Ultrasound Devices Industry Revenue (Million) Forecast, by Application 2019 & 2032
- Table 92: North Africa USA Ultrasound Devices Industry Volume (K Unit) Forecast, by Application 2019 & 2032
- Table 93: South Africa USA Ultrasound Devices Industry Revenue (Million) Forecast, by Application 2019 & 2032
- Table 94: South Africa USA Ultrasound Devices Industry Volume (K Unit) Forecast, by Application 2019 & 2032
- Table 95: Rest of Middle East & Africa USA Ultrasound Devices Industry Revenue (Million) Forecast, by Application 2019 & 2032
- Table 96: Rest of Middle East & Africa USA Ultrasound Devices Industry Volume (K Unit) Forecast, by Application 2019 & 2032
- Table 97: Global USA Ultrasound Devices Industry Revenue Million Forecast, by Application 2019 & 2032
- Table 98: Global USA Ultrasound Devices Industry Volume K Unit Forecast, by Application 2019 & 2032
- Table 99: Global USA Ultrasound Devices Industry Revenue Million Forecast, by Technology 2019 & 2032
- Table 100: Global USA Ultrasound Devices Industry Volume K Unit Forecast, by Technology 2019 & 2032
- Table 101: Global USA Ultrasound Devices Industry Revenue Million Forecast, by Type 2019 & 2032
- Table 102: Global USA Ultrasound Devices Industry Volume K Unit Forecast, by Type 2019 & 2032
- Table 103: Global USA Ultrasound Devices Industry Revenue Million Forecast, by Country 2019 & 2032
- Table 104: Global USA Ultrasound Devices Industry Volume K Unit Forecast, by Country 2019 & 2032
- Table 105: China USA Ultrasound Devices Industry Revenue (Million) Forecast, by Application 2019 & 2032
- Table 106: China USA Ultrasound Devices Industry Volume (K Unit) Forecast, by Application 2019 & 2032
- Table 107: India USA Ultrasound Devices Industry Revenue (Million) Forecast, by Application 2019 & 2032
- Table 108: India USA Ultrasound Devices Industry Volume (K Unit) Forecast, by Application 2019 & 2032
- Table 109: Japan USA Ultrasound Devices Industry Revenue (Million) Forecast, by Application 2019 & 2032
- Table 110: Japan USA Ultrasound Devices Industry Volume (K Unit) Forecast, by Application 2019 & 2032
- Table 111: South Korea USA Ultrasound Devices Industry Revenue (Million) Forecast, by Application 2019 & 2032
- Table 112: South Korea USA Ultrasound Devices Industry Volume (K Unit) Forecast, by Application 2019 & 2032
- Table 113: ASEAN USA Ultrasound Devices Industry Revenue (Million) Forecast, by Application 2019 & 2032
- Table 114: ASEAN USA Ultrasound Devices Industry Volume (K Unit) Forecast, by Application 2019 & 2032
- Table 115: Oceania USA Ultrasound Devices Industry Revenue (Million) Forecast, by Application 2019 & 2032
- Table 116: Oceania USA Ultrasound Devices Industry Volume (K Unit) Forecast, by Application 2019 & 2032
- Table 117: Rest of Asia Pacific USA Ultrasound Devices Industry Revenue (Million) Forecast, by Application 2019 & 2032
- Table 118: Rest of Asia Pacific USA Ultrasound Devices Industry Volume (K Unit) Forecast, by Application 2019 & 2032
Frequently Asked Questions
1. What is the projected Compound Annual Growth Rate (CAGR) of the USA Ultrasound Devices Industry?
The projected CAGR is approximately 5.48%.
2. Which companies are prominent players in the USA Ultrasound Devices Industry?
Key companies in the market include Siemens Healthineers, Hologic Inc, GE Healthcare, Samsung Electronics Co Ltd, Mindray Medical International Limited, Koninklijke Philips NV, Canon Medical Systems Corporation, Carestream Health Inc, Esaote SpA, Fujifilm Holdings Corporation.
3. What are the main segments of the USA Ultrasound Devices Industry?
The market segments include Application, Technology, Type.
4. Can you provide details about the market size?
The market size is estimated to be USD 2.95 Million as of 2022.
5. What are some drivers contributing to market growth?
Technological Advancements; Increasing Incidences of Chronic Diseases.
6. What are the notable trends driving market growth?
Anesthesiology is Expected to Witness Rapid Growth.
7. Are there any restraints impacting market growth?
Strict Regulations.
8. Can you provide examples of recent developments in the market?
In March 2022, Royal Philips, a global leader in health technology, announced the launch of Ultrasound Workspace at the American College of Cardiology's Annual Scientific Session & Expo (ACC 2022). This workspace is an vendor-neutral echocardiography image analysis and reporting solution that can be accessed remotely via a browser.
9. What pricing options are available for accessing the report?
Pricing options include single-user, multi-user, and enterprise licenses priced at USD 3800, USD 4500, and USD 5800 respectively.
10. Is the market size provided in terms of value or volume?
The market size is provided in terms of value, measured in Million and volume, measured in K Unit.
11. Are there any specific market keywords associated with the report?
Yes, the market keyword associated with the report is "USA Ultrasound Devices Industry," which aids in identifying and referencing the specific market segment covered.
12. How do I determine which pricing option suits my needs best?
The pricing options vary based on user requirements and access needs. Individual users may opt for single-user licenses, while businesses requiring broader access may choose multi-user or enterprise licenses for cost-effective access to the report.
13. Are there any additional resources or data provided in the USA Ultrasound Devices Industry report?
While the report offers comprehensive insights, it's advisable to review the specific contents or supplementary materials provided to ascertain if additional resources or data are available.
14. How can I stay updated on further developments or reports in the USA Ultrasound Devices Industry?
To stay informed about further developments, trends, and reports in the USA Ultrasound Devices Industry, consider subscribing to industry newsletters, following relevant companies and organizations, or regularly checking reputable industry news sources and publications.
Methodology
Step 1 - Identification of Relevant Samples Size from Population Database


Step 2 - Approaches for Defining Global Market Size (Value, Volume* & Price*)

Note*: In applicable scenarios
Step 3 - Data Sources
Primary Research
- Web Analytics
- Survey Reports
- Research Institute
- Latest Research Reports
- Opinion Leaders
Secondary Research
- Annual Reports
- White Paper
- Latest Press Release
- Industry Association
- Paid Database
- Investor Presentations

Step 4 - Data Triangulation
Involves using different sources of information in order to increase the validity of a study
These sources are likely to be stakeholders in a program - participants, other researchers, program staff, other community members, and so on.
Then we put all data in single framework & apply various statistical tools to find out the dynamic on the market.
During the analysis stage, feedback from the stakeholder groups would be compared to determine areas of agreement as well as areas of divergence


