
Key Insights
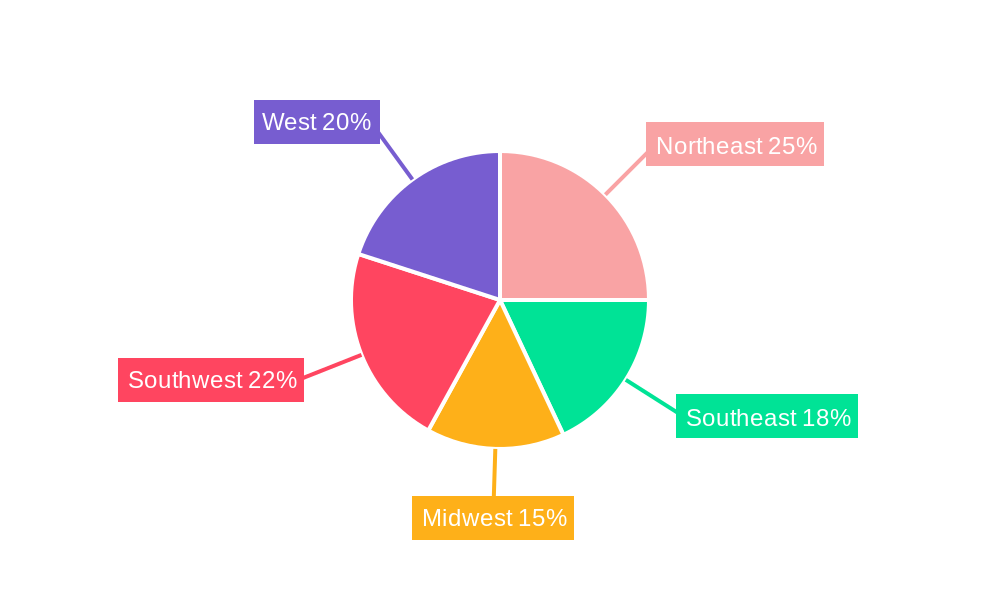
The US autonomous vehicle (AV) market is poised for substantial growth, projected to reach a significant size by 2033. Driven by increasing investments in research and development, advancements in sensor technologies (LIDAR, RADAR, ultrasonic), and a growing demand for enhanced road safety and traffic efficiency, the market is expected to experience robust expansion. The market segmentation reveals a strong emphasis on semi-autonomous vehicles, currently dominating the market share due to their immediate availability and affordability. However, fully autonomous vehicles (Level 4 and 5) are anticipated to witness exponential growth in the coming years, fueled by continuous technological breakthroughs and decreasing costs. The significant presence of major players like Tesla, Waymo, and established automakers like BMW and Honda signifies a competitive landscape with intense innovation. Regional analysis indicates that the West and Northeast regions of the US are likely to lead the market due to higher technological adoption rates and robust infrastructure investments. Regulatory frameworks and public perception of AV safety remain key considerations influencing market expansion.
Despite the optimistic growth trajectory, challenges such as high initial investment costs, ethical concerns surrounding accident liability, and the need for comprehensive infrastructure upgrades remain hurdles. Furthermore, ensuring cybersecurity and data privacy in AV systems is crucial for widespread adoption. The market's success hinges on overcoming these obstacles, while simultaneously fostering collaboration between technology companies, automakers, and policymakers. The integration of AV technology with smart city initiatives and advancements in artificial intelligence (AI) are expected to further accelerate market penetration and drive innovation in the coming decade. The consistent improvement in sensor accuracy and reliability, along with the development of robust software algorithms for decision-making, will significantly impact the market's future growth and overall value.
USA Autonomous Vehicles Market: A Comprehensive Report (2019-2033)
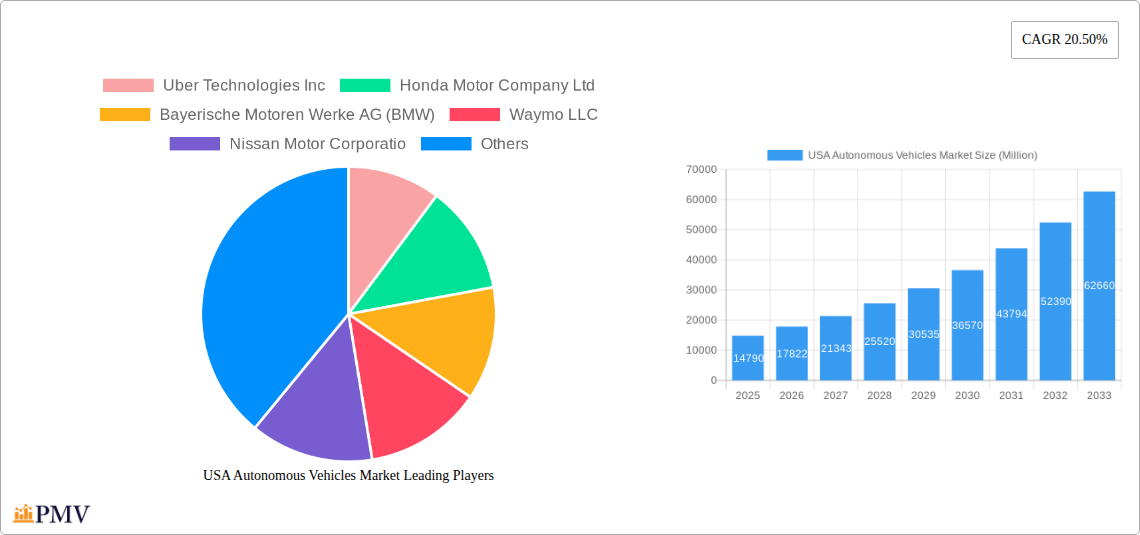
This in-depth report provides a comprehensive analysis of the USA Autonomous Vehicles Market, offering invaluable insights for industry stakeholders, investors, and researchers. The study period spans from 2019 to 2033, with a base year of 2025 and a forecast period from 2025 to 2033. The report leverages extensive data analysis to present a clear picture of market dynamics, technological advancements, and competitive landscapes. Expect detailed breakdowns across key segments including vehicle type (Fully Autonomous, Semi-autonomous), sensor technology (RADAR, LIDAR, Ultrasonic, Other), and level of automation (Level 3, Level 4, Level 5). Leading players like Uber Technologies Inc, Honda Motor Company Ltd, Bayerische Motoren Werke AG (BMW), Waymo LLC, Nissan Motor Corporation, Tesla Inc, Apple Inc, Intel Corporation, and Ford Motor Company are thoroughly analyzed.
USA Autonomous Vehicles Market Market Structure & Competitive Dynamics
The USA autonomous vehicle market exhibits a dynamic competitive landscape characterized by intense innovation and strategic partnerships. Market concentration is currently moderate, with a few dominant players holding significant market share, while numerous startups and established automotive companies contribute to a vibrant ecosystem. Regulatory frameworks, while evolving, play a crucial role in shaping market entry and product development. The increasing demand for safer and more efficient transportation solutions fuels the market growth. The substitute market includes traditional vehicles and public transport systems, but the inherent advantages of autonomous vehicles in terms of safety and efficiency are driving a paradigm shift. End-user trends reveal a growing preference for autonomous features and a willingness to adopt the technology, especially within urban areas. Mergers and acquisitions (M&A) have played a significant role in consolidating the industry, with notable deals exceeding xx Million in value during the historical period (2019-2024). For instance, the estimated market share of Waymo is xx% in 2025. The innovation ecosystem includes research institutions, technology providers, and government agencies which collaborate in developing technological and regulatory standards for the industry.
- Market Concentration: Moderate, with top players holding xx% combined market share in 2025.
- Innovation Ecosystems: Robust, involving collaborations between automotive companies, tech giants, and research institutions.
- Regulatory Frameworks: Evolving, with significant impact on market entry and technological development.
- M&A Activities: Significant activity observed, with deal values exceeding xx Million in the historical period (2019-2024).
USA Autonomous Vehicles Market Industry Trends & Insights
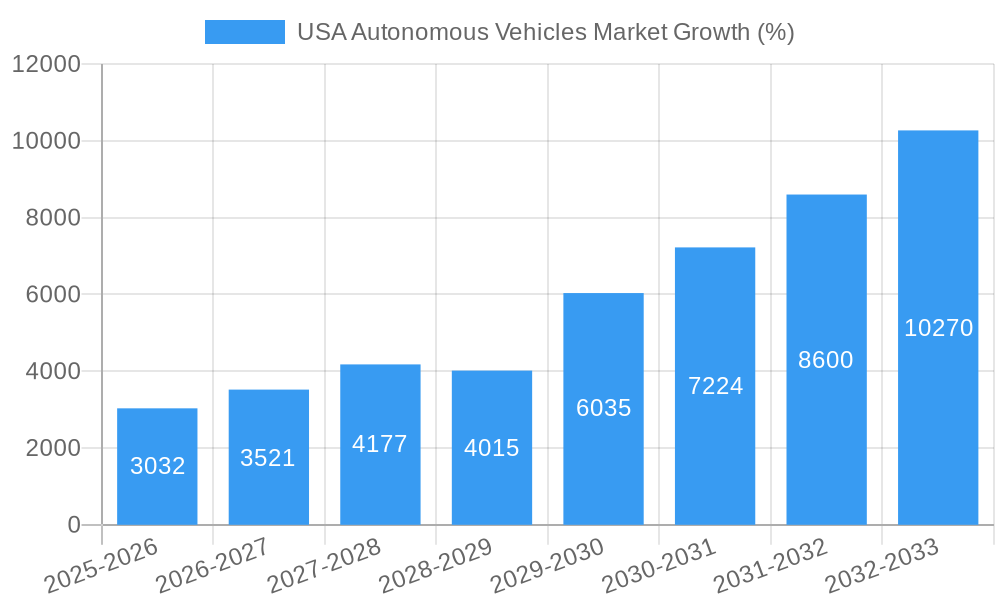
The USA autonomous vehicle market is experiencing exponential growth, driven by technological advancements, shifting consumer preferences, and supportive government initiatives. The market witnessed a Compound Annual Growth Rate (CAGR) of xx% during the historical period (2019-2024), and this trajectory is expected to continue, albeit at a slightly moderated pace in the forecast period (2025-2033). Technological disruptions, particularly in areas such as sensor technology, AI algorithms, and high-definition mapping, are pushing the boundaries of autonomous driving capabilities. Market penetration of autonomous features in vehicles is steadily increasing, fueled by consumer demand for enhanced safety and convenience. The competitive landscape remains fiercely contested, with ongoing investments in R&D and strategic partnerships shaping market dynamics. Consumer preferences lean towards features such as advanced driver-assistance systems (ADAS) and fully autonomous capabilities for specific use cases, such as ride-sharing and long-distance transportation. The predicted market size in 2033 is xx Million.
Dominant Markets & Segments in USA Autonomous Vehicles Market
The dominant segment within the USA autonomous vehicles market in 2025 is projected to be semi-autonomous vehicles due to their wider availability and affordability compared to fully autonomous vehicles. Within sensor technology, LIDAR is the most dominant sensor, given its capability to create detailed 3D maps of the surroundings. High automation (Level 4) is also expected to hold a significant market share in 2025. Several key factors influence the market dominance of these segments:
- Semi-autonomous Vehicles: High demand driven by affordability and availability of features like adaptive cruise control and lane keeping assist.
- LIDAR Sensors: Superior mapping capabilities compared to other sensor technologies.
- High Automation (Level 4): Growing demand in specific applications such as robotaxis and autonomous delivery services.
California and other technology-driven states are currently the leading regions, benefiting from advanced infrastructure, supportive regulatory environments, and the presence of key market players. Factors driving regional dominance include:
- California: Established tech hubs, supportive regulatory environment, and concentration of key industry players.
- Economic Policies: Government incentives and funding for autonomous vehicle development.
- Infrastructure: Investment in smart city initiatives and improved road infrastructure.
USA Autonomous Vehicles Market Product Innovations
Recent product innovations focus on enhancing the safety, reliability, and performance of autonomous vehicles. Advanced sensor fusion techniques, improved AI algorithms, and more robust cybersecurity measures are key trends. The integration of V2X (vehicle-to-everything) communication is also gaining traction, improving the vehicle's awareness of its surroundings. These advancements are directly addressing market demands for increased safety, reduced accidents, and enhanced driving experience, ultimately improving the market fit and competitive advantages for autonomous vehicle manufacturers.
Report Segmentation & Scope
The report provides detailed segmentation across various parameters:
Vehicle Type: Fully Autonomous Vehicles and Semi-autonomous Vehicles, with individual growth projections and market size estimations. Competitive dynamics within each segment are also analyzed.
Sensors: RADAR, LIDAR, Ultrasonic, and Other Sensors. Market share and future projections are provided for each sensor type, considering the performance characteristics and cost-effectiveness.
Level of Automation: Conditional Automation (Level 3), High Automation (Level 4), and Full Automation (Level 5). The report explores the market size, growth potential, and technological challenges associated with each level.
Each segment is examined in detail, including market size forecasts, growth rates, and competitive dynamics to offer a granular understanding of the USA Autonomous Vehicles Market.
Key Drivers of USA Autonomous Vehicles Market Growth
Technological advancements in AI, sensor technology, and mapping are key drivers. Economic factors such as reduced labor costs and increased efficiency from autonomous systems are also contributing. Supportive government regulations and initiatives designed to foster innovation and deployment are driving market expansion. For example, the increasing investment in smart city initiatives is a direct driver for adoption of autonomous vehicles.
Challenges in the USA Autonomous Vehicles Market Sector
Regulatory uncertainty and varying standards across states create significant challenges. Supply chain issues related to specialized components such as sensors and chips can affect production. Cybersecurity risks and ethical concerns around accident liability represent major hurdles for market adoption. The estimated cost associated with these challenges for the forecast period is around xx Million.
Leading Players in the USA Autonomous Vehicles Market Market
- Uber Technologies Inc
- Honda Motor Company Ltd
- Bayerische Motoren Werke AG (BMW)
- Waymo LLC
- Nissan Motor Corporation
- Tesla Inc
- Apple Inc
- Intel Corporation
- Ford Motor Company
Key Developments in USA Autonomous Vehicles Market Sector
- 2023: Waymo expands its autonomous ride-hailing service to additional cities.
- 2022: Tesla introduces advanced driver-assistance features in its latest vehicle models.
- 2021: Several major partnerships are formed between automotive and technology companies for autonomous vehicle development.
- 2020: New regulations regarding autonomous vehicle testing are introduced in several states.
Strategic USA Autonomous Vehicles Market Market Outlook
The future of the USA autonomous vehicle market appears highly promising, with significant growth potential in both fully and semi-autonomous segments. Strategic opportunities exist for companies that can address the technological challenges, navigate the regulatory landscape, and effectively cater to evolving consumer demands. The focus will be on enhancing safety and reliability, improving operational efficiency, and resolving ethical and legal aspects of autonomous driving. This presents promising avenues for growth and investment in this transformative industry.
USA Autonomous Vehicles Market Segmentation
-
1. Type
- 1.1. Fully Autonomous Vehicles
- 1.2. Semi-autonomous Vehicles
-
2. Sensors
- 2.1. Radar
- 2.2. Lidar
- 2.3. Ultrasonic
- 2.4. Other Sensors
-
3. Level of Automation
- 3.1. Conditional Automation (Level 3)
- 3.2. High Automation (Level 4)
- 3.3. Full Automation (Level 5)
USA Autonomous Vehicles Market Segmentation By Geography
-
1. North America
- 1.1. United States
- 1.2. Canada
- 1.3. Mexico
-
2. South America
- 2.1. Brazil
- 2.2. Argentina
- 2.3. Rest of South America
-
3. Europe
- 3.1. United Kingdom
- 3.2. Germany
- 3.3. France
- 3.4. Italy
- 3.5. Spain
- 3.6. Russia
- 3.7. Benelux
- 3.8. Nordics
- 3.9. Rest of Europe
-
4. Middle East & Africa
- 4.1. Turkey
- 4.2. Israel
- 4.3. GCC
- 4.4. North Africa
- 4.5. South Africa
- 4.6. Rest of Middle East & Africa
-
5. Asia Pacific
- 5.1. China
- 5.2. India
- 5.3. Japan
- 5.4. South Korea
- 5.5. ASEAN
- 5.6. Oceania
- 5.7. Rest of Asia Pacific
USA Autonomous Vehicles Market REPORT HIGHLIGHTS
| Aspects | Details |
|---|---|
| Study Period | 2019-2033 |
| Base Year | 2024 |
| Estimated Year | 2025 |
| Forecast Period | 2025-2033 |
| Historical Period | 2019-2024 |
| Growth Rate | CAGR of 20.50% from 2019-2033 |
| Segmentation |
|
Table of Contents
- 1. Introduction
- 1.1. Research Scope
- 1.2. Market Segmentation
- 1.3. Research Methodology
- 1.4. Definitions and Assumptions
- 2. Executive Summary
- 2.1. Introduction
- 3. Market Dynamics
- 3.1. Introduction
- 3.2. Market Drivers
- 3.2.1. Increasing Demand for Electric Vehicles; Others
- 3.3. Market Restrains
- 3.3.1. Product Recalls; Others
- 3.4. Market Trends
- 3.4.1. Growing Adoption of Autonomous Cars to Drive Demand in the Market
- 4. Market Factor Analysis
- 4.1. Porters Five Forces
- 4.2. Supply/Value Chain
- 4.3. PESTEL analysis
- 4.4. Market Entropy
- 4.5. Patent/Trademark Analysis
- 5. Global USA Autonomous Vehicles Market Analysis, Insights and Forecast, 2019-2031
- 5.1. Market Analysis, Insights and Forecast - by Type
- 5.1.1. Fully Autonomous Vehicles
- 5.1.2. Semi-autonomous Vehicles
- 5.2. Market Analysis, Insights and Forecast - by Sensors
- 5.2.1. Radar
- 5.2.2. Lidar
- 5.2.3. Ultrasonic
- 5.2.4. Other Sensors
- 5.3. Market Analysis, Insights and Forecast - by Level of Automation
- 5.3.1. Conditional Automation (Level 3)
- 5.3.2. High Automation (Level 4)
- 5.3.3. Full Automation (Level 5)
- 5.4. Market Analysis, Insights and Forecast - by Region
- 5.4.1. North America
- 5.4.2. South America
- 5.4.3. Europe
- 5.4.4. Middle East & Africa
- 5.4.5. Asia Pacific
- 5.1. Market Analysis, Insights and Forecast - by Type
- 6. North America USA Autonomous Vehicles Market Analysis, Insights and Forecast, 2019-2031
- 6.1. Market Analysis, Insights and Forecast - by Type
- 6.1.1. Fully Autonomous Vehicles
- 6.1.2. Semi-autonomous Vehicles
- 6.2. Market Analysis, Insights and Forecast - by Sensors
- 6.2.1. Radar
- 6.2.2. Lidar
- 6.2.3. Ultrasonic
- 6.2.4. Other Sensors
- 6.3. Market Analysis, Insights and Forecast - by Level of Automation
- 6.3.1. Conditional Automation (Level 3)
- 6.3.2. High Automation (Level 4)
- 6.3.3. Full Automation (Level 5)
- 6.1. Market Analysis, Insights and Forecast - by Type
- 7. South America USA Autonomous Vehicles Market Analysis, Insights and Forecast, 2019-2031
- 7.1. Market Analysis, Insights and Forecast - by Type
- 7.1.1. Fully Autonomous Vehicles
- 7.1.2. Semi-autonomous Vehicles
- 7.2. Market Analysis, Insights and Forecast - by Sensors
- 7.2.1. Radar
- 7.2.2. Lidar
- 7.2.3. Ultrasonic
- 7.2.4. Other Sensors
- 7.3. Market Analysis, Insights and Forecast - by Level of Automation
- 7.3.1. Conditional Automation (Level 3)
- 7.3.2. High Automation (Level 4)
- 7.3.3. Full Automation (Level 5)
- 7.1. Market Analysis, Insights and Forecast - by Type
- 8. Europe USA Autonomous Vehicles Market Analysis, Insights and Forecast, 2019-2031
- 8.1. Market Analysis, Insights and Forecast - by Type
- 8.1.1. Fully Autonomous Vehicles
- 8.1.2. Semi-autonomous Vehicles
- 8.2. Market Analysis, Insights and Forecast - by Sensors
- 8.2.1. Radar
- 8.2.2. Lidar
- 8.2.3. Ultrasonic
- 8.2.4. Other Sensors
- 8.3. Market Analysis, Insights and Forecast - by Level of Automation
- 8.3.1. Conditional Automation (Level 3)
- 8.3.2. High Automation (Level 4)
- 8.3.3. Full Automation (Level 5)
- 8.1. Market Analysis, Insights and Forecast - by Type
- 9. Middle East & Africa USA Autonomous Vehicles Market Analysis, Insights and Forecast, 2019-2031
- 9.1. Market Analysis, Insights and Forecast - by Type
- 9.1.1. Fully Autonomous Vehicles
- 9.1.2. Semi-autonomous Vehicles
- 9.2. Market Analysis, Insights and Forecast - by Sensors
- 9.2.1. Radar
- 9.2.2. Lidar
- 9.2.3. Ultrasonic
- 9.2.4. Other Sensors
- 9.3. Market Analysis, Insights and Forecast - by Level of Automation
- 9.3.1. Conditional Automation (Level 3)
- 9.3.2. High Automation (Level 4)
- 9.3.3. Full Automation (Level 5)
- 9.1. Market Analysis, Insights and Forecast - by Type
- 10. Asia Pacific USA Autonomous Vehicles Market Analysis, Insights and Forecast, 2019-2031
- 10.1. Market Analysis, Insights and Forecast - by Type
- 10.1.1. Fully Autonomous Vehicles
- 10.1.2. Semi-autonomous Vehicles
- 10.2. Market Analysis, Insights and Forecast - by Sensors
- 10.2.1. Radar
- 10.2.2. Lidar
- 10.2.3. Ultrasonic
- 10.2.4. Other Sensors
- 10.3. Market Analysis, Insights and Forecast - by Level of Automation
- 10.3.1. Conditional Automation (Level 3)
- 10.3.2. High Automation (Level 4)
- 10.3.3. Full Automation (Level 5)
- 10.1. Market Analysis, Insights and Forecast - by Type
- 11. Northeast USA Autonomous Vehicles Market Analysis, Insights and Forecast, 2019-2031
- 12. Southeast USA Autonomous Vehicles Market Analysis, Insights and Forecast, 2019-2031
- 13. Midwest USA Autonomous Vehicles Market Analysis, Insights and Forecast, 2019-2031
- 14. Southwest USA Autonomous Vehicles Market Analysis, Insights and Forecast, 2019-2031
- 15. West USA Autonomous Vehicles Market Analysis, Insights and Forecast, 2019-2031
- 16. Competitive Analysis
- 16.1. Global Market Share Analysis 2024
- 16.2. Company Profiles
- 16.2.1 Uber Technologies Inc
- 16.2.1.1. Overview
- 16.2.1.2. Products
- 16.2.1.3. SWOT Analysis
- 16.2.1.4. Recent Developments
- 16.2.1.5. Financials (Based on Availability)
- 16.2.2 Honda Motor Company Ltd
- 16.2.2.1. Overview
- 16.2.2.2. Products
- 16.2.2.3. SWOT Analysis
- 16.2.2.4. Recent Developments
- 16.2.2.5. Financials (Based on Availability)
- 16.2.3 Bayerische Motoren Werke AG (BMW)
- 16.2.3.1. Overview
- 16.2.3.2. Products
- 16.2.3.3. SWOT Analysis
- 16.2.3.4. Recent Developments
- 16.2.3.5. Financials (Based on Availability)
- 16.2.4 Waymo LLC
- 16.2.4.1. Overview
- 16.2.4.2. Products
- 16.2.4.3. SWOT Analysis
- 16.2.4.4. Recent Developments
- 16.2.4.5. Financials (Based on Availability)
- 16.2.5 Nissan Motor Corporatio
- 16.2.5.1. Overview
- 16.2.5.2. Products
- 16.2.5.3. SWOT Analysis
- 16.2.5.4. Recent Developments
- 16.2.5.5. Financials (Based on Availability)
- 16.2.6 Tesla Inc
- 16.2.6.1. Overview
- 16.2.6.2. Products
- 16.2.6.3. SWOT Analysis
- 16.2.6.4. Recent Developments
- 16.2.6.5. Financials (Based on Availability)
- 16.2.7 Apple Inc
- 16.2.7.1. Overview
- 16.2.7.2. Products
- 16.2.7.3. SWOT Analysis
- 16.2.7.4. Recent Developments
- 16.2.7.5. Financials (Based on Availability)
- 16.2.8 Intel Corporation
- 16.2.8.1. Overview
- 16.2.8.2. Products
- 16.2.8.3. SWOT Analysis
- 16.2.8.4. Recent Developments
- 16.2.8.5. Financials (Based on Availability)
- 16.2.9 Ford Motor Company
- 16.2.9.1. Overview
- 16.2.9.2. Products
- 16.2.9.3. SWOT Analysis
- 16.2.9.4. Recent Developments
- 16.2.9.5. Financials (Based on Availability)
- 16.2.1 Uber Technologies Inc
List of Figures
- Figure 1: Global USA Autonomous Vehicles Market Revenue Breakdown (Million, %) by Region 2024 & 2032
- Figure 2: United states USA Autonomous Vehicles Market Revenue (Million), by Country 2024 & 2032
- Figure 3: United states USA Autonomous Vehicles Market Revenue Share (%), by Country 2024 & 2032
- Figure 4: North America USA Autonomous Vehicles Market Revenue (Million), by Type 2024 & 2032
- Figure 5: North America USA Autonomous Vehicles Market Revenue Share (%), by Type 2024 & 2032
- Figure 6: North America USA Autonomous Vehicles Market Revenue (Million), by Sensors 2024 & 2032
- Figure 7: North America USA Autonomous Vehicles Market Revenue Share (%), by Sensors 2024 & 2032
- Figure 8: North America USA Autonomous Vehicles Market Revenue (Million), by Level of Automation 2024 & 2032
- Figure 9: North America USA Autonomous Vehicles Market Revenue Share (%), by Level of Automation 2024 & 2032
- Figure 10: North America USA Autonomous Vehicles Market Revenue (Million), by Country 2024 & 2032
- Figure 11: North America USA Autonomous Vehicles Market Revenue Share (%), by Country 2024 & 2032
- Figure 12: South America USA Autonomous Vehicles Market Revenue (Million), by Type 2024 & 2032
- Figure 13: South America USA Autonomous Vehicles Market Revenue Share (%), by Type 2024 & 2032
- Figure 14: South America USA Autonomous Vehicles Market Revenue (Million), by Sensors 2024 & 2032
- Figure 15: South America USA Autonomous Vehicles Market Revenue Share (%), by Sensors 2024 & 2032
- Figure 16: South America USA Autonomous Vehicles Market Revenue (Million), by Level of Automation 2024 & 2032
- Figure 17: South America USA Autonomous Vehicles Market Revenue Share (%), by Level of Automation 2024 & 2032
- Figure 18: South America USA Autonomous Vehicles Market Revenue (Million), by Country 2024 & 2032
- Figure 19: South America USA Autonomous Vehicles Market Revenue Share (%), by Country 2024 & 2032
- Figure 20: Europe USA Autonomous Vehicles Market Revenue (Million), by Type 2024 & 2032
- Figure 21: Europe USA Autonomous Vehicles Market Revenue Share (%), by Type 2024 & 2032
- Figure 22: Europe USA Autonomous Vehicles Market Revenue (Million), by Sensors 2024 & 2032
- Figure 23: Europe USA Autonomous Vehicles Market Revenue Share (%), by Sensors 2024 & 2032
- Figure 24: Europe USA Autonomous Vehicles Market Revenue (Million), by Level of Automation 2024 & 2032
- Figure 25: Europe USA Autonomous Vehicles Market Revenue Share (%), by Level of Automation 2024 & 2032
- Figure 26: Europe USA Autonomous Vehicles Market Revenue (Million), by Country 2024 & 2032
- Figure 27: Europe USA Autonomous Vehicles Market Revenue Share (%), by Country 2024 & 2032
- Figure 28: Middle East & Africa USA Autonomous Vehicles Market Revenue (Million), by Type 2024 & 2032
- Figure 29: Middle East & Africa USA Autonomous Vehicles Market Revenue Share (%), by Type 2024 & 2032
- Figure 30: Middle East & Africa USA Autonomous Vehicles Market Revenue (Million), by Sensors 2024 & 2032
- Figure 31: Middle East & Africa USA Autonomous Vehicles Market Revenue Share (%), by Sensors 2024 & 2032
- Figure 32: Middle East & Africa USA Autonomous Vehicles Market Revenue (Million), by Level of Automation 2024 & 2032
- Figure 33: Middle East & Africa USA Autonomous Vehicles Market Revenue Share (%), by Level of Automation 2024 & 2032
- Figure 34: Middle East & Africa USA Autonomous Vehicles Market Revenue (Million), by Country 2024 & 2032
- Figure 35: Middle East & Africa USA Autonomous Vehicles Market Revenue Share (%), by Country 2024 & 2032
- Figure 36: Asia Pacific USA Autonomous Vehicles Market Revenue (Million), by Type 2024 & 2032
- Figure 37: Asia Pacific USA Autonomous Vehicles Market Revenue Share (%), by Type 2024 & 2032
- Figure 38: Asia Pacific USA Autonomous Vehicles Market Revenue (Million), by Sensors 2024 & 2032
- Figure 39: Asia Pacific USA Autonomous Vehicles Market Revenue Share (%), by Sensors 2024 & 2032
- Figure 40: Asia Pacific USA Autonomous Vehicles Market Revenue (Million), by Level of Automation 2024 & 2032
- Figure 41: Asia Pacific USA Autonomous Vehicles Market Revenue Share (%), by Level of Automation 2024 & 2032
- Figure 42: Asia Pacific USA Autonomous Vehicles Market Revenue (Million), by Country 2024 & 2032
- Figure 43: Asia Pacific USA Autonomous Vehicles Market Revenue Share (%), by Country 2024 & 2032
List of Tables
- Table 1: Global USA Autonomous Vehicles Market Revenue Million Forecast, by Region 2019 & 2032
- Table 2: Global USA Autonomous Vehicles Market Revenue Million Forecast, by Type 2019 & 2032
- Table 3: Global USA Autonomous Vehicles Market Revenue Million Forecast, by Sensors 2019 & 2032
- Table 4: Global USA Autonomous Vehicles Market Revenue Million Forecast, by Level of Automation 2019 & 2032
- Table 5: Global USA Autonomous Vehicles Market Revenue Million Forecast, by Region 2019 & 2032
- Table 6: Global USA Autonomous Vehicles Market Revenue Million Forecast, by Country 2019 & 2032
- Table 7: Northeast USA Autonomous Vehicles Market Revenue (Million) Forecast, by Application 2019 & 2032
- Table 8: Southeast USA Autonomous Vehicles Market Revenue (Million) Forecast, by Application 2019 & 2032
- Table 9: Midwest USA Autonomous Vehicles Market Revenue (Million) Forecast, by Application 2019 & 2032
- Table 10: Southwest USA Autonomous Vehicles Market Revenue (Million) Forecast, by Application 2019 & 2032
- Table 11: West USA Autonomous Vehicles Market Revenue (Million) Forecast, by Application 2019 & 2032
- Table 12: Global USA Autonomous Vehicles Market Revenue Million Forecast, by Type 2019 & 2032
- Table 13: Global USA Autonomous Vehicles Market Revenue Million Forecast, by Sensors 2019 & 2032
- Table 14: Global USA Autonomous Vehicles Market Revenue Million Forecast, by Level of Automation 2019 & 2032
- Table 15: Global USA Autonomous Vehicles Market Revenue Million Forecast, by Country 2019 & 2032
- Table 16: United States USA Autonomous Vehicles Market Revenue (Million) Forecast, by Application 2019 & 2032
- Table 17: Canada USA Autonomous Vehicles Market Revenue (Million) Forecast, by Application 2019 & 2032
- Table 18: Mexico USA Autonomous Vehicles Market Revenue (Million) Forecast, by Application 2019 & 2032
- Table 19: Global USA Autonomous Vehicles Market Revenue Million Forecast, by Type 2019 & 2032
- Table 20: Global USA Autonomous Vehicles Market Revenue Million Forecast, by Sensors 2019 & 2032
- Table 21: Global USA Autonomous Vehicles Market Revenue Million Forecast, by Level of Automation 2019 & 2032
- Table 22: Global USA Autonomous Vehicles Market Revenue Million Forecast, by Country 2019 & 2032
- Table 23: Brazil USA Autonomous Vehicles Market Revenue (Million) Forecast, by Application 2019 & 2032
- Table 24: Argentina USA Autonomous Vehicles Market Revenue (Million) Forecast, by Application 2019 & 2032
- Table 25: Rest of South America USA Autonomous Vehicles Market Revenue (Million) Forecast, by Application 2019 & 2032
- Table 26: Global USA Autonomous Vehicles Market Revenue Million Forecast, by Type 2019 & 2032
- Table 27: Global USA Autonomous Vehicles Market Revenue Million Forecast, by Sensors 2019 & 2032
- Table 28: Global USA Autonomous Vehicles Market Revenue Million Forecast, by Level of Automation 2019 & 2032
- Table 29: Global USA Autonomous Vehicles Market Revenue Million Forecast, by Country 2019 & 2032
- Table 30: United Kingdom USA Autonomous Vehicles Market Revenue (Million) Forecast, by Application 2019 & 2032
- Table 31: Germany USA Autonomous Vehicles Market Revenue (Million) Forecast, by Application 2019 & 2032
- Table 32: France USA Autonomous Vehicles Market Revenue (Million) Forecast, by Application 2019 & 2032
- Table 33: Italy USA Autonomous Vehicles Market Revenue (Million) Forecast, by Application 2019 & 2032
- Table 34: Spain USA Autonomous Vehicles Market Revenue (Million) Forecast, by Application 2019 & 2032
- Table 35: Russia USA Autonomous Vehicles Market Revenue (Million) Forecast, by Application 2019 & 2032
- Table 36: Benelux USA Autonomous Vehicles Market Revenue (Million) Forecast, by Application 2019 & 2032
- Table 37: Nordics USA Autonomous Vehicles Market Revenue (Million) Forecast, by Application 2019 & 2032
- Table 38: Rest of Europe USA Autonomous Vehicles Market Revenue (Million) Forecast, by Application 2019 & 2032
- Table 39: Global USA Autonomous Vehicles Market Revenue Million Forecast, by Type 2019 & 2032
- Table 40: Global USA Autonomous Vehicles Market Revenue Million Forecast, by Sensors 2019 & 2032
- Table 41: Global USA Autonomous Vehicles Market Revenue Million Forecast, by Level of Automation 2019 & 2032
- Table 42: Global USA Autonomous Vehicles Market Revenue Million Forecast, by Country 2019 & 2032
- Table 43: Turkey USA Autonomous Vehicles Market Revenue (Million) Forecast, by Application 2019 & 2032
- Table 44: Israel USA Autonomous Vehicles Market Revenue (Million) Forecast, by Application 2019 & 2032
- Table 45: GCC USA Autonomous Vehicles Market Revenue (Million) Forecast, by Application 2019 & 2032
- Table 46: North Africa USA Autonomous Vehicles Market Revenue (Million) Forecast, by Application 2019 & 2032
- Table 47: South Africa USA Autonomous Vehicles Market Revenue (Million) Forecast, by Application 2019 & 2032
- Table 48: Rest of Middle East & Africa USA Autonomous Vehicles Market Revenue (Million) Forecast, by Application 2019 & 2032
- Table 49: Global USA Autonomous Vehicles Market Revenue Million Forecast, by Type 2019 & 2032
- Table 50: Global USA Autonomous Vehicles Market Revenue Million Forecast, by Sensors 2019 & 2032
- Table 51: Global USA Autonomous Vehicles Market Revenue Million Forecast, by Level of Automation 2019 & 2032
- Table 52: Global USA Autonomous Vehicles Market Revenue Million Forecast, by Country 2019 & 2032
- Table 53: China USA Autonomous Vehicles Market Revenue (Million) Forecast, by Application 2019 & 2032
- Table 54: India USA Autonomous Vehicles Market Revenue (Million) Forecast, by Application 2019 & 2032
- Table 55: Japan USA Autonomous Vehicles Market Revenue (Million) Forecast, by Application 2019 & 2032
- Table 56: South Korea USA Autonomous Vehicles Market Revenue (Million) Forecast, by Application 2019 & 2032
- Table 57: ASEAN USA Autonomous Vehicles Market Revenue (Million) Forecast, by Application 2019 & 2032
- Table 58: Oceania USA Autonomous Vehicles Market Revenue (Million) Forecast, by Application 2019 & 2032
- Table 59: Rest of Asia Pacific USA Autonomous Vehicles Market Revenue (Million) Forecast, by Application 2019 & 2032
Frequently Asked Questions
1. What is the projected Compound Annual Growth Rate (CAGR) of the USA Autonomous Vehicles Market?
The projected CAGR is approximately 20.50%.
2. Which companies are prominent players in the USA Autonomous Vehicles Market?
Key companies in the market include Uber Technologies Inc, Honda Motor Company Ltd, Bayerische Motoren Werke AG (BMW), Waymo LLC, Nissan Motor Corporatio, Tesla Inc, Apple Inc, Intel Corporation, Ford Motor Company.
3. What are the main segments of the USA Autonomous Vehicles Market?
The market segments include Type, Sensors, Level of Automation.
4. Can you provide details about the market size?
The market size is estimated to be USD 14.79 Million as of 2022.
5. What are some drivers contributing to market growth?
Increasing Demand for Electric Vehicles; Others.
6. What are the notable trends driving market growth?
Growing Adoption of Autonomous Cars to Drive Demand in the Market.
7. Are there any restraints impacting market growth?
Product Recalls; Others.
8. Can you provide examples of recent developments in the market?
N/A
9. What pricing options are available for accessing the report?
Pricing options include single-user, multi-user, and enterprise licenses priced at USD 3800, USD 4500, and USD 5800 respectively.
10. Is the market size provided in terms of value or volume?
The market size is provided in terms of value, measured in Million.
11. Are there any specific market keywords associated with the report?
Yes, the market keyword associated with the report is "USA Autonomous Vehicles Market," which aids in identifying and referencing the specific market segment covered.
12. How do I determine which pricing option suits my needs best?
The pricing options vary based on user requirements and access needs. Individual users may opt for single-user licenses, while businesses requiring broader access may choose multi-user or enterprise licenses for cost-effective access to the report.
13. Are there any additional resources or data provided in the USA Autonomous Vehicles Market report?
While the report offers comprehensive insights, it's advisable to review the specific contents or supplementary materials provided to ascertain if additional resources or data are available.
14. How can I stay updated on further developments or reports in the USA Autonomous Vehicles Market?
To stay informed about further developments, trends, and reports in the USA Autonomous Vehicles Market, consider subscribing to industry newsletters, following relevant companies and organizations, or regularly checking reputable industry news sources and publications.
Methodology
Step 1 - Identification of Relevant Samples Size from Population Database


Step 2 - Approaches for Defining Global Market Size (Value, Volume* & Price*)

Note*: In applicable scenarios
Step 3 - Data Sources
Primary Research
- Web Analytics
- Survey Reports
- Research Institute
- Latest Research Reports
- Opinion Leaders
Secondary Research
- Annual Reports
- White Paper
- Latest Press Release
- Industry Association
- Paid Database
- Investor Presentations

Step 4 - Data Triangulation
Involves using different sources of information in order to increase the validity of a study
These sources are likely to be stakeholders in a program - participants, other researchers, program staff, other community members, and so on.
Then we put all data in single framework & apply various statistical tools to find out the dynamic on the market.
During the analysis stage, feedback from the stakeholder groups would be compared to determine areas of agreement as well as areas of divergence


