
Key Insights
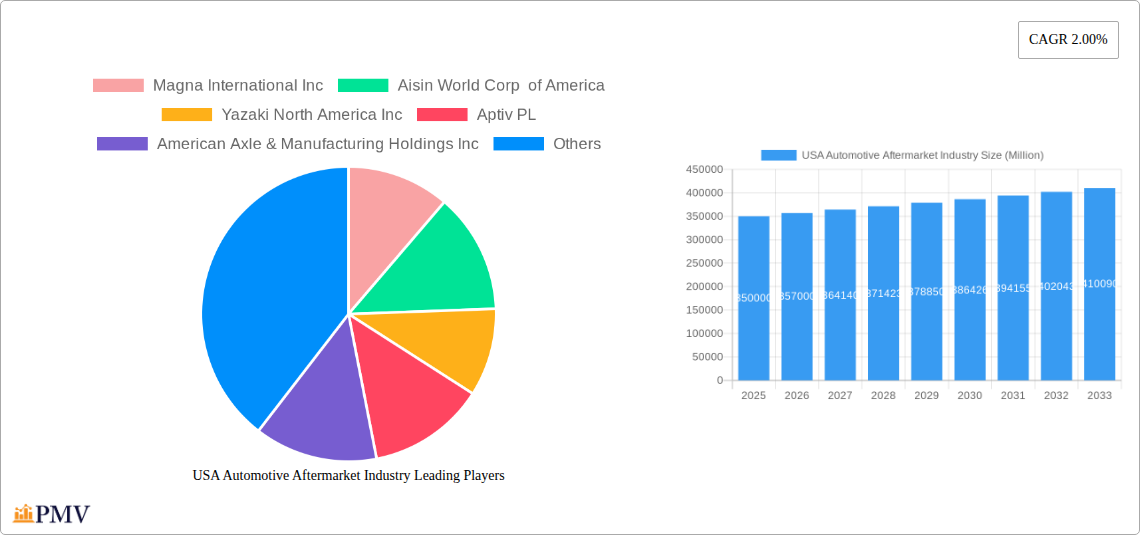
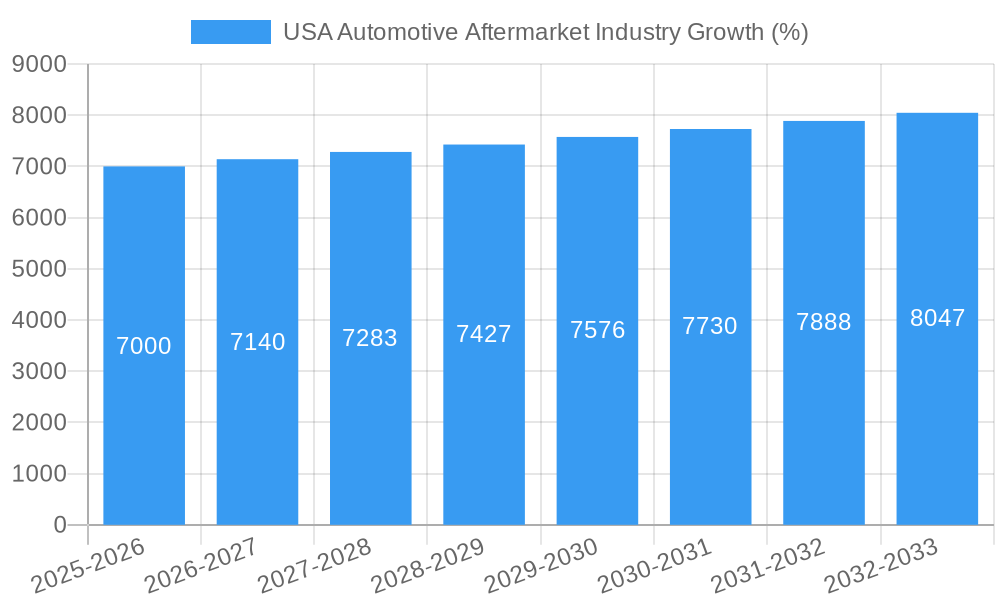
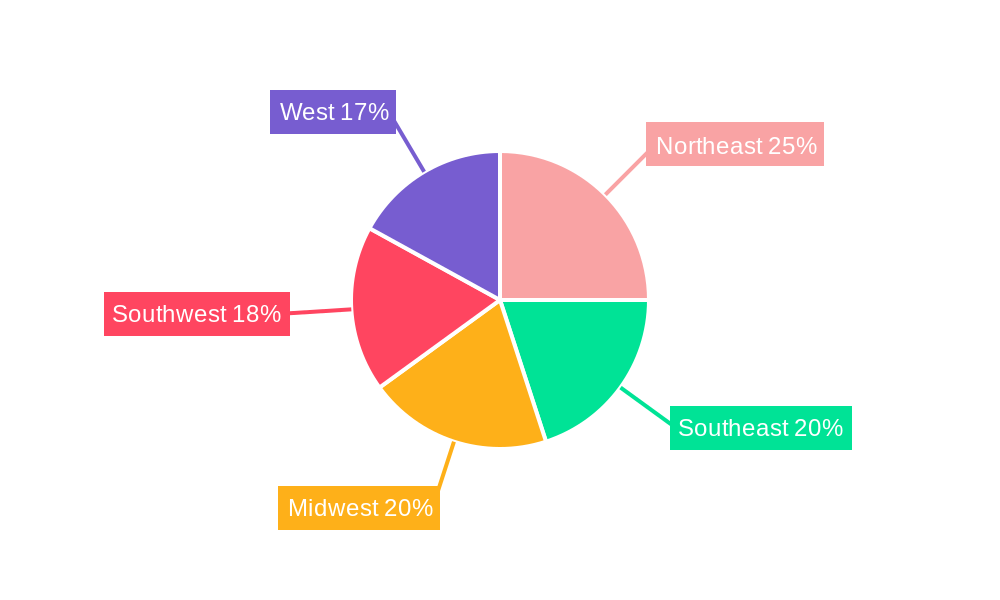
The US automotive aftermarket industry, valued at approximately $350 billion in 2025, is projected to experience steady growth, with a Compound Annual Growth Rate (CAGR) of 2.00% from 2025 to 2033. This growth is driven by several key factors. The aging vehicle fleet in the US necessitates increased repair and replacement of parts, fueling demand across segments like engine components, transmission systems, and interior/exterior accessories. Technological advancements, such as the rise of electric vehicles and advanced driver-assistance systems (ADAS), are creating new aftermarket opportunities for specialized parts and services. Furthermore, the increasing preference for vehicle personalization and customization contributes to the growth of the aftermarket for aesthetic and performance upgrades. The market is segmented by vehicle type (passenger cars and commercial vehicles), application (engine components, transmission, interior, exterior, and other), and sales channels (online and offline). The dominance of offline channels is gradually being challenged by the growing popularity of e-commerce platforms offering convenience and competitive pricing. Leading players such as Magna International, Aisin, Yazaki, and others are leveraging technological innovation and strategic partnerships to capitalize on this expanding market. Geographic variations exist within the US, with regions like the Northeast and West potentially exhibiting higher growth rates due to factors such as higher vehicle density and disposable income. However, competitive pricing pressures and fluctuating raw material costs present challenges to sustained profitability.
The forecast period (2025-2033) anticipates continued expansion, albeit at a moderate pace. The industry’s ability to adapt to evolving consumer preferences, technological changes, and economic fluctuations will be crucial for sustained growth. Successful players will need to focus on enhancing their supply chain efficiency, embracing digital transformation, and providing value-added services to differentiate themselves in a competitive market. This includes offering specialized repair and maintenance services alongside parts sales, expanding online presence, and focusing on customer service excellence. The robust and aging US vehicle parc remains a cornerstone of this steady growth trajectory. Understanding consumer behavior across different vehicle types and preferences will be paramount to success within distinct market segments.
USA Automotive Aftermarket Industry: A Comprehensive Market Report (2019-2033)
This in-depth report provides a comprehensive analysis of the USA automotive aftermarket industry, covering market structure, competitive dynamics, key trends, and future growth prospects. The study period spans from 2019 to 2033, with 2025 serving as the base and estimated year. The report offers actionable insights for industry stakeholders, including manufacturers, suppliers, distributors, and investors. The total market size in 2025 is estimated at xx Million.
USA Automotive Aftermarket Industry Market Structure & Competitive Dynamics
The USA automotive aftermarket industry exhibits a moderately concentrated market structure, with several large multinational corporations holding significant market share. Key players like Magna International Inc, Aisin World Corp of America, and Robert Bosch GmbH compete fiercely, driving innovation and consolidation. The industry's innovation ecosystem is robust, with ongoing investments in advanced technologies such as electric vehicle (EV) components and connected car solutions. Regulatory frameworks, including emissions standards and safety regulations, significantly influence product development and market dynamics. The industry also faces competition from substitute products, such as used parts and repair services offered by independent garages. End-user trends, including the increasing preference for extended vehicle warranties and the rising adoption of DIY car maintenance, influence market demand.
The industry witnessed significant mergers and acquisitions (M&A) activity in recent years. While precise deal values are not publicly available for all transactions, the M&A activity generally reflects a trend of consolidation and expansion within the industry's various segments. For instance, Cummins Inc.'s acquisition of Meritor, Inc., valued at xx Million, reshaped the competitive landscape in the commercial vehicle segment. These strategic acquisitions are driven by the pursuit of economies of scale, technological advancements, and expansion into new markets.
- Market Concentration: Moderately concentrated, with top players holding xx% market share (2025 estimate).
- Innovation Ecosystems: Strong focus on EV components, connected car technologies, and advanced driver-assistance systems (ADAS).
- Regulatory Framework: Stringent emission standards and safety regulations influence product development and market access.
- M&A Activity: Significant consolidation through acquisitions, reflecting strategic expansion and market share gains. Examples include Cummins Inc.’s acquisition of Meritor, Inc.
USA Automotive Aftermarket Industry Industry Trends & Insights
The USA automotive aftermarket industry is experiencing robust growth, driven by several key factors. The increasing age of the vehicle fleet, coupled with rising disposable incomes and consumer preference for vehicle maintenance, fuels demand for replacement parts and repair services. Technological advancements, particularly in the areas of electric vehicles (EVs) and connected car technologies, are transforming the industry, creating new opportunities for innovative products and services. Consumer preferences are shifting towards higher-quality, more durable aftermarket parts, influencing market demand and driving product innovation. The competitive landscape remains dynamic, with both established players and new entrants vying for market share. The industry's Compound Annual Growth Rate (CAGR) from 2025 to 2033 is projected to be xx%, with a market penetration rate of xx% (for a specific segment such as engine components, details will be specified further below) by 2033. These projections are based on several key factors detailed below:
The shift towards electric and hybrid vehicles, while presenting challenges, also creates opportunities for new components and technologies. The increasing adoption of online sales channels, coupled with the rise of e-commerce platforms, is changing the way aftermarket products are bought and sold. Overall, the industry showcases remarkable dynamism characterized by continuous technological improvements, changing consumer preferences, and a very competitive environment, fostering innovation and growth.
Dominant Markets & Segments in USA Automotive Aftermarket Industry
The passenger car segment currently dominates the USA automotive aftermarket industry, accounting for approximately xx% of the total market value in 2025. However, the commercial vehicle segment exhibits higher growth potential, driven by increasing freight transportation and the growing demand for heavy-duty vehicle maintenance.
Key Drivers of Segment Dominance:
- Passenger Cars: Large existing vehicle fleet, high repair and maintenance needs, and a broad consumer base.
- Commercial Vehicles: Growing freight transportation volume, stringent regulatory requirements, and the need for high-durability components.
Application Dominance:
- Engine Components: This segment holds the largest share due to frequent engine wear and tear, particularly in older vehicles.
- Interior: Rising consumer preference for customized interiors fuels growth in this application.
- Exterior: Demand for aesthetics and collision repair supports growth within this segment.
Sales Channel Dominance:
- Offline: Traditional brick-and-mortar auto parts stores and repair shops still hold a significant share.
- Online: The online channel is growing rapidly, fueled by increased consumer preference for online shopping and convenient purchasing.
USA Automotive Aftermarket Industry Product Innovations
Recent product innovations focus on extending the lifespan of vehicles, particularly in the EV market. New materials and manufacturing processes are improving the durability and efficiency of aftermarket components. The integration of smart technologies, such as sensors and data analytics, enhances the performance and reliability of aftermarket products. These innovations cater to consumer demands for improved fuel efficiency, enhanced safety features, and reduced maintenance costs.
Report Segmentation & Scope
This report segments the USA automotive aftermarket industry by vehicle type (passenger cars and commercial vehicles), application (engine components, transmission, interior, exterior, and other applications), and sales channel (online and offline). Each segment is analyzed based on its historical performance, current market size (2025), and growth projections (2025-2033). The report also analyzes the competitive dynamics within each segment, including market share distribution and key players' strategies. The projected CAGR for each segment varies depending on several factors, but overall indicates a steady growth within the industry.
Key Drivers of USA Automotive Aftermarket Industry Growth
Several key factors fuel growth in this market:
- Aging Vehicle Fleet: A large number of vehicles requiring frequent repairs and replacements drives demand for aftermarket parts.
- Rising Consumer Spending: Disposable incomes and consumer confidence influence demand for vehicle maintenance and upgrades.
- Technological Advancements: Innovations in EV components and connected car technologies create new opportunities.
- Government Regulations: Stringent safety and emissions standards stimulate demand for specific aftermarket components.
Challenges in the USA Automotive Aftermarket Industry Sector
Significant challenges hinder industry growth:
- Supply Chain Disruptions: Global supply chain bottlenecks lead to increased costs and delays in component delivery. The impact is estimated at xx Million in lost revenue in 2024 (estimated).
- Increased Competition: The market faces intensifying competition from both established and new players, pressuring margins and profitability.
- Economic Fluctuations: Economic downturns impact consumer spending on vehicle maintenance and repairs. The predicted impact on market growth in a recession scenario is estimated at a xx% decrease (estimated).
Leading Players in the USA Automotive Aftermarket Industry Market
- Magna International Inc
- Aisin World Corp of America
- Yazaki North America Inc
- Aptiv PL
- American Axle & Manufacturing Holdings Inc
- Panasonic Automotive Systems Company of America
- Continental AG
- Flex-N-Gate Corporation
- Robert Bosch GmbH
- Lear Corporation
- Faurecia
- DENSO Corporation
- Adient PLC
- ZF Friedrichshafen AG
Key Developments in USA Automotive Aftermarket Industry Sector
- December 2022: BorgWarner Inc. announced plans to spin off its Fuel Systems and Aftermarket businesses, aiming to capitalize on growth in GDI and hydrogen injection systems. This strategic move positions BorgWarner to better address the evolving demands of the automotive industry, particularly in the shift towards electric vehicles.
- August 2022: Cummins Inc. completed its acquisition of Meritor, Inc., strengthening its position as a leading integrated powertrain solutions provider, expanding its presence in the commercial vehicle aftermarket. This acquisition signals a significant shift in the industry landscape and facilitates the company's expansion in the electric powertrain sector.
- June 2022: Meritor, Inc. launched the ProTec Independent Front Suspension (IFS) for motorcoaches, enhancing its product portfolio and targeting the specific needs of the motorcoach market. This product launch demonstrates Meritor's commitment to innovation and highlights the growing demand for specialized components in niche segments of the commercial vehicle industry.
Strategic USA Automotive Aftermarket Industry Market Outlook
The USA automotive aftermarket industry presents a significant growth opportunity. The combination of factors such as a growing vehicle fleet, technological advancements, and changing consumer preferences creates a favorable environment for innovation and expansion. Strategic players can capitalize on this potential through focused investments in research and development, strategic acquisitions, and the adoption of advanced technologies. The potential for growth in the EV aftermarket and the increasing adoption of connected car technologies offer unique opportunities for companies to create innovative products and services and establish themselves as market leaders. This market is poised for continued robust growth over the next decade.
USA Automotive Aftermarket Industry Segmentation
-
1. Vehicle Type
- 1.1. Passenger Cars
- 1.2. Commercial Vehicles
-
2. Application
- 2.1. Engine Components
- 2.2. Transmission
- 2.3. Interior
- 2.4. Exterior
- 2.5. Other Applications
-
3. Sales Channel
- 3.1. Online
- 3.2. Offline
USA Automotive Aftermarket Industry Segmentation By Geography
-
1. North America
- 1.1. United States
- 1.2. Canada
- 1.3. Mexico
-
2. South America
- 2.1. Brazil
- 2.2. Argentina
- 2.3. Rest of South America
-
3. Europe
- 3.1. United Kingdom
- 3.2. Germany
- 3.3. France
- 3.4. Italy
- 3.5. Spain
- 3.6. Russia
- 3.7. Benelux
- 3.8. Nordics
- 3.9. Rest of Europe
-
4. Middle East & Africa
- 4.1. Turkey
- 4.2. Israel
- 4.3. GCC
- 4.4. North Africa
- 4.5. South Africa
- 4.6. Rest of Middle East & Africa
-
5. Asia Pacific
- 5.1. China
- 5.2. India
- 5.3. Japan
- 5.4. South Korea
- 5.5. ASEAN
- 5.6. Oceania
- 5.7. Rest of Asia Pacific
USA Automotive Aftermarket Industry REPORT HIGHLIGHTS
| Aspects | Details |
|---|---|
| Study Period | 2019-2033 |
| Base Year | 2024 |
| Estimated Year | 2025 |
| Forecast Period | 2025-2033 |
| Historical Period | 2019-2024 |
| Growth Rate | CAGR of 2.00% from 2019-2033 |
| Segmentation |
|
Table of Contents
- 1. Introduction
- 1.1. Research Scope
- 1.2. Market Segmentation
- 1.3. Research Methodology
- 1.4. Definitions and Assumptions
- 2. Executive Summary
- 2.1. Introduction
- 3. Market Dynamics
- 3.1. Introduction
- 3.2. Market Drivers
- 3.2.1. Rising Recreational and Motorsports Activities is Expected to Drive the Market; Others
- 3.3. Market Restrains
- 3.3.1. High Value and Maintenance Cost Offered to Restrain the Market Growth; Others
- 3.4. Market Trends
- 3.4.1. Rising Online Aftermarket Automotive Parts and Components Sales
- 4. Market Factor Analysis
- 4.1. Porters Five Forces
- 4.2. Supply/Value Chain
- 4.3. PESTEL analysis
- 4.4. Market Entropy
- 4.5. Patent/Trademark Analysis
- 5. Global USA Automotive Aftermarket Industry Analysis, Insights and Forecast, 2019-2031
- 5.1. Market Analysis, Insights and Forecast - by Vehicle Type
- 5.1.1. Passenger Cars
- 5.1.2. Commercial Vehicles
- 5.2. Market Analysis, Insights and Forecast - by Application
- 5.2.1. Engine Components
- 5.2.2. Transmission
- 5.2.3. Interior
- 5.2.4. Exterior
- 5.2.5. Other Applications
- 5.3. Market Analysis, Insights and Forecast - by Sales Channel
- 5.3.1. Online
- 5.3.2. Offline
- 5.4. Market Analysis, Insights and Forecast - by Region
- 5.4.1. North America
- 5.4.2. South America
- 5.4.3. Europe
- 5.4.4. Middle East & Africa
- 5.4.5. Asia Pacific
- 5.1. Market Analysis, Insights and Forecast - by Vehicle Type
- 6. North America USA Automotive Aftermarket Industry Analysis, Insights and Forecast, 2019-2031
- 6.1. Market Analysis, Insights and Forecast - by Vehicle Type
- 6.1.1. Passenger Cars
- 6.1.2. Commercial Vehicles
- 6.2. Market Analysis, Insights and Forecast - by Application
- 6.2.1. Engine Components
- 6.2.2. Transmission
- 6.2.3. Interior
- 6.2.4. Exterior
- 6.2.5. Other Applications
- 6.3. Market Analysis, Insights and Forecast - by Sales Channel
- 6.3.1. Online
- 6.3.2. Offline
- 6.1. Market Analysis, Insights and Forecast - by Vehicle Type
- 7. South America USA Automotive Aftermarket Industry Analysis, Insights and Forecast, 2019-2031
- 7.1. Market Analysis, Insights and Forecast - by Vehicle Type
- 7.1.1. Passenger Cars
- 7.1.2. Commercial Vehicles
- 7.2. Market Analysis, Insights and Forecast - by Application
- 7.2.1. Engine Components
- 7.2.2. Transmission
- 7.2.3. Interior
- 7.2.4. Exterior
- 7.2.5. Other Applications
- 7.3. Market Analysis, Insights and Forecast - by Sales Channel
- 7.3.1. Online
- 7.3.2. Offline
- 7.1. Market Analysis, Insights and Forecast - by Vehicle Type
- 8. Europe USA Automotive Aftermarket Industry Analysis, Insights and Forecast, 2019-2031
- 8.1. Market Analysis, Insights and Forecast - by Vehicle Type
- 8.1.1. Passenger Cars
- 8.1.2. Commercial Vehicles
- 8.2. Market Analysis, Insights and Forecast - by Application
- 8.2.1. Engine Components
- 8.2.2. Transmission
- 8.2.3. Interior
- 8.2.4. Exterior
- 8.2.5. Other Applications
- 8.3. Market Analysis, Insights and Forecast - by Sales Channel
- 8.3.1. Online
- 8.3.2. Offline
- 8.1. Market Analysis, Insights and Forecast - by Vehicle Type
- 9. Middle East & Africa USA Automotive Aftermarket Industry Analysis, Insights and Forecast, 2019-2031
- 9.1. Market Analysis, Insights and Forecast - by Vehicle Type
- 9.1.1. Passenger Cars
- 9.1.2. Commercial Vehicles
- 9.2. Market Analysis, Insights and Forecast - by Application
- 9.2.1. Engine Components
- 9.2.2. Transmission
- 9.2.3. Interior
- 9.2.4. Exterior
- 9.2.5. Other Applications
- 9.3. Market Analysis, Insights and Forecast - by Sales Channel
- 9.3.1. Online
- 9.3.2. Offline
- 9.1. Market Analysis, Insights and Forecast - by Vehicle Type
- 10. Asia Pacific USA Automotive Aftermarket Industry Analysis, Insights and Forecast, 2019-2031
- 10.1. Market Analysis, Insights and Forecast - by Vehicle Type
- 10.1.1. Passenger Cars
- 10.1.2. Commercial Vehicles
- 10.2. Market Analysis, Insights and Forecast - by Application
- 10.2.1. Engine Components
- 10.2.2. Transmission
- 10.2.3. Interior
- 10.2.4. Exterior
- 10.2.5. Other Applications
- 10.3. Market Analysis, Insights and Forecast - by Sales Channel
- 10.3.1. Online
- 10.3.2. Offline
- 10.1. Market Analysis, Insights and Forecast - by Vehicle Type
- 11. Northeast USA Automotive Aftermarket Industry Analysis, Insights and Forecast, 2019-2031
- 12. Southeast USA Automotive Aftermarket Industry Analysis, Insights and Forecast, 2019-2031
- 13. Midwest USA Automotive Aftermarket Industry Analysis, Insights and Forecast, 2019-2031
- 14. Southwest USA Automotive Aftermarket Industry Analysis, Insights and Forecast, 2019-2031
- 15. West USA Automotive Aftermarket Industry Analysis, Insights and Forecast, 2019-2031
- 16. Competitive Analysis
- 16.1. Global Market Share Analysis 2024
- 16.2. Company Profiles
- 16.2.1 Magna International Inc
- 16.2.1.1. Overview
- 16.2.1.2. Products
- 16.2.1.3. SWOT Analysis
- 16.2.1.4. Recent Developments
- 16.2.1.5. Financials (Based on Availability)
- 16.2.2 Aisin World Corp of America
- 16.2.2.1. Overview
- 16.2.2.2. Products
- 16.2.2.3. SWOT Analysis
- 16.2.2.4. Recent Developments
- 16.2.2.5. Financials (Based on Availability)
- 16.2.3 Yazaki North America Inc
- 16.2.3.1. Overview
- 16.2.3.2. Products
- 16.2.3.3. SWOT Analysis
- 16.2.3.4. Recent Developments
- 16.2.3.5. Financials (Based on Availability)
- 16.2.4 Aptiv PL
- 16.2.4.1. Overview
- 16.2.4.2. Products
- 16.2.4.3. SWOT Analysis
- 16.2.4.4. Recent Developments
- 16.2.4.5. Financials (Based on Availability)
- 16.2.5 American Axle & Manufacturing Holdings Inc
- 16.2.5.1. Overview
- 16.2.5.2. Products
- 16.2.5.3. SWOT Analysis
- 16.2.5.4. Recent Developments
- 16.2.5.5. Financials (Based on Availability)
- 16.2.6 Panasonic Automotive Systems Company of America
- 16.2.6.1. Overview
- 16.2.6.2. Products
- 16.2.6.3. SWOT Analysis
- 16.2.6.4. Recent Developments
- 16.2.6.5. Financials (Based on Availability)
- 16.2.7 Continental AG
- 16.2.7.1. Overview
- 16.2.7.2. Products
- 16.2.7.3. SWOT Analysis
- 16.2.7.4. Recent Developments
- 16.2.7.5. Financials (Based on Availability)
- 16.2.8 Flex-N-Gate Corporation
- 16.2.8.1. Overview
- 16.2.8.2. Products
- 16.2.8.3. SWOT Analysis
- 16.2.8.4. Recent Developments
- 16.2.8.5. Financials (Based on Availability)
- 16.2.9 Robert Bosch GmbH
- 16.2.9.1. Overview
- 16.2.9.2. Products
- 16.2.9.3. SWOT Analysis
- 16.2.9.4. Recent Developments
- 16.2.9.5. Financials (Based on Availability)
- 16.2.10 Lear Corporation
- 16.2.10.1. Overview
- 16.2.10.2. Products
- 16.2.10.3. SWOT Analysis
- 16.2.10.4. Recent Developments
- 16.2.10.5. Financials (Based on Availability)
- 16.2.11 Faurecia
- 16.2.11.1. Overview
- 16.2.11.2. Products
- 16.2.11.3. SWOT Analysis
- 16.2.11.4. Recent Developments
- 16.2.11.5. Financials (Based on Availability)
- 16.2.12 DENSO Corporation
- 16.2.12.1. Overview
- 16.2.12.2. Products
- 16.2.12.3. SWOT Analysis
- 16.2.12.4. Recent Developments
- 16.2.12.5. Financials (Based on Availability)
- 16.2.13 Adient PLC
- 16.2.13.1. Overview
- 16.2.13.2. Products
- 16.2.13.3. SWOT Analysis
- 16.2.13.4. Recent Developments
- 16.2.13.5. Financials (Based on Availability)
- 16.2.14 ZF Friedrichshafen AG
- 16.2.14.1. Overview
- 16.2.14.2. Products
- 16.2.14.3. SWOT Analysis
- 16.2.14.4. Recent Developments
- 16.2.14.5. Financials (Based on Availability)
- 16.2.1 Magna International Inc
List of Figures
- Figure 1: Global USA Automotive Aftermarket Industry Revenue Breakdown (Million, %) by Region 2024 & 2032
- Figure 2: United states USA Automotive Aftermarket Industry Revenue (Million), by Country 2024 & 2032
- Figure 3: United states USA Automotive Aftermarket Industry Revenue Share (%), by Country 2024 & 2032
- Figure 4: North America USA Automotive Aftermarket Industry Revenue (Million), by Vehicle Type 2024 & 2032
- Figure 5: North America USA Automotive Aftermarket Industry Revenue Share (%), by Vehicle Type 2024 & 2032
- Figure 6: North America USA Automotive Aftermarket Industry Revenue (Million), by Application 2024 & 2032
- Figure 7: North America USA Automotive Aftermarket Industry Revenue Share (%), by Application 2024 & 2032
- Figure 8: North America USA Automotive Aftermarket Industry Revenue (Million), by Sales Channel 2024 & 2032
- Figure 9: North America USA Automotive Aftermarket Industry Revenue Share (%), by Sales Channel 2024 & 2032
- Figure 10: North America USA Automotive Aftermarket Industry Revenue (Million), by Country 2024 & 2032
- Figure 11: North America USA Automotive Aftermarket Industry Revenue Share (%), by Country 2024 & 2032
- Figure 12: South America USA Automotive Aftermarket Industry Revenue (Million), by Vehicle Type 2024 & 2032
- Figure 13: South America USA Automotive Aftermarket Industry Revenue Share (%), by Vehicle Type 2024 & 2032
- Figure 14: South America USA Automotive Aftermarket Industry Revenue (Million), by Application 2024 & 2032
- Figure 15: South America USA Automotive Aftermarket Industry Revenue Share (%), by Application 2024 & 2032
- Figure 16: South America USA Automotive Aftermarket Industry Revenue (Million), by Sales Channel 2024 & 2032
- Figure 17: South America USA Automotive Aftermarket Industry Revenue Share (%), by Sales Channel 2024 & 2032
- Figure 18: South America USA Automotive Aftermarket Industry Revenue (Million), by Country 2024 & 2032
- Figure 19: South America USA Automotive Aftermarket Industry Revenue Share (%), by Country 2024 & 2032
- Figure 20: Europe USA Automotive Aftermarket Industry Revenue (Million), by Vehicle Type 2024 & 2032
- Figure 21: Europe USA Automotive Aftermarket Industry Revenue Share (%), by Vehicle Type 2024 & 2032
- Figure 22: Europe USA Automotive Aftermarket Industry Revenue (Million), by Application 2024 & 2032
- Figure 23: Europe USA Automotive Aftermarket Industry Revenue Share (%), by Application 2024 & 2032
- Figure 24: Europe USA Automotive Aftermarket Industry Revenue (Million), by Sales Channel 2024 & 2032
- Figure 25: Europe USA Automotive Aftermarket Industry Revenue Share (%), by Sales Channel 2024 & 2032
- Figure 26: Europe USA Automotive Aftermarket Industry Revenue (Million), by Country 2024 & 2032
- Figure 27: Europe USA Automotive Aftermarket Industry Revenue Share (%), by Country 2024 & 2032
- Figure 28: Middle East & Africa USA Automotive Aftermarket Industry Revenue (Million), by Vehicle Type 2024 & 2032
- Figure 29: Middle East & Africa USA Automotive Aftermarket Industry Revenue Share (%), by Vehicle Type 2024 & 2032
- Figure 30: Middle East & Africa USA Automotive Aftermarket Industry Revenue (Million), by Application 2024 & 2032
- Figure 31: Middle East & Africa USA Automotive Aftermarket Industry Revenue Share (%), by Application 2024 & 2032
- Figure 32: Middle East & Africa USA Automotive Aftermarket Industry Revenue (Million), by Sales Channel 2024 & 2032
- Figure 33: Middle East & Africa USA Automotive Aftermarket Industry Revenue Share (%), by Sales Channel 2024 & 2032
- Figure 34: Middle East & Africa USA Automotive Aftermarket Industry Revenue (Million), by Country 2024 & 2032
- Figure 35: Middle East & Africa USA Automotive Aftermarket Industry Revenue Share (%), by Country 2024 & 2032
- Figure 36: Asia Pacific USA Automotive Aftermarket Industry Revenue (Million), by Vehicle Type 2024 & 2032
- Figure 37: Asia Pacific USA Automotive Aftermarket Industry Revenue Share (%), by Vehicle Type 2024 & 2032
- Figure 38: Asia Pacific USA Automotive Aftermarket Industry Revenue (Million), by Application 2024 & 2032
- Figure 39: Asia Pacific USA Automotive Aftermarket Industry Revenue Share (%), by Application 2024 & 2032
- Figure 40: Asia Pacific USA Automotive Aftermarket Industry Revenue (Million), by Sales Channel 2024 & 2032
- Figure 41: Asia Pacific USA Automotive Aftermarket Industry Revenue Share (%), by Sales Channel 2024 & 2032
- Figure 42: Asia Pacific USA Automotive Aftermarket Industry Revenue (Million), by Country 2024 & 2032
- Figure 43: Asia Pacific USA Automotive Aftermarket Industry Revenue Share (%), by Country 2024 & 2032
List of Tables
- Table 1: Global USA Automotive Aftermarket Industry Revenue Million Forecast, by Region 2019 & 2032
- Table 2: Global USA Automotive Aftermarket Industry Revenue Million Forecast, by Vehicle Type 2019 & 2032
- Table 3: Global USA Automotive Aftermarket Industry Revenue Million Forecast, by Application 2019 & 2032
- Table 4: Global USA Automotive Aftermarket Industry Revenue Million Forecast, by Sales Channel 2019 & 2032
- Table 5: Global USA Automotive Aftermarket Industry Revenue Million Forecast, by Region 2019 & 2032
- Table 6: Global USA Automotive Aftermarket Industry Revenue Million Forecast, by Country 2019 & 2032
- Table 7: Northeast USA Automotive Aftermarket Industry Revenue (Million) Forecast, by Application 2019 & 2032
- Table 8: Southeast USA Automotive Aftermarket Industry Revenue (Million) Forecast, by Application 2019 & 2032
- Table 9: Midwest USA Automotive Aftermarket Industry Revenue (Million) Forecast, by Application 2019 & 2032
- Table 10: Southwest USA Automotive Aftermarket Industry Revenue (Million) Forecast, by Application 2019 & 2032
- Table 11: West USA Automotive Aftermarket Industry Revenue (Million) Forecast, by Application 2019 & 2032
- Table 12: Global USA Automotive Aftermarket Industry Revenue Million Forecast, by Vehicle Type 2019 & 2032
- Table 13: Global USA Automotive Aftermarket Industry Revenue Million Forecast, by Application 2019 & 2032
- Table 14: Global USA Automotive Aftermarket Industry Revenue Million Forecast, by Sales Channel 2019 & 2032
- Table 15: Global USA Automotive Aftermarket Industry Revenue Million Forecast, by Country 2019 & 2032
- Table 16: United States USA Automotive Aftermarket Industry Revenue (Million) Forecast, by Application 2019 & 2032
- Table 17: Canada USA Automotive Aftermarket Industry Revenue (Million) Forecast, by Application 2019 & 2032
- Table 18: Mexico USA Automotive Aftermarket Industry Revenue (Million) Forecast, by Application 2019 & 2032
- Table 19: Global USA Automotive Aftermarket Industry Revenue Million Forecast, by Vehicle Type 2019 & 2032
- Table 20: Global USA Automotive Aftermarket Industry Revenue Million Forecast, by Application 2019 & 2032
- Table 21: Global USA Automotive Aftermarket Industry Revenue Million Forecast, by Sales Channel 2019 & 2032
- Table 22: Global USA Automotive Aftermarket Industry Revenue Million Forecast, by Country 2019 & 2032
- Table 23: Brazil USA Automotive Aftermarket Industry Revenue (Million) Forecast, by Application 2019 & 2032
- Table 24: Argentina USA Automotive Aftermarket Industry Revenue (Million) Forecast, by Application 2019 & 2032
- Table 25: Rest of South America USA Automotive Aftermarket Industry Revenue (Million) Forecast, by Application 2019 & 2032
- Table 26: Global USA Automotive Aftermarket Industry Revenue Million Forecast, by Vehicle Type 2019 & 2032
- Table 27: Global USA Automotive Aftermarket Industry Revenue Million Forecast, by Application 2019 & 2032
- Table 28: Global USA Automotive Aftermarket Industry Revenue Million Forecast, by Sales Channel 2019 & 2032
- Table 29: Global USA Automotive Aftermarket Industry Revenue Million Forecast, by Country 2019 & 2032
- Table 30: United Kingdom USA Automotive Aftermarket Industry Revenue (Million) Forecast, by Application 2019 & 2032
- Table 31: Germany USA Automotive Aftermarket Industry Revenue (Million) Forecast, by Application 2019 & 2032
- Table 32: France USA Automotive Aftermarket Industry Revenue (Million) Forecast, by Application 2019 & 2032
- Table 33: Italy USA Automotive Aftermarket Industry Revenue (Million) Forecast, by Application 2019 & 2032
- Table 34: Spain USA Automotive Aftermarket Industry Revenue (Million) Forecast, by Application 2019 & 2032
- Table 35: Russia USA Automotive Aftermarket Industry Revenue (Million) Forecast, by Application 2019 & 2032
- Table 36: Benelux USA Automotive Aftermarket Industry Revenue (Million) Forecast, by Application 2019 & 2032
- Table 37: Nordics USA Automotive Aftermarket Industry Revenue (Million) Forecast, by Application 2019 & 2032
- Table 38: Rest of Europe USA Automotive Aftermarket Industry Revenue (Million) Forecast, by Application 2019 & 2032
- Table 39: Global USA Automotive Aftermarket Industry Revenue Million Forecast, by Vehicle Type 2019 & 2032
- Table 40: Global USA Automotive Aftermarket Industry Revenue Million Forecast, by Application 2019 & 2032
- Table 41: Global USA Automotive Aftermarket Industry Revenue Million Forecast, by Sales Channel 2019 & 2032
- Table 42: Global USA Automotive Aftermarket Industry Revenue Million Forecast, by Country 2019 & 2032
- Table 43: Turkey USA Automotive Aftermarket Industry Revenue (Million) Forecast, by Application 2019 & 2032
- Table 44: Israel USA Automotive Aftermarket Industry Revenue (Million) Forecast, by Application 2019 & 2032
- Table 45: GCC USA Automotive Aftermarket Industry Revenue (Million) Forecast, by Application 2019 & 2032
- Table 46: North Africa USA Automotive Aftermarket Industry Revenue (Million) Forecast, by Application 2019 & 2032
- Table 47: South Africa USA Automotive Aftermarket Industry Revenue (Million) Forecast, by Application 2019 & 2032
- Table 48: Rest of Middle East & Africa USA Automotive Aftermarket Industry Revenue (Million) Forecast, by Application 2019 & 2032
- Table 49: Global USA Automotive Aftermarket Industry Revenue Million Forecast, by Vehicle Type 2019 & 2032
- Table 50: Global USA Automotive Aftermarket Industry Revenue Million Forecast, by Application 2019 & 2032
- Table 51: Global USA Automotive Aftermarket Industry Revenue Million Forecast, by Sales Channel 2019 & 2032
- Table 52: Global USA Automotive Aftermarket Industry Revenue Million Forecast, by Country 2019 & 2032
- Table 53: China USA Automotive Aftermarket Industry Revenue (Million) Forecast, by Application 2019 & 2032
- Table 54: India USA Automotive Aftermarket Industry Revenue (Million) Forecast, by Application 2019 & 2032
- Table 55: Japan USA Automotive Aftermarket Industry Revenue (Million) Forecast, by Application 2019 & 2032
- Table 56: South Korea USA Automotive Aftermarket Industry Revenue (Million) Forecast, by Application 2019 & 2032
- Table 57: ASEAN USA Automotive Aftermarket Industry Revenue (Million) Forecast, by Application 2019 & 2032
- Table 58: Oceania USA Automotive Aftermarket Industry Revenue (Million) Forecast, by Application 2019 & 2032
- Table 59: Rest of Asia Pacific USA Automotive Aftermarket Industry Revenue (Million) Forecast, by Application 2019 & 2032
Frequently Asked Questions
1. What is the projected Compound Annual Growth Rate (CAGR) of the USA Automotive Aftermarket Industry?
The projected CAGR is approximately 2.00%.
2. Which companies are prominent players in the USA Automotive Aftermarket Industry?
Key companies in the market include Magna International Inc, Aisin World Corp of America, Yazaki North America Inc, Aptiv PL, American Axle & Manufacturing Holdings Inc, Panasonic Automotive Systems Company of America, Continental AG, Flex-N-Gate Corporation, Robert Bosch GmbH, Lear Corporation, Faurecia, DENSO Corporation, Adient PLC, ZF Friedrichshafen AG.
3. What are the main segments of the USA Automotive Aftermarket Industry?
The market segments include Vehicle Type, Application, Sales Channel.
4. Can you provide details about the market size?
The market size is estimated to be USD XX Million as of 2022.
5. What are some drivers contributing to market growth?
Rising Recreational and Motorsports Activities is Expected to Drive the Market; Others.
6. What are the notable trends driving market growth?
Rising Online Aftermarket Automotive Parts and Components Sales.
7. Are there any restraints impacting market growth?
High Value and Maintenance Cost Offered to Restrain the Market Growth; Others.
8. Can you provide examples of recent developments in the market?
December 2022: BorgWarner Inc announced plans to spin off their Fuel Systems and Aftermarket businesses into a separate, publicly traded company, which they are currently calling "NewCo." NewCo also intends to capitalize on growth trends in gasoline direct injection (GDI) and hydrogen injection systems. With this announcement, BorgWarner believes it will eventually meet or exceed its stated target of 25% revenue from EVs by 2025.
9. What pricing options are available for accessing the report?
Pricing options include single-user, multi-user, and enterprise licenses priced at USD 3800, USD 4500, and USD 5800 respectively.
10. Is the market size provided in terms of value or volume?
The market size is provided in terms of value, measured in Million.
11. Are there any specific market keywords associated with the report?
Yes, the market keyword associated with the report is "USA Automotive Aftermarket Industry," which aids in identifying and referencing the specific market segment covered.
12. How do I determine which pricing option suits my needs best?
The pricing options vary based on user requirements and access needs. Individual users may opt for single-user licenses, while businesses requiring broader access may choose multi-user or enterprise licenses for cost-effective access to the report.
13. Are there any additional resources or data provided in the USA Automotive Aftermarket Industry report?
While the report offers comprehensive insights, it's advisable to review the specific contents or supplementary materials provided to ascertain if additional resources or data are available.
14. How can I stay updated on further developments or reports in the USA Automotive Aftermarket Industry?
To stay informed about further developments, trends, and reports in the USA Automotive Aftermarket Industry, consider subscribing to industry newsletters, following relevant companies and organizations, or regularly checking reputable industry news sources and publications.
Methodology
Step 1 - Identification of Relevant Samples Size from Population Database


Step 2 - Approaches for Defining Global Market Size (Value, Volume* & Price*)

Note*: In applicable scenarios
Step 3 - Data Sources
Primary Research
- Web Analytics
- Survey Reports
- Research Institute
- Latest Research Reports
- Opinion Leaders
Secondary Research
- Annual Reports
- White Paper
- Latest Press Release
- Industry Association
- Paid Database
- Investor Presentations

Step 4 - Data Triangulation
Involves using different sources of information in order to increase the validity of a study
These sources are likely to be stakeholders in a program - participants, other researchers, program staff, other community members, and so on.
Then we put all data in single framework & apply various statistical tools to find out the dynamic on the market.
During the analysis stage, feedback from the stakeholder groups would be compared to determine areas of agreement as well as areas of divergence


