
Key Insights
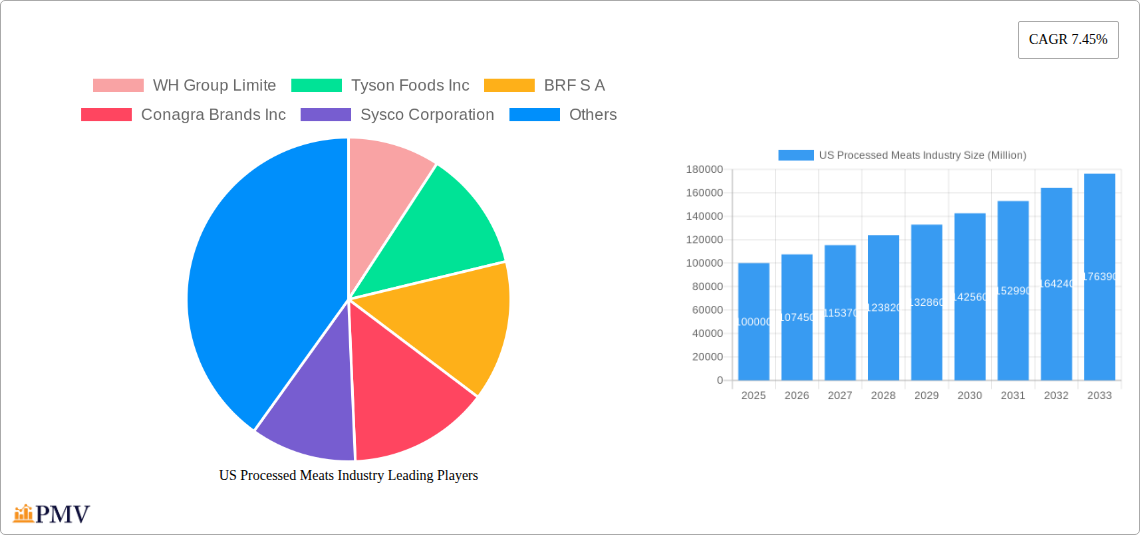
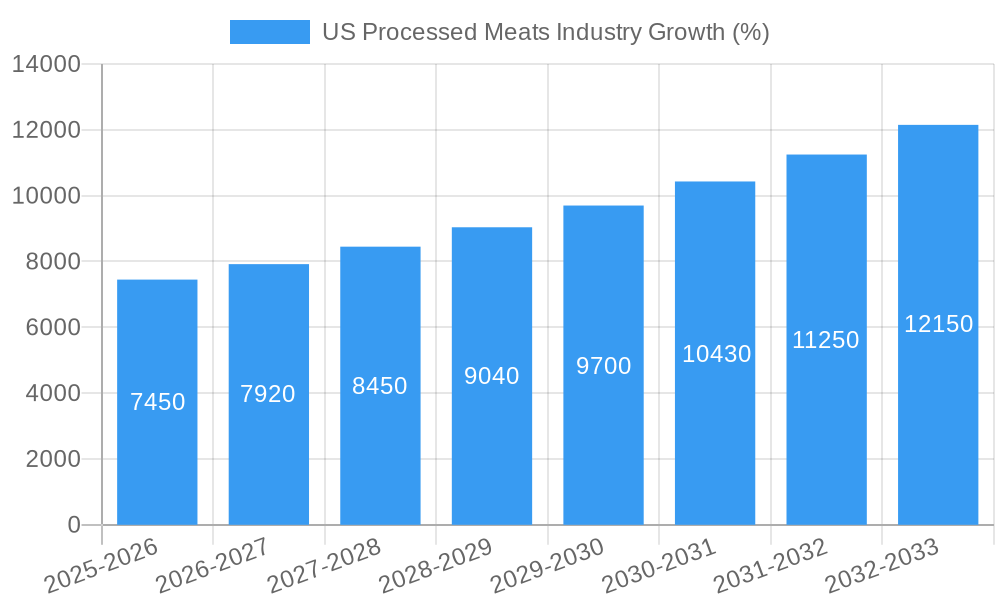
The US processed meats industry, valued at approximately $100 billion in 2025, is projected to experience robust growth, exhibiting a compound annual growth rate (CAGR) of 7.45% from 2025 to 2033. This expansion is fueled by several key drivers. Increased consumer demand for convenience foods, particularly ready-to-eat meals and snacks incorporating processed meats, is a significant factor. The rising popularity of processed meat-based products in quick-service restaurants and foodservice establishments further contributes to market growth. Technological advancements in processing and preservation techniques, leading to longer shelf life and improved product quality, also play a crucial role. Furthermore, strategic marketing initiatives focusing on health and wellness, such as leaner meat options and reduced sodium formulations, are gradually mitigating some of the negative perceptions associated with processed meats. However, growing consumer awareness of health concerns linked to high sodium and saturated fat content in certain processed meat products presents a significant restraint to market growth. Consequently, industry players are actively diversifying their product portfolios to include healthier options, such as organic and antibiotic-free processed meats, to cater to evolving consumer preferences. The market is segmented by meat type (beef, mutton, pork, poultry, other) and distribution channel (off-trade, on-trade). The off-trade channel, encompassing supermarkets, grocery stores and hypermarkets, dominates the market share, reflecting the convenience and accessibility these channels provide to consumers. Beef and poultry are major meat types driving the market's expansion, due to their versatility and broad appeal among different consumer segments.
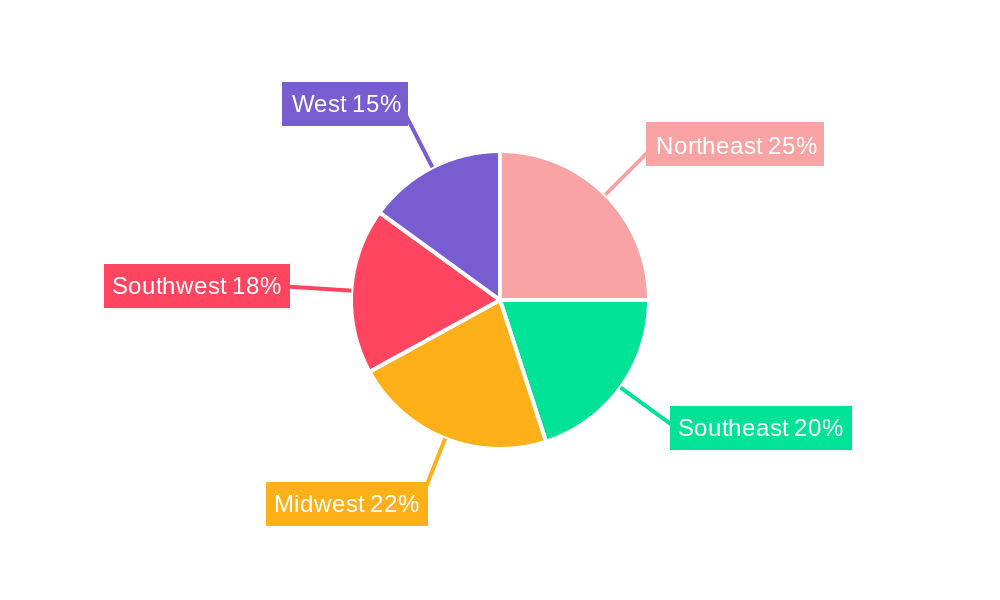
The competitive landscape is characterized by the presence of several multinational corporations, including WH Group Limited, Tyson Foods Inc., BRF S.A., and JBS S.A., which dominate significant market share through their extensive product portfolios and strong distribution networks. Regional variations in consumption patterns and preferences exist across the US, with the Northeast and West regions showing comparatively higher per capita consumption of processed meats than other regions. Future growth will likely depend on successful innovation in product development, focusing on health and sustainability aspects, as well as effective supply chain management and efficient distribution networks to reach diverse consumer groups across the country. Strategic partnerships and mergers and acquisitions will also shape the industry landscape in the years to come.
This comprehensive report provides an in-depth analysis of the US processed meats industry, covering market size, segmentation, competitive dynamics, growth drivers, and future outlook. The study period spans from 2019 to 2033, with 2025 as the base and estimated year. The forecast period is 2025-2033, and the historical period is 2019-2024. Key players like Tyson Foods, JBS SA, and Hormel Foods are analyzed, providing invaluable insights for industry professionals, investors, and stakeholders.
US Processed Meats Industry Market Structure & Competitive Dynamics
The US processed meats industry is characterized by a moderately concentrated market structure, dominated by a few large multinational corporations and several regional players. Key players like WH Group Limited, Tyson Foods Inc (Tyson Foods), BRF S.A., Conagra Brands Inc (Conagra Brands), Sysco Corporation (Sysco), The Kraft Heinz Company (Kraft Heinz), Hormel Foods Corporation (Hormel Foods), Cargill Inc (Cargill), Marfrig Global Foods S.A., Maple Leaf Foods, and JBS S.A. (JBS) compete fiercely for market share. Market concentration is further influenced by factors such as economies of scale, brand recognition, and distribution network reach. Innovation plays a crucial role, with companies investing heavily in R&D to develop new products and enhance processing technologies. Regulatory frameworks, including those related to food safety and labeling, significantly impact the industry. Product substitutes, such as plant-based meat alternatives, are emerging as a competitive threat, albeit still a niche segment. The industry's competitive landscape is further shaped by evolving consumer preferences towards healthier options and increased transparency regarding sourcing and production practices. M&A activities have been relatively frequent, driven by the desire to expand market share, access new technologies, and enhance product portfolios. Recent M&A deal values have ranged from xx Million to xx Million USD, depending on the size and strategic importance of the target company. Market share analysis shows that the top 5 players account for approximately xx% of the total market.
US Processed Meats Industry Industry Trends & Insights
The US processed meats market exhibits a complex interplay of factors driving its growth trajectory. A significant driver is the rising demand for convenient and ready-to-eat food products, fueled by busy lifestyles and changing consumer preferences. Technological advancements in processing, packaging, and preservation techniques have further boosted efficiency and extended product shelf life. However, increasing health consciousness among consumers is a double-edged sword. While demand for healthier processed meats (lean meats, reduced sodium options) is rising, concerns about saturated fat, sodium, and added nitrates continue to constrain market growth. These concerns are further amplified by ongoing discussions on the health impact of processed meat consumption. The market growth is also impacted by fluctuating raw material prices and supply chain disruptions, which can affect production costs and profitability. The industry's growth is projected to remain steady at a CAGR of xx% during the forecast period, driven by consistent demand and innovations, although potential market penetration of plant-based meat alternatives needs to be continuously monitored and strategically addressed. The market has also seen the rise of private label brands increasingly competing with established major players.
Dominant Markets & Segments in US Processed Meats Industry
The US processed meats market is dominated by the Off-Trade distribution channel, accounting for approximately xx% of the total market. This is primarily driven by the convenience and widespread availability of processed meats in grocery stores, supermarkets, and other retail outlets. Within product types, Poultry is the leading segment, followed closely by Pork and Beef. The dominance of poultry is attributed to its relatively lower cost compared to other meat types, along with its versatility in various processed meat products. Key Drivers of Dominance:
- Economic Policies: Government support for agricultural production and favorable trade policies influence meat prices and availability.
- Infrastructure: Well-developed transportation and logistics networks facilitate efficient distribution of processed meats across the country.
- Consumer Preferences: Increased demand for convenience and affordable protein sources fuels consumption of poultry and pork-based processed meats. The market for Mutton and Other Meat categories remains relatively smaller compared to the primary three.
Detailed analysis reveals that regional variations exist, with higher consumption in certain parts of the country due to demographic factors, culinary traditions, and regional economic conditions.
US Processed Meats Industry Product Innovations
Recent innovations in the US processed meats industry focus on catering to evolving consumer demands for healthier, more convenient, and flavorful products. This includes the development of leaner meats, reduced-sodium options, and the incorporation of natural flavors and ingredients. Technological advancements in processing techniques and packaging solutions contribute to improved product quality, extended shelf life, and enhanced convenience. Many companies are focusing on sustainable and ethically sourced meats to address growing consumer concerns. These product innovations aim to expand the appeal of processed meats to health-conscious consumers while retaining the convenience factor that drives demand.
Report Segmentation & Scope
This report segments the US processed meats market along two primary axes: Type and Distribution Channel.
Type: The market is categorized into Beef, Mutton, Pork, Poultry, and Other Meat. Growth projections vary across these segments, with poultry and pork expected to experience comparatively higher growth due to affordability and versatility. Competitive dynamics also differ, with larger players dominating the beef and poultry segments, while smaller players and regional brands compete in others.
Distribution Channel: The market is divided into Off-Trade (Retail) and On-Trade (Foodservice). The off-trade channel dominates the market, with substantial growth potential from both established retailers and e-commerce platforms. The on-trade channel is projected to show moderate growth, driven by the increasing demand for convenient and value-added products in restaurants and foodservice establishments.
Key Drivers of US Processed Meats Industry Growth
Several factors contribute to the growth of the US processed meats industry. Technological advancements in meat processing and packaging enhance efficiency and extend shelf life. Economic factors, such as rising disposable incomes and growing demand for affordable protein sources, drive consumption. Regulatory frameworks, while imposing certain constraints, also provide a basis for food safety and standardization, fostering consumer confidence.
Challenges in the US Processed Meats Industry Sector
The US processed meats industry faces challenges including stringent regulatory requirements regarding food safety and labeling, which can increase compliance costs. Supply chain disruptions and fluctuations in raw material prices impact profitability. Increasing competition from plant-based meat alternatives presents a significant challenge, requiring incumbent players to innovate and adapt to changing consumer preferences. These factors, coupled with rising consumer concerns about the health impacts of processed meat consumption, necessitate proactive strategies for sustainable growth and market share retention.
Leading Players in the US Processed Meats Industry Market
- WH Group Limited
- Tyson Foods Inc
- BRF S.A.
- Conagra Brands Inc
- Sysco Corporation
- The Kraft Heinz Company
- Hormel Foods Corporation
- Cargill Inc
- Marfrig Global Foods S.A.
- Maple Leaf Foods
- JBS S.A.
Key Developments in US Processed Meats Industry Sector
- May 2023: Tyson Foods Claryville expands cocktail sausage production by 50% (USD 83 Million investment).
- April 2023: Launch of HERDEZ™ Mexican Refrigerated Entrées line.
- March 2023: Tyson® brand introduces new chicken sandwiches and sliders.
Strategic US Processed Meats Industry Market Outlook
The US processed meats industry is poised for continued growth, driven by innovation, consumer demand, and strategic market expansion. Opportunities exist in developing healthier products, enhancing sustainability practices, and expanding into niche markets. Companies that successfully adapt to evolving consumer preferences and technological advancements will be best positioned for long-term success. The industry will see increased competition from plant-based alternatives, requiring continuous innovation and adaptation.
US Processed Meats Industry Segmentation
-
1. Type
- 1.1. Beef
- 1.2. Mutton
- 1.3. Pork
- 1.4. Poultry
- 1.5. Other Meat
-
2. Distribution Channel
-
2.1. Off-Trade
- 2.1.1. Convenience Stores
- 2.1.2. Online Channel
- 2.1.3. Supermarkets and Hypermarkets
- 2.1.4. Others
- 2.2. On-Trade
-
2.1. Off-Trade
US Processed Meats Industry Segmentation By Geography
-
1. North America
- 1.1. United States
- 1.2. Canada
- 1.3. Mexico
-
2. South America
- 2.1. Brazil
- 2.2. Argentina
- 2.3. Rest of South America
-
3. Europe
- 3.1. United Kingdom
- 3.2. Germany
- 3.3. France
- 3.4. Italy
- 3.5. Spain
- 3.6. Russia
- 3.7. Benelux
- 3.8. Nordics
- 3.9. Rest of Europe
-
4. Middle East & Africa
- 4.1. Turkey
- 4.2. Israel
- 4.3. GCC
- 4.4. North Africa
- 4.5. South Africa
- 4.6. Rest of Middle East & Africa
-
5. Asia Pacific
- 5.1. China
- 5.2. India
- 5.3. Japan
- 5.4. South Korea
- 5.5. ASEAN
- 5.6. Oceania
- 5.7. Rest of Asia Pacific
US Processed Meats Industry REPORT HIGHLIGHTS
| Aspects | Details |
|---|---|
| Study Period | 2019-2033 |
| Base Year | 2024 |
| Estimated Year | 2025 |
| Forecast Period | 2025-2033 |
| Historical Period | 2019-2024 |
| Growth Rate | CAGR of 7.45% from 2019-2033 |
| Segmentation |
|
Table of Contents
- 1. Introduction
- 1.1. Research Scope
- 1.2. Market Segmentation
- 1.3. Research Methodology
- 1.4. Definitions and Assumptions
- 2. Executive Summary
- 2.1. Introduction
- 3. Market Dynamics
- 3.1. Introduction
- 3.2. Market Drivers
- 3.2.1. Increasing Demand for Functional and Fortified Food; Multi-functionality and Wide Application of Riboflavin
- 3.3. Market Restrains
- 3.3.1. Low Stability of Riboflavin on Exposure to Light and Heat
- 3.4. Market Trends
- 3.4.1. OTHER KEY INDUSTRY TRENDS COVERED IN THE REPORT
- 4. Market Factor Analysis
- 4.1. Porters Five Forces
- 4.2. Supply/Value Chain
- 4.3. PESTEL analysis
- 4.4. Market Entropy
- 4.5. Patent/Trademark Analysis
- 5. Global US Processed Meats Industry Analysis, Insights and Forecast, 2019-2031
- 5.1. Market Analysis, Insights and Forecast - by Type
- 5.1.1. Beef
- 5.1.2. Mutton
- 5.1.3. Pork
- 5.1.4. Poultry
- 5.1.5. Other Meat
- 5.2. Market Analysis, Insights and Forecast - by Distribution Channel
- 5.2.1. Off-Trade
- 5.2.1.1. Convenience Stores
- 5.2.1.2. Online Channel
- 5.2.1.3. Supermarkets and Hypermarkets
- 5.2.1.4. Others
- 5.2.2. On-Trade
- 5.2.1. Off-Trade
- 5.3. Market Analysis, Insights and Forecast - by Region
- 5.3.1. North America
- 5.3.2. South America
- 5.3.3. Europe
- 5.3.4. Middle East & Africa
- 5.3.5. Asia Pacific
- 5.1. Market Analysis, Insights and Forecast - by Type
- 6. North America US Processed Meats Industry Analysis, Insights and Forecast, 2019-2031
- 6.1. Market Analysis, Insights and Forecast - by Type
- 6.1.1. Beef
- 6.1.2. Mutton
- 6.1.3. Pork
- 6.1.4. Poultry
- 6.1.5. Other Meat
- 6.2. Market Analysis, Insights and Forecast - by Distribution Channel
- 6.2.1. Off-Trade
- 6.2.1.1. Convenience Stores
- 6.2.1.2. Online Channel
- 6.2.1.3. Supermarkets and Hypermarkets
- 6.2.1.4. Others
- 6.2.2. On-Trade
- 6.2.1. Off-Trade
- 6.1. Market Analysis, Insights and Forecast - by Type
- 7. South America US Processed Meats Industry Analysis, Insights and Forecast, 2019-2031
- 7.1. Market Analysis, Insights and Forecast - by Type
- 7.1.1. Beef
- 7.1.2. Mutton
- 7.1.3. Pork
- 7.1.4. Poultry
- 7.1.5. Other Meat
- 7.2. Market Analysis, Insights and Forecast - by Distribution Channel
- 7.2.1. Off-Trade
- 7.2.1.1. Convenience Stores
- 7.2.1.2. Online Channel
- 7.2.1.3. Supermarkets and Hypermarkets
- 7.2.1.4. Others
- 7.2.2. On-Trade
- 7.2.1. Off-Trade
- 7.1. Market Analysis, Insights and Forecast - by Type
- 8. Europe US Processed Meats Industry Analysis, Insights and Forecast, 2019-2031
- 8.1. Market Analysis, Insights and Forecast - by Type
- 8.1.1. Beef
- 8.1.2. Mutton
- 8.1.3. Pork
- 8.1.4. Poultry
- 8.1.5. Other Meat
- 8.2. Market Analysis, Insights and Forecast - by Distribution Channel
- 8.2.1. Off-Trade
- 8.2.1.1. Convenience Stores
- 8.2.1.2. Online Channel
- 8.2.1.3. Supermarkets and Hypermarkets
- 8.2.1.4. Others
- 8.2.2. On-Trade
- 8.2.1. Off-Trade
- 8.1. Market Analysis, Insights and Forecast - by Type
- 9. Middle East & Africa US Processed Meats Industry Analysis, Insights and Forecast, 2019-2031
- 9.1. Market Analysis, Insights and Forecast - by Type
- 9.1.1. Beef
- 9.1.2. Mutton
- 9.1.3. Pork
- 9.1.4. Poultry
- 9.1.5. Other Meat
- 9.2. Market Analysis, Insights and Forecast - by Distribution Channel
- 9.2.1. Off-Trade
- 9.2.1.1. Convenience Stores
- 9.2.1.2. Online Channel
- 9.2.1.3. Supermarkets and Hypermarkets
- 9.2.1.4. Others
- 9.2.2. On-Trade
- 9.2.1. Off-Trade
- 9.1. Market Analysis, Insights and Forecast - by Type
- 10. Asia Pacific US Processed Meats Industry Analysis, Insights and Forecast, 2019-2031
- 10.1. Market Analysis, Insights and Forecast - by Type
- 10.1.1. Beef
- 10.1.2. Mutton
- 10.1.3. Pork
- 10.1.4. Poultry
- 10.1.5. Other Meat
- 10.2. Market Analysis, Insights and Forecast - by Distribution Channel
- 10.2.1. Off-Trade
- 10.2.1.1. Convenience Stores
- 10.2.1.2. Online Channel
- 10.2.1.3. Supermarkets and Hypermarkets
- 10.2.1.4. Others
- 10.2.2. On-Trade
- 10.2.1. Off-Trade
- 10.1. Market Analysis, Insights and Forecast - by Type
- 11. Northeast US Processed Meats Industry Analysis, Insights and Forecast, 2019-2031
- 12. Southeast US Processed Meats Industry Analysis, Insights and Forecast, 2019-2031
- 13. Midwest US Processed Meats Industry Analysis, Insights and Forecast, 2019-2031
- 14. Southwest US Processed Meats Industry Analysis, Insights and Forecast, 2019-2031
- 15. West US Processed Meats Industry Analysis, Insights and Forecast, 2019-2031
- 16. Competitive Analysis
- 16.1. Global Market Share Analysis 2024
- 16.2. Company Profiles
- 16.2.1 WH Group Limite
- 16.2.1.1. Overview
- 16.2.1.2. Products
- 16.2.1.3. SWOT Analysis
- 16.2.1.4. Recent Developments
- 16.2.1.5. Financials (Based on Availability)
- 16.2.2 Tyson Foods Inc
- 16.2.2.1. Overview
- 16.2.2.2. Products
- 16.2.2.3. SWOT Analysis
- 16.2.2.4. Recent Developments
- 16.2.2.5. Financials (Based on Availability)
- 16.2.3 BRF S A
- 16.2.3.1. Overview
- 16.2.3.2. Products
- 16.2.3.3. SWOT Analysis
- 16.2.3.4. Recent Developments
- 16.2.3.5. Financials (Based on Availability)
- 16.2.4 Conagra Brands Inc
- 16.2.4.1. Overview
- 16.2.4.2. Products
- 16.2.4.3. SWOT Analysis
- 16.2.4.4. Recent Developments
- 16.2.4.5. Financials (Based on Availability)
- 16.2.5 Sysco Corporation
- 16.2.5.1. Overview
- 16.2.5.2. Products
- 16.2.5.3. SWOT Analysis
- 16.2.5.4. Recent Developments
- 16.2.5.5. Financials (Based on Availability)
- 16.2.6 The Kraft Heinz Company
- 16.2.6.1. Overview
- 16.2.6.2. Products
- 16.2.6.3. SWOT Analysis
- 16.2.6.4. Recent Developments
- 16.2.6.5. Financials (Based on Availability)
- 16.2.7 Hormel Foods Corporation
- 16.2.7.1. Overview
- 16.2.7.2. Products
- 16.2.7.3. SWOT Analysis
- 16.2.7.4. Recent Developments
- 16.2.7.5. Financials (Based on Availability)
- 16.2.8 Cargill Inc
- 16.2.8.1. Overview
- 16.2.8.2. Products
- 16.2.8.3. SWOT Analysis
- 16.2.8.4. Recent Developments
- 16.2.8.5. Financials (Based on Availability)
- 16.2.9 Marfrig Global Foods S A
- 16.2.9.1. Overview
- 16.2.9.2. Products
- 16.2.9.3. SWOT Analysis
- 16.2.9.4. Recent Developments
- 16.2.9.5. Financials (Based on Availability)
- 16.2.10 Maple Leaf Foods
- 16.2.10.1. Overview
- 16.2.10.2. Products
- 16.2.10.3. SWOT Analysis
- 16.2.10.4. Recent Developments
- 16.2.10.5. Financials (Based on Availability)
- 16.2.11 JBS SA
- 16.2.11.1. Overview
- 16.2.11.2. Products
- 16.2.11.3. SWOT Analysis
- 16.2.11.4. Recent Developments
- 16.2.11.5. Financials (Based on Availability)
- 16.2.1 WH Group Limite
List of Figures
- Figure 1: Global US Processed Meats Industry Revenue Breakdown (Million, %) by Region 2024 & 2032
- Figure 2: United states US Processed Meats Industry Revenue (Million), by Country 2024 & 2032
- Figure 3: United states US Processed Meats Industry Revenue Share (%), by Country 2024 & 2032
- Figure 4: North America US Processed Meats Industry Revenue (Million), by Type 2024 & 2032
- Figure 5: North America US Processed Meats Industry Revenue Share (%), by Type 2024 & 2032
- Figure 6: North America US Processed Meats Industry Revenue (Million), by Distribution Channel 2024 & 2032
- Figure 7: North America US Processed Meats Industry Revenue Share (%), by Distribution Channel 2024 & 2032
- Figure 8: North America US Processed Meats Industry Revenue (Million), by Country 2024 & 2032
- Figure 9: North America US Processed Meats Industry Revenue Share (%), by Country 2024 & 2032
- Figure 10: South America US Processed Meats Industry Revenue (Million), by Type 2024 & 2032
- Figure 11: South America US Processed Meats Industry Revenue Share (%), by Type 2024 & 2032
- Figure 12: South America US Processed Meats Industry Revenue (Million), by Distribution Channel 2024 & 2032
- Figure 13: South America US Processed Meats Industry Revenue Share (%), by Distribution Channel 2024 & 2032
- Figure 14: South America US Processed Meats Industry Revenue (Million), by Country 2024 & 2032
- Figure 15: South America US Processed Meats Industry Revenue Share (%), by Country 2024 & 2032
- Figure 16: Europe US Processed Meats Industry Revenue (Million), by Type 2024 & 2032
- Figure 17: Europe US Processed Meats Industry Revenue Share (%), by Type 2024 & 2032
- Figure 18: Europe US Processed Meats Industry Revenue (Million), by Distribution Channel 2024 & 2032
- Figure 19: Europe US Processed Meats Industry Revenue Share (%), by Distribution Channel 2024 & 2032
- Figure 20: Europe US Processed Meats Industry Revenue (Million), by Country 2024 & 2032
- Figure 21: Europe US Processed Meats Industry Revenue Share (%), by Country 2024 & 2032
- Figure 22: Middle East & Africa US Processed Meats Industry Revenue (Million), by Type 2024 & 2032
- Figure 23: Middle East & Africa US Processed Meats Industry Revenue Share (%), by Type 2024 & 2032
- Figure 24: Middle East & Africa US Processed Meats Industry Revenue (Million), by Distribution Channel 2024 & 2032
- Figure 25: Middle East & Africa US Processed Meats Industry Revenue Share (%), by Distribution Channel 2024 & 2032
- Figure 26: Middle East & Africa US Processed Meats Industry Revenue (Million), by Country 2024 & 2032
- Figure 27: Middle East & Africa US Processed Meats Industry Revenue Share (%), by Country 2024 & 2032
- Figure 28: Asia Pacific US Processed Meats Industry Revenue (Million), by Type 2024 & 2032
- Figure 29: Asia Pacific US Processed Meats Industry Revenue Share (%), by Type 2024 & 2032
- Figure 30: Asia Pacific US Processed Meats Industry Revenue (Million), by Distribution Channel 2024 & 2032
- Figure 31: Asia Pacific US Processed Meats Industry Revenue Share (%), by Distribution Channel 2024 & 2032
- Figure 32: Asia Pacific US Processed Meats Industry Revenue (Million), by Country 2024 & 2032
- Figure 33: Asia Pacific US Processed Meats Industry Revenue Share (%), by Country 2024 & 2032
List of Tables
- Table 1: Global US Processed Meats Industry Revenue Million Forecast, by Region 2019 & 2032
- Table 2: Global US Processed Meats Industry Revenue Million Forecast, by Type 2019 & 2032
- Table 3: Global US Processed Meats Industry Revenue Million Forecast, by Distribution Channel 2019 & 2032
- Table 4: Global US Processed Meats Industry Revenue Million Forecast, by Region 2019 & 2032
- Table 5: Global US Processed Meats Industry Revenue Million Forecast, by Country 2019 & 2032
- Table 6: Northeast US Processed Meats Industry Revenue (Million) Forecast, by Application 2019 & 2032
- Table 7: Southeast US Processed Meats Industry Revenue (Million) Forecast, by Application 2019 & 2032
- Table 8: Midwest US Processed Meats Industry Revenue (Million) Forecast, by Application 2019 & 2032
- Table 9: Southwest US Processed Meats Industry Revenue (Million) Forecast, by Application 2019 & 2032
- Table 10: West US Processed Meats Industry Revenue (Million) Forecast, by Application 2019 & 2032
- Table 11: Global US Processed Meats Industry Revenue Million Forecast, by Type 2019 & 2032
- Table 12: Global US Processed Meats Industry Revenue Million Forecast, by Distribution Channel 2019 & 2032
- Table 13: Global US Processed Meats Industry Revenue Million Forecast, by Country 2019 & 2032
- Table 14: United States US Processed Meats Industry Revenue (Million) Forecast, by Application 2019 & 2032
- Table 15: Canada US Processed Meats Industry Revenue (Million) Forecast, by Application 2019 & 2032
- Table 16: Mexico US Processed Meats Industry Revenue (Million) Forecast, by Application 2019 & 2032
- Table 17: Global US Processed Meats Industry Revenue Million Forecast, by Type 2019 & 2032
- Table 18: Global US Processed Meats Industry Revenue Million Forecast, by Distribution Channel 2019 & 2032
- Table 19: Global US Processed Meats Industry Revenue Million Forecast, by Country 2019 & 2032
- Table 20: Brazil US Processed Meats Industry Revenue (Million) Forecast, by Application 2019 & 2032
- Table 21: Argentina US Processed Meats Industry Revenue (Million) Forecast, by Application 2019 & 2032
- Table 22: Rest of South America US Processed Meats Industry Revenue (Million) Forecast, by Application 2019 & 2032
- Table 23: Global US Processed Meats Industry Revenue Million Forecast, by Type 2019 & 2032
- Table 24: Global US Processed Meats Industry Revenue Million Forecast, by Distribution Channel 2019 & 2032
- Table 25: Global US Processed Meats Industry Revenue Million Forecast, by Country 2019 & 2032
- Table 26: United Kingdom US Processed Meats Industry Revenue (Million) Forecast, by Application 2019 & 2032
- Table 27: Germany US Processed Meats Industry Revenue (Million) Forecast, by Application 2019 & 2032
- Table 28: France US Processed Meats Industry Revenue (Million) Forecast, by Application 2019 & 2032
- Table 29: Italy US Processed Meats Industry Revenue (Million) Forecast, by Application 2019 & 2032
- Table 30: Spain US Processed Meats Industry Revenue (Million) Forecast, by Application 2019 & 2032
- Table 31: Russia US Processed Meats Industry Revenue (Million) Forecast, by Application 2019 & 2032
- Table 32: Benelux US Processed Meats Industry Revenue (Million) Forecast, by Application 2019 & 2032
- Table 33: Nordics US Processed Meats Industry Revenue (Million) Forecast, by Application 2019 & 2032
- Table 34: Rest of Europe US Processed Meats Industry Revenue (Million) Forecast, by Application 2019 & 2032
- Table 35: Global US Processed Meats Industry Revenue Million Forecast, by Type 2019 & 2032
- Table 36: Global US Processed Meats Industry Revenue Million Forecast, by Distribution Channel 2019 & 2032
- Table 37: Global US Processed Meats Industry Revenue Million Forecast, by Country 2019 & 2032
- Table 38: Turkey US Processed Meats Industry Revenue (Million) Forecast, by Application 2019 & 2032
- Table 39: Israel US Processed Meats Industry Revenue (Million) Forecast, by Application 2019 & 2032
- Table 40: GCC US Processed Meats Industry Revenue (Million) Forecast, by Application 2019 & 2032
- Table 41: North Africa US Processed Meats Industry Revenue (Million) Forecast, by Application 2019 & 2032
- Table 42: South Africa US Processed Meats Industry Revenue (Million) Forecast, by Application 2019 & 2032
- Table 43: Rest of Middle East & Africa US Processed Meats Industry Revenue (Million) Forecast, by Application 2019 & 2032
- Table 44: Global US Processed Meats Industry Revenue Million Forecast, by Type 2019 & 2032
- Table 45: Global US Processed Meats Industry Revenue Million Forecast, by Distribution Channel 2019 & 2032
- Table 46: Global US Processed Meats Industry Revenue Million Forecast, by Country 2019 & 2032
- Table 47: China US Processed Meats Industry Revenue (Million) Forecast, by Application 2019 & 2032
- Table 48: India US Processed Meats Industry Revenue (Million) Forecast, by Application 2019 & 2032
- Table 49: Japan US Processed Meats Industry Revenue (Million) Forecast, by Application 2019 & 2032
- Table 50: South Korea US Processed Meats Industry Revenue (Million) Forecast, by Application 2019 & 2032
- Table 51: ASEAN US Processed Meats Industry Revenue (Million) Forecast, by Application 2019 & 2032
- Table 52: Oceania US Processed Meats Industry Revenue (Million) Forecast, by Application 2019 & 2032
- Table 53: Rest of Asia Pacific US Processed Meats Industry Revenue (Million) Forecast, by Application 2019 & 2032
Frequently Asked Questions
1. What is the projected Compound Annual Growth Rate (CAGR) of the US Processed Meats Industry?
The projected CAGR is approximately 7.45%.
2. Which companies are prominent players in the US Processed Meats Industry?
Key companies in the market include WH Group Limite, Tyson Foods Inc, BRF S A, Conagra Brands Inc, Sysco Corporation, The Kraft Heinz Company, Hormel Foods Corporation, Cargill Inc, Marfrig Global Foods S A, Maple Leaf Foods, JBS SA.
3. What are the main segments of the US Processed Meats Industry?
The market segments include Type, Distribution Channel.
4. Can you provide details about the market size?
The market size is estimated to be USD XX Million as of 2022.
5. What are some drivers contributing to market growth?
Increasing Demand for Functional and Fortified Food; Multi-functionality and Wide Application of Riboflavin.
6. What are the notable trends driving market growth?
OTHER KEY INDUSTRY TRENDS COVERED IN THE REPORT.
7. Are there any restraints impacting market growth?
Low Stability of Riboflavin on Exposure to Light and Heat.
8. Can you provide examples of recent developments in the market?
May 2023: Tyson Foods Claryville announced its newly expanded cocktail sausage manufacturing capacity, allowing the company to meet high customer demand for its Hillshire Farm brand products. This USD 83 million expansion will add 15,000 square feet to its 342,000 square foot facility and state-of-the-art equipment to increase production by 50% to better serve customers.April 2023: The makers of the HERDEZ® brand announced the launch of its HERDEZ™ Mexican Refrigerated Entrées line with two delicious varieties, including HERDEZ™ Chicken Shredded in Mild Chipotle Sauce and HERDEZ™ Carnitas Slow Cooked Pork.March 2023: Tyson® brand introduces chicken sandwiches and sliders, bringing restaurant-quality taste to home. The new Tyson Chicken Breast Sandwiches and Sliders are available in Original and Spicy. The new product is available in the frozen snacks section at retailers nationwide.
9. What pricing options are available for accessing the report?
Pricing options include single-user, multi-user, and enterprise licenses priced at USD 3800, USD 4500, and USD 5800 respectively.
10. Is the market size provided in terms of value or volume?
The market size is provided in terms of value, measured in Million.
11. Are there any specific market keywords associated with the report?
Yes, the market keyword associated with the report is "US Processed Meats Industry," which aids in identifying and referencing the specific market segment covered.
12. How do I determine which pricing option suits my needs best?
The pricing options vary based on user requirements and access needs. Individual users may opt for single-user licenses, while businesses requiring broader access may choose multi-user or enterprise licenses for cost-effective access to the report.
13. Are there any additional resources or data provided in the US Processed Meats Industry report?
While the report offers comprehensive insights, it's advisable to review the specific contents or supplementary materials provided to ascertain if additional resources or data are available.
14. How can I stay updated on further developments or reports in the US Processed Meats Industry?
To stay informed about further developments, trends, and reports in the US Processed Meats Industry, consider subscribing to industry newsletters, following relevant companies and organizations, or regularly checking reputable industry news sources and publications.
Methodology
Step 1 - Identification of Relevant Samples Size from Population Database


Step 2 - Approaches for Defining Global Market Size (Value, Volume* & Price*)

Note*: In applicable scenarios
Step 3 - Data Sources
Primary Research
- Web Analytics
- Survey Reports
- Research Institute
- Latest Research Reports
- Opinion Leaders
Secondary Research
- Annual Reports
- White Paper
- Latest Press Release
- Industry Association
- Paid Database
- Investor Presentations

Step 4 - Data Triangulation
Involves using different sources of information in order to increase the validity of a study
These sources are likely to be stakeholders in a program - participants, other researchers, program staff, other community members, and so on.
Then we put all data in single framework & apply various statistical tools to find out the dynamic on the market.
During the analysis stage, feedback from the stakeholder groups would be compared to determine areas of agreement as well as areas of divergence


