
Key Insights
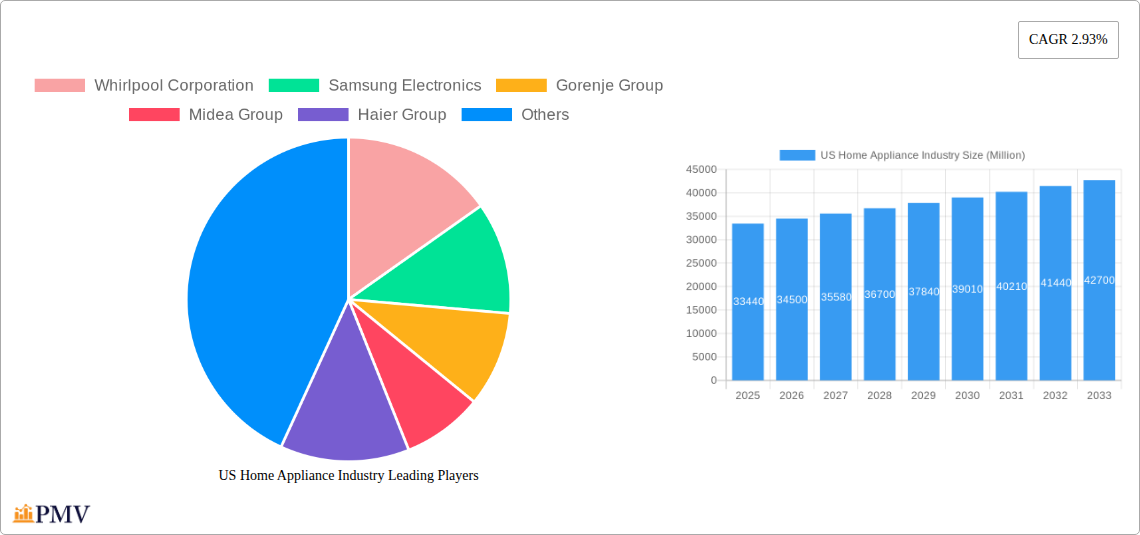
The US home appliance market, valued at $33.44 billion in 2025, is projected to experience steady growth, driven by several key factors. Rising disposable incomes, coupled with an increasing preference for convenience and energy-efficient appliances, are fueling demand. The ongoing trend towards smart home technology is also significantly impacting the sector, with consumers increasingly seeking appliances offering connectivity and automated features. Furthermore, renovations and new home constructions contribute to sustained market growth. The market is segmented by product type (refrigerators, freezers, air conditioners, dishwashers, washing machines, and ovens) and distribution channel (multi-branded stores, exclusive brand outlets, and online retailers). The dominance of major players like Whirlpool, Samsung, LG, and others signifies a competitive landscape characterized by technological innovation and brand loyalty. While supply chain disruptions and fluctuating raw material costs pose potential restraints, the long-term outlook remains positive, underpinned by continuous technological advancements and evolving consumer preferences.
Growth in the coming years will likely be influenced by economic conditions, technological breakthroughs, and evolving consumer behavior. The shift towards online purchasing continues to reshape the distribution landscape, impacting both established retailers and emerging e-commerce platforms. Differentiation strategies based on sustainability, energy efficiency, and smart features will be crucial for brands seeking to gain competitive advantages. Regional variations in growth rates are expected, with regions experiencing higher rates of new construction or renovation projects potentially exhibiting stronger demand. The continued focus on premiumization and the integration of smart technologies will shape the product offerings and pricing strategies within the market. The US home appliance industry is therefore poised for sustained growth, presenting opportunities for both established players and new entrants.
US Home Appliance Industry Market Report: 2019-2033
This comprehensive report provides an in-depth analysis of the US home appliance industry, offering valuable insights for businesses, investors, and market researchers. Covering the period from 2019 to 2033, with a base year of 2025, this report forecasts market trends and identifies key opportunities within this dynamic sector. The report includes detailed segmentation by product (refrigerators, freezers, air conditioners, dishwashers, washing machines, ovens) and distribution channel (multi-branded stores, exclusive brand outlets, online), analyzing leading players like Whirlpool Corporation, Samsung Electronics, and LG Electronics, among others. The total market size is estimated to reach xx Million by 2025.
US Home Appliance Industry Market Structure & Competitive Dynamics
The US home appliance market exhibits a moderately concentrated structure, with key players like Whirlpool Corporation, Samsung Electronics, and LG Electronics holding significant market share. The industry's competitive landscape is characterized by intense rivalry, driven by innovation, price competition, and the constant pursuit of enhanced consumer experience. Market share fluctuations are common, influenced by new product launches, marketing campaigns, and economic conditions. The industry's innovation ecosystem is robust, with continuous investment in research and development focused on energy efficiency, smart technology integration, and improved appliance durability. Regulatory frameworks, particularly those related to energy efficiency standards (e.g., Energy Star program), significantly impact product design and manufacturing. The market also witnesses the emergence of product substitutes (e.g., eco-friendly alternatives), impacting traditional appliance sales. End-user trends, shifting towards smart homes and sustainability concerns, create opportunities for innovative product development. M&A activity is relatively frequent, with deal values ranging from xx Million to xx Million, driven by strategic expansion and consolidation.
- Market Concentration: Moderately concentrated, with top 5 players holding approximately 60% market share in 2024.
- Innovation Ecosystem: Strong R&D investment in smart appliances and energy efficiency.
- Regulatory Frameworks: Significant influence of energy efficiency standards.
- M&A Activity: Frequent acquisitions and mergers, with deal values varying widely.
US Home Appliance Industry Industry Trends & Insights
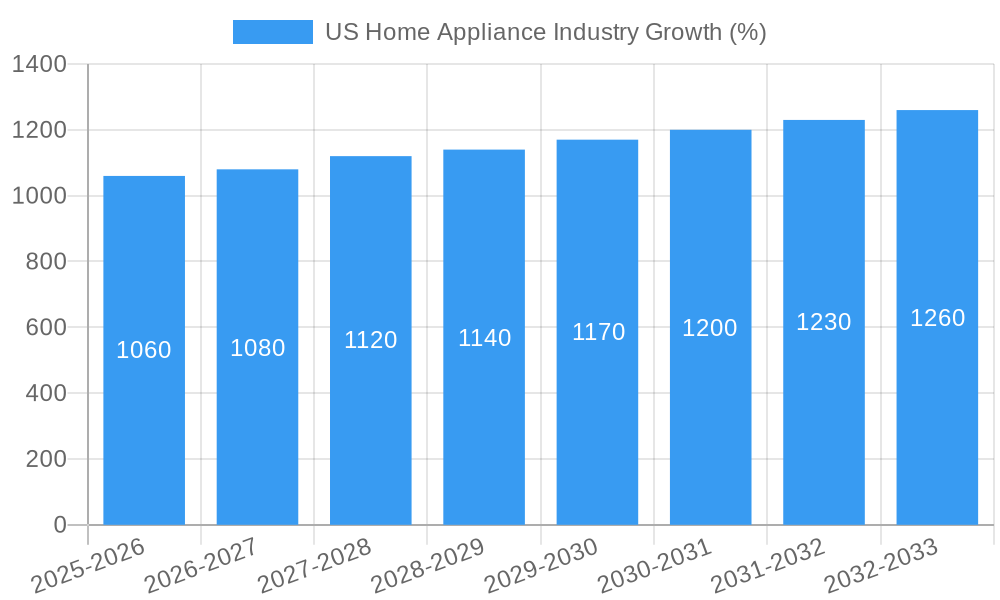
The US home appliance market is projected to witness a Compound Annual Growth Rate (CAGR) of xx% during the forecast period (2025-2033). Key growth drivers include rising disposable incomes, increasing urbanization, and a growing preference for technologically advanced appliances. The market penetration of smart appliances is steadily increasing, with consumers embracing features like voice control and remote monitoring. Technological disruptions, such as the integration of AI and IoT, are transforming the industry, leading to the development of sophisticated, energy-efficient appliances. Consumer preferences are shifting towards sustainable, energy-efficient models, prompting manufacturers to focus on eco-friendly designs and materials. Competitive dynamics remain intense, with companies investing heavily in branding and marketing to gain a competitive edge. Market growth is further fueled by renovations and new home constructions within the housing market. The market penetration of smart home technology is estimated to reach xx% by 2033.
Dominant Markets & Segments in US Home Appliance Industry
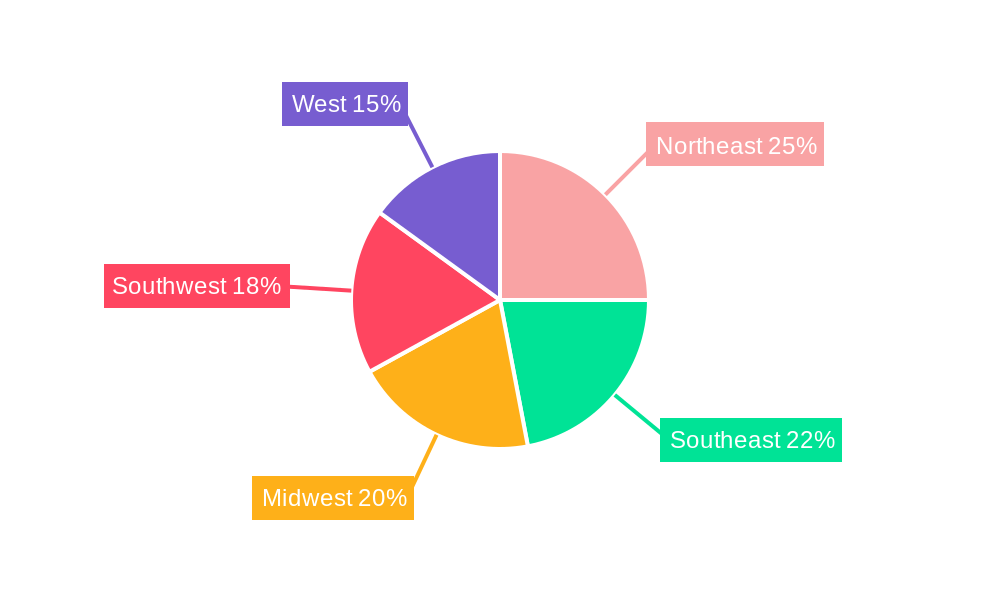
The US home appliance market is geographically diversified, with no single region demonstrating absolute dominance. However, the Western and Southern regions consistently exhibit higher demand due to population density and higher housing turnover rates. Within the product segments, refrigerators and washing machines maintain the largest market share, driven by their essential nature in households.
By Product:
- Refrigerators: Largest segment, driven by increasing household sizes and demand for advanced features.
- Washing Machines: Significant market share, propelled by convenience and technological advancements.
- Dishwashers: Steady growth, fueled by increasing disposable incomes and time-saving benefits.
- Air Conditioners: Seasonal demand fluctuations, but consistent growth in warmer regions.
By Distribution Channel:
- Multi-Branded Stores: Largest distribution channel, benefiting from established retail networks.
- Online: Rapid growth, driven by increased e-commerce adoption and convenience.
- Exclusive Brand Outlets: Smaller but significant presence of established brands.
Key drivers include robust economic growth in specific regions, supportive government policies promoting homeownership, and strong existing retail infrastructure.
US Home Appliance Industry Product Innovations
The industry is characterized by continuous innovation, focusing on smart technology integration, improved energy efficiency, and enhanced user experience. Recent trends include the integration of voice assistants, Wi-Fi connectivity, and advanced sensors. Companies are increasingly focusing on developing sustainable and eco-friendly appliances, using recycled materials and energy-efficient designs to cater to the growing environmental consciousness among consumers. This focus on innovation offers a significant competitive advantage, enabling manufacturers to capture larger market share and command premium pricing.
Report Segmentation & Scope
This report segments the US home appliance market by product type (refrigerators, freezers, air conditioners, dishwashers, washing machines, ovens) and distribution channel (multi-branded stores, exclusive brand outlets, online). Each segment is analyzed in detail, providing market size estimations, growth projections, and competitive dynamics for the historical period (2019-2024), the base year (2025), and the forecast period (2025-2033). For instance, the refrigerator segment is further divided based on technology, size, and features. The distribution channel segment provides insights into the market share and growth of online sales compared to traditional brick-and-mortar stores.
Key Drivers of US Home Appliance Industry Growth
Several factors contribute to the growth of the US home appliance industry. Technological advancements in energy efficiency and smart features enhance consumer appeal. Economic factors, like rising disposable incomes and increased homeownership rates, drive demand. Regulatory policies promoting energy efficiency also play a crucial role, as do government incentives that encourage homeowners to upgrade to more efficient appliances. The continuous development of sustainable and smart appliance solutions will further catalyze market growth.
Challenges in the US Home Appliance Industry Sector
The US home appliance industry faces challenges such as fluctuating raw material prices, supply chain disruptions, and increasing competition from international brands. Regulatory compliance costs can also be significant, particularly concerning energy efficiency standards. Intense price competition often squeezes profit margins, requiring manufacturers to optimize operational efficiencies and explore innovative cost reduction strategies. The impact of these challenges is felt through reduced profitability and increased pricing pressure, potentially impacting market growth.
Leading Players in the US Home Appliance Industry Market
- Whirlpool Corporation
- Samsung Electronics
- Gorenje Group
- Midea Group
- Haier Group
- Bosch
- Arcelik AS
- Electrolux AB
- Panasonic Corporation
- LG Electronics
Key Developments in US Home Appliance Industry Sector
- April 2023: Haier launched an innovative super drum washing machine with intelligent voice control, enhancing its product portfolio and competitive positioning.
- November 2022: Lowe's partnership with Miele broadened the availability of premium appliances, impacting the competitive landscape at the higher end of the market.
Strategic US Home Appliance Industry Market Outlook
The US home appliance market presents a substantial growth opportunity in the coming years. Continued innovation in smart home technology, coupled with increasing consumer preference for energy-efficient and sustainable appliances, will be key market drivers. Strategic opportunities exist for manufacturers to capitalize on the growing demand for smart home appliances and to expand their product offerings into niche segments. Companies that successfully adapt to evolving consumer preferences and adopt efficient manufacturing strategies are poised to capture significant market share.
US Home Appliance Industry Segmentation
-
1. Product
- 1.1. Refrigerators
- 1.2. Freezers
- 1.3. Air-conditioners
- 1.4. Dishwashers
- 1.5. Washing Machines
- 1.6. Ovens
-
2. Distribution Channel
- 2.1. Multi-Branded Stores
- 2.2. Exclusive Brand Outlets
- 2.3. Online
US Home Appliance Industry Segmentation By Geography
-
1. North America
- 1.1. United States
- 1.2. Canada
- 1.3. Mexico
-
2. South America
- 2.1. Brazil
- 2.2. Argentina
- 2.3. Rest of South America
-
3. Europe
- 3.1. United Kingdom
- 3.2. Germany
- 3.3. France
- 3.4. Italy
- 3.5. Spain
- 3.6. Russia
- 3.7. Benelux
- 3.8. Nordics
- 3.9. Rest of Europe
-
4. Middle East & Africa
- 4.1. Turkey
- 4.2. Israel
- 4.3. GCC
- 4.4. North Africa
- 4.5. South Africa
- 4.6. Rest of Middle East & Africa
-
5. Asia Pacific
- 5.1. China
- 5.2. India
- 5.3. Japan
- 5.4. South Korea
- 5.5. ASEAN
- 5.6. Oceania
- 5.7. Rest of Asia Pacific
US Home Appliance Industry REPORT HIGHLIGHTS
| Aspects | Details |
|---|---|
| Study Period | 2019-2033 |
| Base Year | 2024 |
| Estimated Year | 2025 |
| Forecast Period | 2025-2033 |
| Historical Period | 2019-2024 |
| Growth Rate | CAGR of 2.93% from 2019-2033 |
| Segmentation |
|
Table of Contents
- 1. Introduction
- 1.1. Research Scope
- 1.2. Market Segmentation
- 1.3. Research Methodology
- 1.4. Definitions and Assumptions
- 2. Executive Summary
- 2.1. Introduction
- 3. Market Dynamics
- 3.1. Introduction
- 3.2. Market Drivers
- 3.2.1. Shifts in Consumer Preferences and Lifestyle Changes Drives the Market's Growth; Demand for Time Saving Solutions Drives the Market's Growth
- 3.3. Market Restrains
- 3.3.1. Supply Chain Disruptions; High Cost of Maintenance4.3.2.1; Market Oppurtunities4.; Technological Advancements in Major Home Appliances
- 3.4. Market Trends
- 3.4.1. Increased Adoption of Multi and Advanced Products Driving the Market for Major Home Appliances
- 4. Market Factor Analysis
- 4.1. Porters Five Forces
- 4.2. Supply/Value Chain
- 4.3. PESTEL analysis
- 4.4. Market Entropy
- 4.5. Patent/Trademark Analysis
- 5. Global US Home Appliance Industry Analysis, Insights and Forecast, 2019-2031
- 5.1. Market Analysis, Insights and Forecast - by Product
- 5.1.1. Refrigerators
- 5.1.2. Freezers
- 5.1.3. Air-conditioners
- 5.1.4. Dishwashers
- 5.1.5. Washing Machines
- 5.1.6. Ovens
- 5.2. Market Analysis, Insights and Forecast - by Distribution Channel
- 5.2.1. Multi-Branded Stores
- 5.2.2. Exclusive Brand Outlets
- 5.2.3. Online
- 5.3. Market Analysis, Insights and Forecast - by Region
- 5.3.1. North America
- 5.3.2. South America
- 5.3.3. Europe
- 5.3.4. Middle East & Africa
- 5.3.5. Asia Pacific
- 5.1. Market Analysis, Insights and Forecast - by Product
- 6. North America US Home Appliance Industry Analysis, Insights and Forecast, 2019-2031
- 6.1. Market Analysis, Insights and Forecast - by Product
- 6.1.1. Refrigerators
- 6.1.2. Freezers
- 6.1.3. Air-conditioners
- 6.1.4. Dishwashers
- 6.1.5. Washing Machines
- 6.1.6. Ovens
- 6.2. Market Analysis, Insights and Forecast - by Distribution Channel
- 6.2.1. Multi-Branded Stores
- 6.2.2. Exclusive Brand Outlets
- 6.2.3. Online
- 6.1. Market Analysis, Insights and Forecast - by Product
- 7. South America US Home Appliance Industry Analysis, Insights and Forecast, 2019-2031
- 7.1. Market Analysis, Insights and Forecast - by Product
- 7.1.1. Refrigerators
- 7.1.2. Freezers
- 7.1.3. Air-conditioners
- 7.1.4. Dishwashers
- 7.1.5. Washing Machines
- 7.1.6. Ovens
- 7.2. Market Analysis, Insights and Forecast - by Distribution Channel
- 7.2.1. Multi-Branded Stores
- 7.2.2. Exclusive Brand Outlets
- 7.2.3. Online
- 7.1. Market Analysis, Insights and Forecast - by Product
- 8. Europe US Home Appliance Industry Analysis, Insights and Forecast, 2019-2031
- 8.1. Market Analysis, Insights and Forecast - by Product
- 8.1.1. Refrigerators
- 8.1.2. Freezers
- 8.1.3. Air-conditioners
- 8.1.4. Dishwashers
- 8.1.5. Washing Machines
- 8.1.6. Ovens
- 8.2. Market Analysis, Insights and Forecast - by Distribution Channel
- 8.2.1. Multi-Branded Stores
- 8.2.2. Exclusive Brand Outlets
- 8.2.3. Online
- 8.1. Market Analysis, Insights and Forecast - by Product
- 9. Middle East & Africa US Home Appliance Industry Analysis, Insights and Forecast, 2019-2031
- 9.1. Market Analysis, Insights and Forecast - by Product
- 9.1.1. Refrigerators
- 9.1.2. Freezers
- 9.1.3. Air-conditioners
- 9.1.4. Dishwashers
- 9.1.5. Washing Machines
- 9.1.6. Ovens
- 9.2. Market Analysis, Insights and Forecast - by Distribution Channel
- 9.2.1. Multi-Branded Stores
- 9.2.2. Exclusive Brand Outlets
- 9.2.3. Online
- 9.1. Market Analysis, Insights and Forecast - by Product
- 10. Asia Pacific US Home Appliance Industry Analysis, Insights and Forecast, 2019-2031
- 10.1. Market Analysis, Insights and Forecast - by Product
- 10.1.1. Refrigerators
- 10.1.2. Freezers
- 10.1.3. Air-conditioners
- 10.1.4. Dishwashers
- 10.1.5. Washing Machines
- 10.1.6. Ovens
- 10.2. Market Analysis, Insights and Forecast - by Distribution Channel
- 10.2.1. Multi-Branded Stores
- 10.2.2. Exclusive Brand Outlets
- 10.2.3. Online
- 10.1. Market Analysis, Insights and Forecast - by Product
- 11. Northeast US Home Appliance Industry Analysis, Insights and Forecast, 2019-2031
- 12. Southeast US Home Appliance Industry Analysis, Insights and Forecast, 2019-2031
- 13. Midwest US Home Appliance Industry Analysis, Insights and Forecast, 2019-2031
- 14. Southwest US Home Appliance Industry Analysis, Insights and Forecast, 2019-2031
- 15. West US Home Appliance Industry Analysis, Insights and Forecast, 2019-2031
- 16. Competitive Analysis
- 16.1. Global Market Share Analysis 2024
- 16.2. Company Profiles
- 16.2.1 Whirlpool Corporation
- 16.2.1.1. Overview
- 16.2.1.2. Products
- 16.2.1.3. SWOT Analysis
- 16.2.1.4. Recent Developments
- 16.2.1.5. Financials (Based on Availability)
- 16.2.2 Samsung Electronics
- 16.2.2.1. Overview
- 16.2.2.2. Products
- 16.2.2.3. SWOT Analysis
- 16.2.2.4. Recent Developments
- 16.2.2.5. Financials (Based on Availability)
- 16.2.3 Gorenje Group
- 16.2.3.1. Overview
- 16.2.3.2. Products
- 16.2.3.3. SWOT Analysis
- 16.2.3.4. Recent Developments
- 16.2.3.5. Financials (Based on Availability)
- 16.2.4 Midea Group
- 16.2.4.1. Overview
- 16.2.4.2. Products
- 16.2.4.3. SWOT Analysis
- 16.2.4.4. Recent Developments
- 16.2.4.5. Financials (Based on Availability)
- 16.2.5 Haier Group
- 16.2.5.1. Overview
- 16.2.5.2. Products
- 16.2.5.3. SWOT Analysis
- 16.2.5.4. Recent Developments
- 16.2.5.5. Financials (Based on Availability)
- 16.2.6 Bosch
- 16.2.6.1. Overview
- 16.2.6.2. Products
- 16.2.6.3. SWOT Analysis
- 16.2.6.4. Recent Developments
- 16.2.6.5. Financials (Based on Availability)
- 16.2.7 Arcelik AS**List Not Exhaustive
- 16.2.7.1. Overview
- 16.2.7.2. Products
- 16.2.7.3. SWOT Analysis
- 16.2.7.4. Recent Developments
- 16.2.7.5. Financials (Based on Availability)
- 16.2.8 Electrolux AB
- 16.2.8.1. Overview
- 16.2.8.2. Products
- 16.2.8.3. SWOT Analysis
- 16.2.8.4. Recent Developments
- 16.2.8.5. Financials (Based on Availability)
- 16.2.9 Panasonic Corporation
- 16.2.9.1. Overview
- 16.2.9.2. Products
- 16.2.9.3. SWOT Analysis
- 16.2.9.4. Recent Developments
- 16.2.9.5. Financials (Based on Availability)
- 16.2.10 LG Electronics
- 16.2.10.1. Overview
- 16.2.10.2. Products
- 16.2.10.3. SWOT Analysis
- 16.2.10.4. Recent Developments
- 16.2.10.5. Financials (Based on Availability)
- 16.2.1 Whirlpool Corporation
List of Figures
- Figure 1: Global US Home Appliance Industry Revenue Breakdown (Million, %) by Region 2024 & 2032
- Figure 2: United states US Home Appliance Industry Revenue (Million), by Country 2024 & 2032
- Figure 3: United states US Home Appliance Industry Revenue Share (%), by Country 2024 & 2032
- Figure 4: North America US Home Appliance Industry Revenue (Million), by Product 2024 & 2032
- Figure 5: North America US Home Appliance Industry Revenue Share (%), by Product 2024 & 2032
- Figure 6: North America US Home Appliance Industry Revenue (Million), by Distribution Channel 2024 & 2032
- Figure 7: North America US Home Appliance Industry Revenue Share (%), by Distribution Channel 2024 & 2032
- Figure 8: North America US Home Appliance Industry Revenue (Million), by Country 2024 & 2032
- Figure 9: North America US Home Appliance Industry Revenue Share (%), by Country 2024 & 2032
- Figure 10: South America US Home Appliance Industry Revenue (Million), by Product 2024 & 2032
- Figure 11: South America US Home Appliance Industry Revenue Share (%), by Product 2024 & 2032
- Figure 12: South America US Home Appliance Industry Revenue (Million), by Distribution Channel 2024 & 2032
- Figure 13: South America US Home Appliance Industry Revenue Share (%), by Distribution Channel 2024 & 2032
- Figure 14: South America US Home Appliance Industry Revenue (Million), by Country 2024 & 2032
- Figure 15: South America US Home Appliance Industry Revenue Share (%), by Country 2024 & 2032
- Figure 16: Europe US Home Appliance Industry Revenue (Million), by Product 2024 & 2032
- Figure 17: Europe US Home Appliance Industry Revenue Share (%), by Product 2024 & 2032
- Figure 18: Europe US Home Appliance Industry Revenue (Million), by Distribution Channel 2024 & 2032
- Figure 19: Europe US Home Appliance Industry Revenue Share (%), by Distribution Channel 2024 & 2032
- Figure 20: Europe US Home Appliance Industry Revenue (Million), by Country 2024 & 2032
- Figure 21: Europe US Home Appliance Industry Revenue Share (%), by Country 2024 & 2032
- Figure 22: Middle East & Africa US Home Appliance Industry Revenue (Million), by Product 2024 & 2032
- Figure 23: Middle East & Africa US Home Appliance Industry Revenue Share (%), by Product 2024 & 2032
- Figure 24: Middle East & Africa US Home Appliance Industry Revenue (Million), by Distribution Channel 2024 & 2032
- Figure 25: Middle East & Africa US Home Appliance Industry Revenue Share (%), by Distribution Channel 2024 & 2032
- Figure 26: Middle East & Africa US Home Appliance Industry Revenue (Million), by Country 2024 & 2032
- Figure 27: Middle East & Africa US Home Appliance Industry Revenue Share (%), by Country 2024 & 2032
- Figure 28: Asia Pacific US Home Appliance Industry Revenue (Million), by Product 2024 & 2032
- Figure 29: Asia Pacific US Home Appliance Industry Revenue Share (%), by Product 2024 & 2032
- Figure 30: Asia Pacific US Home Appliance Industry Revenue (Million), by Distribution Channel 2024 & 2032
- Figure 31: Asia Pacific US Home Appliance Industry Revenue Share (%), by Distribution Channel 2024 & 2032
- Figure 32: Asia Pacific US Home Appliance Industry Revenue (Million), by Country 2024 & 2032
- Figure 33: Asia Pacific US Home Appliance Industry Revenue Share (%), by Country 2024 & 2032
List of Tables
- Table 1: Global US Home Appliance Industry Revenue Million Forecast, by Region 2019 & 2032
- Table 2: Global US Home Appliance Industry Revenue Million Forecast, by Product 2019 & 2032
- Table 3: Global US Home Appliance Industry Revenue Million Forecast, by Distribution Channel 2019 & 2032
- Table 4: Global US Home Appliance Industry Revenue Million Forecast, by Region 2019 & 2032
- Table 5: Global US Home Appliance Industry Revenue Million Forecast, by Country 2019 & 2032
- Table 6: Northeast US Home Appliance Industry Revenue (Million) Forecast, by Application 2019 & 2032
- Table 7: Southeast US Home Appliance Industry Revenue (Million) Forecast, by Application 2019 & 2032
- Table 8: Midwest US Home Appliance Industry Revenue (Million) Forecast, by Application 2019 & 2032
- Table 9: Southwest US Home Appliance Industry Revenue (Million) Forecast, by Application 2019 & 2032
- Table 10: West US Home Appliance Industry Revenue (Million) Forecast, by Application 2019 & 2032
- Table 11: Global US Home Appliance Industry Revenue Million Forecast, by Product 2019 & 2032
- Table 12: Global US Home Appliance Industry Revenue Million Forecast, by Distribution Channel 2019 & 2032
- Table 13: Global US Home Appliance Industry Revenue Million Forecast, by Country 2019 & 2032
- Table 14: United States US Home Appliance Industry Revenue (Million) Forecast, by Application 2019 & 2032
- Table 15: Canada US Home Appliance Industry Revenue (Million) Forecast, by Application 2019 & 2032
- Table 16: Mexico US Home Appliance Industry Revenue (Million) Forecast, by Application 2019 & 2032
- Table 17: Global US Home Appliance Industry Revenue Million Forecast, by Product 2019 & 2032
- Table 18: Global US Home Appliance Industry Revenue Million Forecast, by Distribution Channel 2019 & 2032
- Table 19: Global US Home Appliance Industry Revenue Million Forecast, by Country 2019 & 2032
- Table 20: Brazil US Home Appliance Industry Revenue (Million) Forecast, by Application 2019 & 2032
- Table 21: Argentina US Home Appliance Industry Revenue (Million) Forecast, by Application 2019 & 2032
- Table 22: Rest of South America US Home Appliance Industry Revenue (Million) Forecast, by Application 2019 & 2032
- Table 23: Global US Home Appliance Industry Revenue Million Forecast, by Product 2019 & 2032
- Table 24: Global US Home Appliance Industry Revenue Million Forecast, by Distribution Channel 2019 & 2032
- Table 25: Global US Home Appliance Industry Revenue Million Forecast, by Country 2019 & 2032
- Table 26: United Kingdom US Home Appliance Industry Revenue (Million) Forecast, by Application 2019 & 2032
- Table 27: Germany US Home Appliance Industry Revenue (Million) Forecast, by Application 2019 & 2032
- Table 28: France US Home Appliance Industry Revenue (Million) Forecast, by Application 2019 & 2032
- Table 29: Italy US Home Appliance Industry Revenue (Million) Forecast, by Application 2019 & 2032
- Table 30: Spain US Home Appliance Industry Revenue (Million) Forecast, by Application 2019 & 2032
- Table 31: Russia US Home Appliance Industry Revenue (Million) Forecast, by Application 2019 & 2032
- Table 32: Benelux US Home Appliance Industry Revenue (Million) Forecast, by Application 2019 & 2032
- Table 33: Nordics US Home Appliance Industry Revenue (Million) Forecast, by Application 2019 & 2032
- Table 34: Rest of Europe US Home Appliance Industry Revenue (Million) Forecast, by Application 2019 & 2032
- Table 35: Global US Home Appliance Industry Revenue Million Forecast, by Product 2019 & 2032
- Table 36: Global US Home Appliance Industry Revenue Million Forecast, by Distribution Channel 2019 & 2032
- Table 37: Global US Home Appliance Industry Revenue Million Forecast, by Country 2019 & 2032
- Table 38: Turkey US Home Appliance Industry Revenue (Million) Forecast, by Application 2019 & 2032
- Table 39: Israel US Home Appliance Industry Revenue (Million) Forecast, by Application 2019 & 2032
- Table 40: GCC US Home Appliance Industry Revenue (Million) Forecast, by Application 2019 & 2032
- Table 41: North Africa US Home Appliance Industry Revenue (Million) Forecast, by Application 2019 & 2032
- Table 42: South Africa US Home Appliance Industry Revenue (Million) Forecast, by Application 2019 & 2032
- Table 43: Rest of Middle East & Africa US Home Appliance Industry Revenue (Million) Forecast, by Application 2019 & 2032
- Table 44: Global US Home Appliance Industry Revenue Million Forecast, by Product 2019 & 2032
- Table 45: Global US Home Appliance Industry Revenue Million Forecast, by Distribution Channel 2019 & 2032
- Table 46: Global US Home Appliance Industry Revenue Million Forecast, by Country 2019 & 2032
- Table 47: China US Home Appliance Industry Revenue (Million) Forecast, by Application 2019 & 2032
- Table 48: India US Home Appliance Industry Revenue (Million) Forecast, by Application 2019 & 2032
- Table 49: Japan US Home Appliance Industry Revenue (Million) Forecast, by Application 2019 & 2032
- Table 50: South Korea US Home Appliance Industry Revenue (Million) Forecast, by Application 2019 & 2032
- Table 51: ASEAN US Home Appliance Industry Revenue (Million) Forecast, by Application 2019 & 2032
- Table 52: Oceania US Home Appliance Industry Revenue (Million) Forecast, by Application 2019 & 2032
- Table 53: Rest of Asia Pacific US Home Appliance Industry Revenue (Million) Forecast, by Application 2019 & 2032
Frequently Asked Questions
1. What is the projected Compound Annual Growth Rate (CAGR) of the US Home Appliance Industry?
The projected CAGR is approximately 2.93%.
2. Which companies are prominent players in the US Home Appliance Industry?
Key companies in the market include Whirlpool Corporation, Samsung Electronics, Gorenje Group, Midea Group, Haier Group, Bosch, Arcelik AS**List Not Exhaustive, Electrolux AB, Panasonic Corporation, LG Electronics.
3. What are the main segments of the US Home Appliance Industry?
The market segments include Product, Distribution Channel.
4. Can you provide details about the market size?
The market size is estimated to be USD 33.44 Million as of 2022.
5. What are some drivers contributing to market growth?
Shifts in Consumer Preferences and Lifestyle Changes Drives the Market's Growth; Demand for Time Saving Solutions Drives the Market's Growth.
6. What are the notable trends driving market growth?
Increased Adoption of Multi and Advanced Products Driving the Market for Major Home Appliances.
7. Are there any restraints impacting market growth?
Supply Chain Disruptions; High Cost of Maintenance4.3.2.1; Market Oppurtunities4.; Technological Advancements in Major Home Appliances.
8. Can you provide examples of recent developments in the market?
April 2023: Haier launched an innovative super drum washing machine with intelligent voice control, and the excellent drum ensures effective washing performance.
9. What pricing options are available for accessing the report?
Pricing options include single-user, multi-user, and enterprise licenses priced at USD 3800, USD 4500, and USD 5800 respectively.
10. Is the market size provided in terms of value or volume?
The market size is provided in terms of value, measured in Million.
11. Are there any specific market keywords associated with the report?
Yes, the market keyword associated with the report is "US Home Appliance Industry," which aids in identifying and referencing the specific market segment covered.
12. How do I determine which pricing option suits my needs best?
The pricing options vary based on user requirements and access needs. Individual users may opt for single-user licenses, while businesses requiring broader access may choose multi-user or enterprise licenses for cost-effective access to the report.
13. Are there any additional resources or data provided in the US Home Appliance Industry report?
While the report offers comprehensive insights, it's advisable to review the specific contents or supplementary materials provided to ascertain if additional resources or data are available.
14. How can I stay updated on further developments or reports in the US Home Appliance Industry?
To stay informed about further developments, trends, and reports in the US Home Appliance Industry, consider subscribing to industry newsletters, following relevant companies and organizations, or regularly checking reputable industry news sources and publications.
Methodology
Step 1 - Identification of Relevant Samples Size from Population Database


Step 2 - Approaches for Defining Global Market Size (Value, Volume* & Price*)

Note*: In applicable scenarios
Step 3 - Data Sources
Primary Research
- Web Analytics
- Survey Reports
- Research Institute
- Latest Research Reports
- Opinion Leaders
Secondary Research
- Annual Reports
- White Paper
- Latest Press Release
- Industry Association
- Paid Database
- Investor Presentations

Step 4 - Data Triangulation
Involves using different sources of information in order to increase the validity of a study
These sources are likely to be stakeholders in a program - participants, other researchers, program staff, other community members, and so on.
Then we put all data in single framework & apply various statistical tools to find out the dynamic on the market.
During the analysis stage, feedback from the stakeholder groups would be compared to determine areas of agreement as well as areas of divergence


