

Key Insights
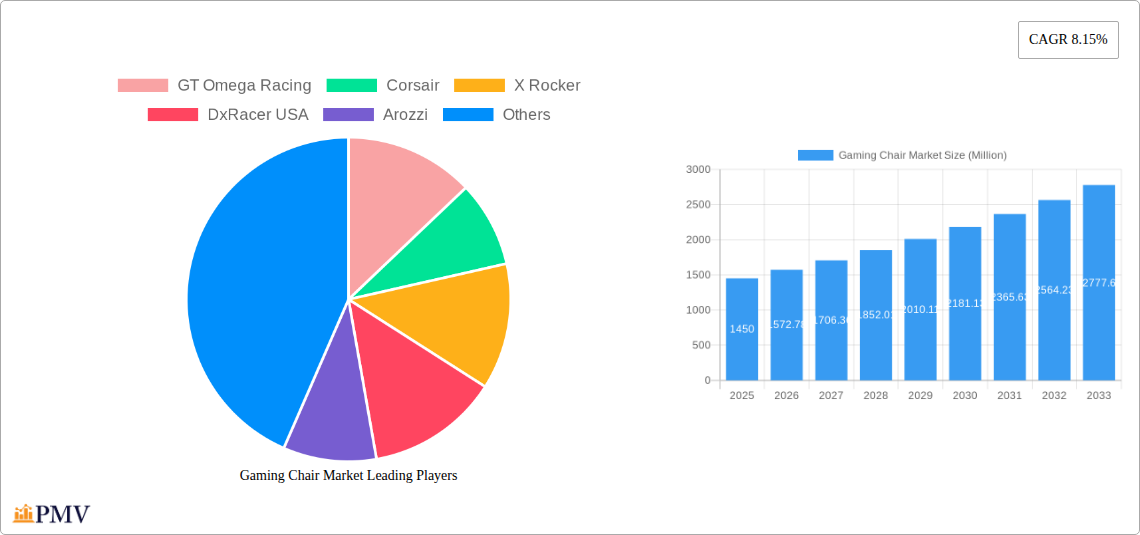
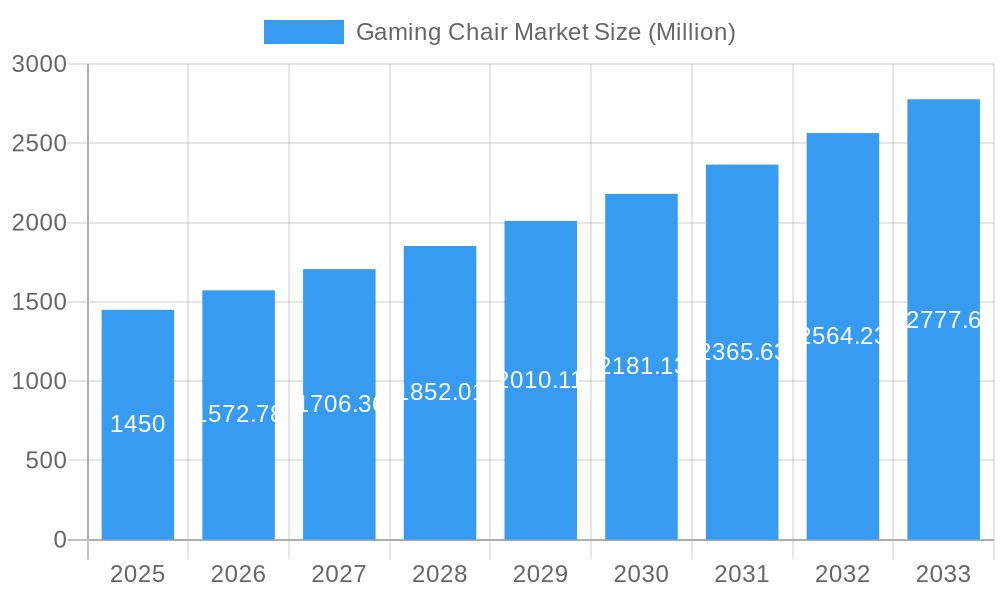
The global gaming chair market, valued at $1.45 billion in 2025, is projected to experience robust growth, exhibiting a compound annual growth rate (CAGR) of 8.15% from 2025 to 2033. This expansion is fueled by several key drivers. The increasing popularity of esports and competitive gaming is a major catalyst, driving demand for ergonomic and high-performance chairs designed to enhance comfort and gameplay. Furthermore, the rising adoption of hybrid work models and the resulting increase in home office setups contribute significantly to market growth. Consumers are increasingly investing in comfortable and supportive seating solutions for extended periods spent gaming or working from home. Technological advancements, such as the integration of advanced features like customizable lumbar support, integrated speakers, and vibration feedback, are also boosting market appeal and driving premium pricing. The market is segmented by end-user (residential and commercial), distribution channel (home centers, specialty stores, online, and others), and chair type (PC gaming chair, hybrid gaming chair, platform gaming chair, and others). The online distribution channel is experiencing particularly rapid growth, benefiting from e-commerce expansion and improved online shopping experiences.
Gaming Chair Market Market Size (In Billion)
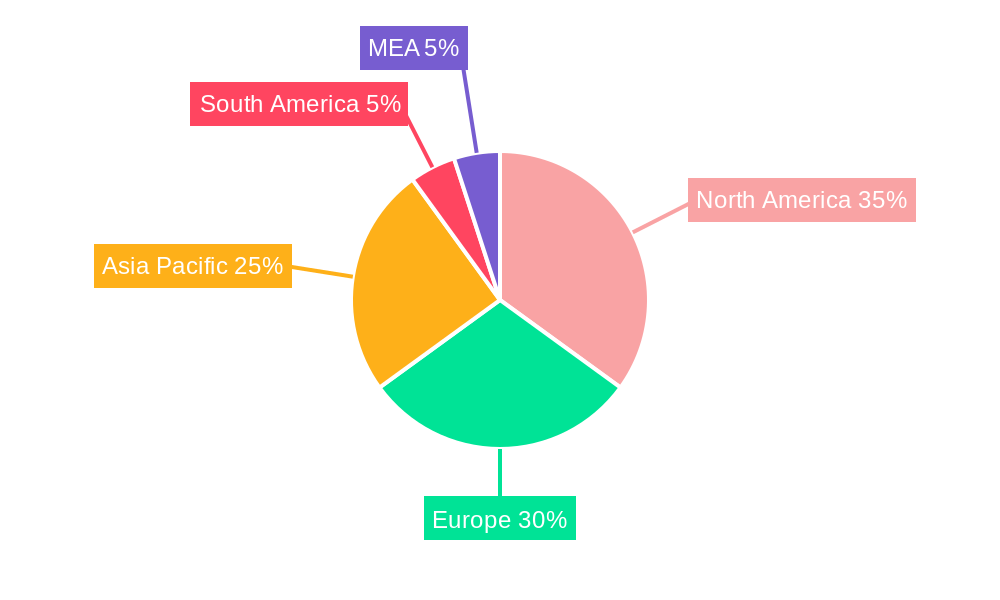
The competitive landscape is characterized by a mix of established brands and emerging players. Key players like GT Omega Racing, Corsair, X Rocker, DXRacer USA, Arozzi, AkRacing, Noblechairs, Vertagear, Ace Casual Furniture, and Secretlab are vying for market share through product innovation, strategic partnerships, and aggressive marketing campaigns. Regional variations in market growth are anticipated, with North America and Europe expected to remain significant markets, driven by high gaming penetration rates and disposable income levels. However, the Asia-Pacific region, particularly China and India, is poised for substantial growth due to the rapidly expanding gaming community and increasing purchasing power. Challenges remain, including fluctuating raw material prices and increasing competition, requiring manufacturers to continuously innovate and optimize their supply chains to maintain profitability and market competitiveness. The long-term outlook for the gaming chair market remains positive, with continued expansion predicted through 2033, driven by sustained growth in the gaming industry and evolving consumer preferences.
Gaming Chair Market Company Market Share
Gaming Chair Market: A Comprehensive Report (2019-2033)
This detailed report provides a comprehensive analysis of the global gaming chair market, covering market structure, competitive dynamics, industry trends, and future growth prospects. With a study period spanning 2019-2033, a base year of 2025, and a forecast period of 2025-2033, this report offers invaluable insights for businesses, investors, and market analysts seeking to understand this dynamic sector. The report segments the market by end-user (residential, commercial), distribution channel (home centers, specialty stores, online, other), and chair type (PC gaming chair, hybrid gaming chair, platform gaming chair, other), providing granular data and analysis on each segment's growth trajectory. The report also profiles key players like GT Omega Racing, Corsair, X Rocker, DXRacer USA, Arozzi, AkRacing, Noblechairs, Vertagear, Ace Casual Furniture, and Secretlab, offering a deep dive into their market share, strategies, and competitive positioning.
Gaming Chair Market Market Structure & Competitive Dynamics
The global gaming chair market exhibits a moderately concentrated structure, with several major players holding significant market share. However, the market also features a substantial number of smaller players, particularly in the online retail space. The competitive landscape is characterized by intense rivalry, with companies focusing on product innovation, brand building, and strategic partnerships to gain a competitive edge. Innovation ecosystems are robust, with continuous advancements in materials, ergonomics, and design leading to the introduction of new chair models with enhanced features. Regulatory frameworks related to product safety and environmental standards vary across regions, impacting manufacturing processes and market access. The market is also susceptible to the introduction of substitutes, primarily from the broader office chair segment, although the unique features and functionalities of gaming chairs ensure a distinct market identity. M&A activity has been moderate in recent years, with deal values averaging xx Million annually. Key players frequently engage in strategic alliances to leverage technological advancements and expand their distribution networks. Market share data reveals that the top five players account for approximately xx% of the global market, while the remaining share is distributed amongst numerous smaller players.
- Market Concentration: Moderately concentrated
- Innovation Ecosystem: Robust, with continuous advancements in materials and design.
- Regulatory Frameworks: Varying by region, impacting manufacturing and market access.
- Product Substitutes: Primarily from the broader office chair segment.
- M&A Activity: Moderate, with average deal values of xx Million annually.
- Top 5 Players' Market Share: Approximately xx%
Gaming Chair Market Industry Trends & Insights
The global gaming chair market is experiencing robust growth, driven by several key factors. The escalating popularity of esports and competitive gaming has fueled demand for specialized seating offering superior comfort and support during extended gaming sessions. Technological advancements, such as the incorporation of advanced ergonomic designs and customizable features, are enhancing the appeal of gaming chairs. The rising disposable incomes in key markets, especially in North America and Asia, are boosting consumer spending on gaming peripherals, including gaming chairs. A shift in consumer preferences toward premium, high-quality products further drives market growth. This has led to the launch of higher-end chairs with advanced features, resulting in an increase in average selling prices. Furthermore, the increasing prevalence of work-from-home arrangements is contributing to market growth, with gamers and remote workers seeking comfortable and ergonomic seating solutions. The market is expected to witness a CAGR of xx% during the forecast period (2025-2033), with market penetration projected to reach xx% by 2033. Competitive dynamics remain intense, with leading brands focusing on innovation, marketing, and strategic partnerships to maintain their market positions.
Dominant Markets & Segments in Gaming Chair Market
The North American region currently holds the largest share of the gaming chair market, driven by a mature gaming industry, high consumer spending, and strong adoption rates. Within this region, the United States dominates, with a significant contribution from the residential segment, followed by the commercial segment.
- By End-User: The residential segment accounts for the largest share, driven by the growing popularity of gaming as a leisure activity. Commercial segments are also growing due to increased adoption by esports teams and gaming cafes.
- By Distribution Channel: Online channels dominate, leveraging the ease of access and direct-to-consumer marketing. However, specialty stores also play a significant role, providing consumers with hands-on experience and personalized advice.
- By Type: PC gaming chairs continue to be the most dominant type, due to the wide availability of PCs and the immersive gaming experience they provide. However, hybrid and platform gaming chairs are gaining traction due to their versatility and enhanced comfort.
Key Drivers:
- North America: High consumer spending, established gaming industry.
- Europe: Growing esports scene, rising disposable incomes.
- Asia-Pacific: Rapid growth in gaming enthusiasts, increasing urbanization.
Gaming Chair Market Product Innovations
Recent product developments have focused on incorporating advanced ergonomics, improved adjustability, high-quality materials, and aesthetically pleasing designs. Technological trends include the integration of smart features, such as built-in speakers or customizable lighting, enhancing the overall user experience. These innovations are driving market growth and enhancing the competitive advantage of leading brands. The market fit for these innovations is strong, driven by the increasing demand for premium gaming chairs with enhanced features and comfort.
Report Segmentation & Scope
This report segments the gaming chair market based on end-user (residential and commercial), distribution channel (home centers, specialty stores, online, and other), and chair type (PC gaming chair, hybrid gaming chair, platform gaming chair, and other). Each segment is analyzed based on growth projections, market sizes, and competitive dynamics. The residential segment is projected to have the highest growth rate, driven by the increasing popularity of gaming among individuals. Online distribution channels are expected to experience the fastest growth due to the convenience and accessibility of online shopping. PC gaming chairs will continue to dominate the market, due to the popularity of PC gaming.
Key Drivers of Gaming Chair Market Growth
The gaming chair market is propelled by several key growth drivers. The rising popularity of esports and competitive gaming fuels demand for specialized and comfortable seating. Technological advancements in ergonomics and chair design enhance user experience. Increasing disposable incomes in key markets lead to higher spending on gaming peripherals, including gaming chairs. The work-from-home trend also contributes, as individuals seek ergonomic solutions for extended periods of sitting. Finally, effective marketing campaigns by leading brands raise awareness and drive adoption.
Challenges in the Gaming Chair Market Sector
The gaming chair market faces challenges such as supply chain disruptions that impact production and delivery. Intense competition necessitates continuous product innovation and marketing strategies. Fluctuating raw material prices affect manufacturing costs. Furthermore, ensuring compliance with various regional safety and environmental regulations presents a hurdle for manufacturers. These challenges directly impact the overall market growth and profitability.
Leading Players in the Gaming Chair Market Market
- GT Omega Racing
- Corsair
- X Rocker
- DxRacer USA
- Arozzi
- AkRacing
- Noblechairs
- Vertagear
- Ace Casual Furniture
- Secretlab
Key Developments in Gaming Chair Market Sector
- June 2022: CORSAIR launched the CORSAIR TC200 Fabric and Leatherette Gaming Chairs, expanding its gaming furniture lineup.
- August 2022: Cybeart announced the world's first Lord of the Rings Chair, expanding its licensed product range.
Strategic Gaming Chair Market Outlook
The gaming chair market is poised for sustained growth, driven by continuous innovation, increasing consumer spending, and the expanding esports industry. Strategic opportunities lie in developing ergonomic designs, incorporating advanced technologies, and expanding into new markets. Focus on sustainability and eco-friendly materials will also attract environmentally conscious consumers. The market's future potential is substantial, particularly in emerging economies with rising gaming participation and disposable incomes.
Gaming Chair Market Segmentation
-
1. Type
- 1.1. PC Gaming Chair
- 1.2. Hybrid Gaming Chair
- 1.3. Platform Gaming Chair
-
2. End User
- 2.1. Residential
- 2.2. Commercial
-
3. Distribution Channel
- 3.1. Home Centers
- 3.2. Specialty Stores
- 3.3. Online
Gaming Chair Market Segmentation By Geography
-
1. North America
- 1.1. United States
- 1.2. Canada
- 1.3. Rest of North America
-
2. Europe
- 2.1. United Kingdom
- 2.2. Germany
- 2.3. Rest of Europe
-
3. Asia Pacific
- 3.1. India
- 3.2. Japan
- 3.3. Rest of Asia Pacific
-
4. South America
- 4.1. Brazil
- 4.2. Peru
- 4.3. Rest of South America
-
5. Middle East and Africa
- 5.1. Saudi Arabia
- 5.2. United Arab Emirates
- 5.3. Rest of Middle East and Africa
Gaming Chair Market Regional Market Share
Geographic Coverage of Gaming Chair Market
Gaming Chair Market REPORT HIGHLIGHTS
| Aspects | Details |
|---|---|
| Study Period | 2020-2034 |
| Base Year | 2025 |
| Estimated Year | 2026 |
| Forecast Period | 2026-2034 |
| Historical Period | 2020-2025 |
| Growth Rate | CAGR of 8.15% from 2020-2034 |
| Segmentation |
|
Table of Contents
- 1. Introduction
- 1.1. Research Scope
- 1.2. Market Segmentation
- 1.3. Research Objective
- 1.4. Definitions and Assumptions
- 2. Executive Summary
- 2.1. Market Snapshot
- 3. Market Dynamics
- 3.1. Market Drivers
- 3.2. Market Restrains
- 3.3. Market Trends
- 3.4. Market Opportunities
- 4. Market Factor Analysis
- 4.1. Porters Five Forces
- 4.1.1. Bargaining Power of Suppliers
- 4.1.2. Bargaining Power of Buyers
- 4.1.3. Threat of New Entrants
- 4.1.4. Threat of Substitutes
- 4.1.5. Competitive Rivalry
- 4.2. PESTEL analysis
- 4.3. BCG Analysis
- 4.3.1. Stars (High Growth, High Market Share)
- 4.3.2. Cash Cows (Low Growth, High Market Share)
- 4.3.3. Question Mark (High Growth, Low Market Share)
- 4.3.4. Dogs (Low Growth, Low Market Share)
- 4.4. Ansoff Matrix Analysis
- 4.5. Supply Chain Analysis
- 4.6. Regulatory Landscape
- 4.7. Current Market Potential and Opportunity Assessment (TAM–SAM–SOM Framework)
- 4.8. PMV Analyst Note
- 4.1. Porters Five Forces
- 5. Market Analysis, Insights and Forecast 2021-2033
- 5.1. Market Analysis, Insights and Forecast - by Type
- 5.1.1. PC Gaming Chair
- 5.1.2. Hybrid Gaming Chair
- 5.1.3. Platform Gaming Chair
- 5.2. Market Analysis, Insights and Forecast - by End User
- 5.2.1. Residential
- 5.2.2. Commercial
- 5.3. Market Analysis, Insights and Forecast - by Distribution Channel
- 5.3.1. Home Centers
- 5.3.2. Specialty Stores
- 5.3.3. Online
- 5.4. Market Analysis, Insights and Forecast - by Region
- 5.4.1. North America
- 5.4.2. Europe
- 5.4.3. Asia Pacific
- 5.4.4. South America
- 5.4.5. Middle East and Africa
- 5.1. Market Analysis, Insights and Forecast - by Type
- 6. Global Gaming Chair Market Analysis, Insights and Forecast, 2021-2033
- 6.1. Market Analysis, Insights and Forecast - by Type
- 6.1.1. PC Gaming Chair
- 6.1.2. Hybrid Gaming Chair
- 6.1.3. Platform Gaming Chair
- 6.2. Market Analysis, Insights and Forecast - by End User
- 6.2.1. Residential
- 6.2.2. Commercial
- 6.3. Market Analysis, Insights and Forecast - by Distribution Channel
- 6.3.1. Home Centers
- 6.3.2. Specialty Stores
- 6.3.3. Online
- 6.1. Market Analysis, Insights and Forecast - by Type
- 7. North America Gaming Chair Market Analysis, Insights and Forecast, 2020-2032
- 7.1. Market Analysis, Insights and Forecast - by Type
- 7.1.1. PC Gaming Chair
- 7.1.2. Hybrid Gaming Chair
- 7.1.3. Platform Gaming Chair
- 7.2. Market Analysis, Insights and Forecast - by End User
- 7.2.1. Residential
- 7.2.2. Commercial
- 7.3. Market Analysis, Insights and Forecast - by Distribution Channel
- 7.3.1. Home Centers
- 7.3.2. Specialty Stores
- 7.3.3. Online
- 7.1. Market Analysis, Insights and Forecast - by Type
- 8. Europe Gaming Chair Market Analysis, Insights and Forecast, 2020-2032
- 8.1. Market Analysis, Insights and Forecast - by Type
- 8.1.1. PC Gaming Chair
- 8.1.2. Hybrid Gaming Chair
- 8.1.3. Platform Gaming Chair
- 8.2. Market Analysis, Insights and Forecast - by End User
- 8.2.1. Residential
- 8.2.2. Commercial
- 8.3. Market Analysis, Insights and Forecast - by Distribution Channel
- 8.3.1. Home Centers
- 8.3.2. Specialty Stores
- 8.3.3. Online
- 8.1. Market Analysis, Insights and Forecast - by Type
- 9. Asia Pacific Gaming Chair Market Analysis, Insights and Forecast, 2020-2032
- 9.1. Market Analysis, Insights and Forecast - by Type
- 9.1.1. PC Gaming Chair
- 9.1.2. Hybrid Gaming Chair
- 9.1.3. Platform Gaming Chair
- 9.2. Market Analysis, Insights and Forecast - by End User
- 9.2.1. Residential
- 9.2.2. Commercial
- 9.3. Market Analysis, Insights and Forecast - by Distribution Channel
- 9.3.1. Home Centers
- 9.3.2. Specialty Stores
- 9.3.3. Online
- 9.1. Market Analysis, Insights and Forecast - by Type
- 10. South America Gaming Chair Market Analysis, Insights and Forecast, 2020-2032
- 10.1. Market Analysis, Insights and Forecast - by Type
- 10.1.1. PC Gaming Chair
- 10.1.2. Hybrid Gaming Chair
- 10.1.3. Platform Gaming Chair
- 10.2. Market Analysis, Insights and Forecast - by End User
- 10.2.1. Residential
- 10.2.2. Commercial
- 10.3. Market Analysis, Insights and Forecast - by Distribution Channel
- 10.3.1. Home Centers
- 10.3.2. Specialty Stores
- 10.3.3. Online
- 10.1. Market Analysis, Insights and Forecast - by Type
- 11. Middle East and Africa Gaming Chair Market Analysis, Insights and Forecast, 2020-2032
- 11.1. Market Analysis, Insights and Forecast - by Type
- 11.1.1. PC Gaming Chair
- 11.1.2. Hybrid Gaming Chair
- 11.1.3. Platform Gaming Chair
- 11.2. Market Analysis, Insights and Forecast - by End User
- 11.2.1. Residential
- 11.2.2. Commercial
- 11.3. Market Analysis, Insights and Forecast - by Distribution Channel
- 11.3.1. Home Centers
- 11.3.2. Specialty Stores
- 11.3.3. Online
- 11.1. Market Analysis, Insights and Forecast - by Type
- 12. Competitive Analysis
- 12.1. Company Profiles
- 12.1.1 GT Omega Racing
- 12.1.1.1. Company Overview
- 12.1.1.2. Products
- 12.1.1.3. Company Financials
- 12.1.1.4. SWOT Analysis
- 12.1.2 Corsair
- 12.1.2.1. Company Overview
- 12.1.2.2. Products
- 12.1.2.3. Company Financials
- 12.1.2.4. SWOT Analysis
- 12.1.3 X Rocker
- 12.1.3.1. Company Overview
- 12.1.3.2. Products
- 12.1.3.3. Company Financials
- 12.1.3.4. SWOT Analysis
- 12.1.4 DxRacer USA
- 12.1.4.1. Company Overview
- 12.1.4.2. Products
- 12.1.4.3. Company Financials
- 12.1.4.4. SWOT Analysis
- 12.1.5 Arozzi
- 12.1.5.1. Company Overview
- 12.1.5.2. Products
- 12.1.5.3. Company Financials
- 12.1.5.4. SWOT Analysis
- 12.1.6 AkRacing
- 12.1.6.1. Company Overview
- 12.1.6.2. Products
- 12.1.6.3. Company Financials
- 12.1.6.4. SWOT Analysis
- 12.1.7 Noblechairs
- 12.1.7.1. Company Overview
- 12.1.7.2. Products
- 12.1.7.3. Company Financials
- 12.1.7.4. SWOT Analysis
- 12.1.8 Vertagear
- 12.1.8.1. Company Overview
- 12.1.8.2. Products
- 12.1.8.3. Company Financials
- 12.1.8.4. SWOT Analysis
- 12.1.9 Ace Casual Furniture
- 12.1.9.1. Company Overview
- 12.1.9.2. Products
- 12.1.9.3. Company Financials
- 12.1.9.4. SWOT Analysis
- 12.1.10 Secretlab
- 12.1.10.1. Company Overview
- 12.1.10.2. Products
- 12.1.10.3. Company Financials
- 12.1.10.4. SWOT Analysis
- 12.1.1 GT Omega Racing
- 12.2. Market Entropy
- 12.2.1 Company's Key Areas Served
- 12.2.2 Recent Developments
- 12.3. Company Market Share Analysis 2025
- 12.3.1 Top 5 Companies Market Share Analysis
- 12.3.2 Top 3 Companies Market Share Analysis
- 12.4. List of Potential Customers
- 13. Research Methodology
List of Figures
- Figure 1: Global Gaming Chair Market Revenue Breakdown (Million, %) by Region 2025 & 2033
- Figure 2: Global Gaming Chair Market Volume Breakdown (K Units, %) by Region 2025 & 2033
- Figure 3: North America Gaming Chair Market Revenue (Million), by Type 2025 & 2033
- Figure 4: North America Gaming Chair Market Volume (K Units), by Type 2025 & 2033
- Figure 5: North America Gaming Chair Market Revenue Share (%), by Type 2025 & 2033
- Figure 6: North America Gaming Chair Market Volume Share (%), by Type 2025 & 2033
- Figure 7: North America Gaming Chair Market Revenue (Million), by End User 2025 & 2033
- Figure 8: North America Gaming Chair Market Volume (K Units), by End User 2025 & 2033
- Figure 9: North America Gaming Chair Market Revenue Share (%), by End User 2025 & 2033
- Figure 10: North America Gaming Chair Market Volume Share (%), by End User 2025 & 2033
- Figure 11: North America Gaming Chair Market Revenue (Million), by Distribution Channel 2025 & 2033
- Figure 12: North America Gaming Chair Market Volume (K Units), by Distribution Channel 2025 & 2033
- Figure 13: North America Gaming Chair Market Revenue Share (%), by Distribution Channel 2025 & 2033
- Figure 14: North America Gaming Chair Market Volume Share (%), by Distribution Channel 2025 & 2033
- Figure 15: North America Gaming Chair Market Revenue (Million), by Country 2025 & 2033
- Figure 16: North America Gaming Chair Market Volume (K Units), by Country 2025 & 2033
- Figure 17: North America Gaming Chair Market Revenue Share (%), by Country 2025 & 2033
- Figure 18: North America Gaming Chair Market Volume Share (%), by Country 2025 & 2033
- Figure 19: Europe Gaming Chair Market Revenue (Million), by Type 2025 & 2033
- Figure 20: Europe Gaming Chair Market Volume (K Units), by Type 2025 & 2033
- Figure 21: Europe Gaming Chair Market Revenue Share (%), by Type 2025 & 2033
- Figure 22: Europe Gaming Chair Market Volume Share (%), by Type 2025 & 2033
- Figure 23: Europe Gaming Chair Market Revenue (Million), by End User 2025 & 2033
- Figure 24: Europe Gaming Chair Market Volume (K Units), by End User 2025 & 2033
- Figure 25: Europe Gaming Chair Market Revenue Share (%), by End User 2025 & 2033
- Figure 26: Europe Gaming Chair Market Volume Share (%), by End User 2025 & 2033
- Figure 27: Europe Gaming Chair Market Revenue (Million), by Distribution Channel 2025 & 2033
- Figure 28: Europe Gaming Chair Market Volume (K Units), by Distribution Channel 2025 & 2033
- Figure 29: Europe Gaming Chair Market Revenue Share (%), by Distribution Channel 2025 & 2033
- Figure 30: Europe Gaming Chair Market Volume Share (%), by Distribution Channel 2025 & 2033
- Figure 31: Europe Gaming Chair Market Revenue (Million), by Country 2025 & 2033
- Figure 32: Europe Gaming Chair Market Volume (K Units), by Country 2025 & 2033
- Figure 33: Europe Gaming Chair Market Revenue Share (%), by Country 2025 & 2033
- Figure 34: Europe Gaming Chair Market Volume Share (%), by Country 2025 & 2033
- Figure 35: Asia Pacific Gaming Chair Market Revenue (Million), by Type 2025 & 2033
- Figure 36: Asia Pacific Gaming Chair Market Volume (K Units), by Type 2025 & 2033
- Figure 37: Asia Pacific Gaming Chair Market Revenue Share (%), by Type 2025 & 2033
- Figure 38: Asia Pacific Gaming Chair Market Volume Share (%), by Type 2025 & 2033
- Figure 39: Asia Pacific Gaming Chair Market Revenue (Million), by End User 2025 & 2033
- Figure 40: Asia Pacific Gaming Chair Market Volume (K Units), by End User 2025 & 2033
- Figure 41: Asia Pacific Gaming Chair Market Revenue Share (%), by End User 2025 & 2033
- Figure 42: Asia Pacific Gaming Chair Market Volume Share (%), by End User 2025 & 2033
- Figure 43: Asia Pacific Gaming Chair Market Revenue (Million), by Distribution Channel 2025 & 2033
- Figure 44: Asia Pacific Gaming Chair Market Volume (K Units), by Distribution Channel 2025 & 2033
- Figure 45: Asia Pacific Gaming Chair Market Revenue Share (%), by Distribution Channel 2025 & 2033
- Figure 46: Asia Pacific Gaming Chair Market Volume Share (%), by Distribution Channel 2025 & 2033
- Figure 47: Asia Pacific Gaming Chair Market Revenue (Million), by Country 2025 & 2033
- Figure 48: Asia Pacific Gaming Chair Market Volume (K Units), by Country 2025 & 2033
- Figure 49: Asia Pacific Gaming Chair Market Revenue Share (%), by Country 2025 & 2033
- Figure 50: Asia Pacific Gaming Chair Market Volume Share (%), by Country 2025 & 2033
- Figure 51: South America Gaming Chair Market Revenue (Million), by Type 2025 & 2033
- Figure 52: South America Gaming Chair Market Volume (K Units), by Type 2025 & 2033
- Figure 53: South America Gaming Chair Market Revenue Share (%), by Type 2025 & 2033
- Figure 54: South America Gaming Chair Market Volume Share (%), by Type 2025 & 2033
- Figure 55: South America Gaming Chair Market Revenue (Million), by End User 2025 & 2033
- Figure 56: South America Gaming Chair Market Volume (K Units), by End User 2025 & 2033
- Figure 57: South America Gaming Chair Market Revenue Share (%), by End User 2025 & 2033
- Figure 58: South America Gaming Chair Market Volume Share (%), by End User 2025 & 2033
- Figure 59: South America Gaming Chair Market Revenue (Million), by Distribution Channel 2025 & 2033
- Figure 60: South America Gaming Chair Market Volume (K Units), by Distribution Channel 2025 & 2033
- Figure 61: South America Gaming Chair Market Revenue Share (%), by Distribution Channel 2025 & 2033
- Figure 62: South America Gaming Chair Market Volume Share (%), by Distribution Channel 2025 & 2033
- Figure 63: South America Gaming Chair Market Revenue (Million), by Country 2025 & 2033
- Figure 64: South America Gaming Chair Market Volume (K Units), by Country 2025 & 2033
- Figure 65: South America Gaming Chair Market Revenue Share (%), by Country 2025 & 2033
- Figure 66: South America Gaming Chair Market Volume Share (%), by Country 2025 & 2033
- Figure 67: Middle East and Africa Gaming Chair Market Revenue (Million), by Type 2025 & 2033
- Figure 68: Middle East and Africa Gaming Chair Market Volume (K Units), by Type 2025 & 2033
- Figure 69: Middle East and Africa Gaming Chair Market Revenue Share (%), by Type 2025 & 2033
- Figure 70: Middle East and Africa Gaming Chair Market Volume Share (%), by Type 2025 & 2033
- Figure 71: Middle East and Africa Gaming Chair Market Revenue (Million), by End User 2025 & 2033
- Figure 72: Middle East and Africa Gaming Chair Market Volume (K Units), by End User 2025 & 2033
- Figure 73: Middle East and Africa Gaming Chair Market Revenue Share (%), by End User 2025 & 2033
- Figure 74: Middle East and Africa Gaming Chair Market Volume Share (%), by End User 2025 & 2033
- Figure 75: Middle East and Africa Gaming Chair Market Revenue (Million), by Distribution Channel 2025 & 2033
- Figure 76: Middle East and Africa Gaming Chair Market Volume (K Units), by Distribution Channel 2025 & 2033
- Figure 77: Middle East and Africa Gaming Chair Market Revenue Share (%), by Distribution Channel 2025 & 2033
- Figure 78: Middle East and Africa Gaming Chair Market Volume Share (%), by Distribution Channel 2025 & 2033
- Figure 79: Middle East and Africa Gaming Chair Market Revenue (Million), by Country 2025 & 2033
- Figure 80: Middle East and Africa Gaming Chair Market Volume (K Units), by Country 2025 & 2033
- Figure 81: Middle East and Africa Gaming Chair Market Revenue Share (%), by Country 2025 & 2033
- Figure 82: Middle East and Africa Gaming Chair Market Volume Share (%), by Country 2025 & 2033
List of Tables
- Table 1: Global Gaming Chair Market Revenue Million Forecast, by Type 2020 & 2033
- Table 2: Global Gaming Chair Market Volume K Units Forecast, by Type 2020 & 2033
- Table 3: Global Gaming Chair Market Revenue Million Forecast, by End User 2020 & 2033
- Table 4: Global Gaming Chair Market Volume K Units Forecast, by End User 2020 & 2033
- Table 5: Global Gaming Chair Market Revenue Million Forecast, by Distribution Channel 2020 & 2033
- Table 6: Global Gaming Chair Market Volume K Units Forecast, by Distribution Channel 2020 & 2033
- Table 7: Global Gaming Chair Market Revenue Million Forecast, by Region 2020 & 2033
- Table 8: Global Gaming Chair Market Volume K Units Forecast, by Region 2020 & 2033
- Table 9: Global Gaming Chair Market Revenue Million Forecast, by Type 2020 & 2033
- Table 10: Global Gaming Chair Market Volume K Units Forecast, by Type 2020 & 2033
- Table 11: Global Gaming Chair Market Revenue Million Forecast, by End User 2020 & 2033
- Table 12: Global Gaming Chair Market Volume K Units Forecast, by End User 2020 & 2033
- Table 13: Global Gaming Chair Market Revenue Million Forecast, by Distribution Channel 2020 & 2033
- Table 14: Global Gaming Chair Market Volume K Units Forecast, by Distribution Channel 2020 & 2033
- Table 15: Global Gaming Chair Market Revenue Million Forecast, by Country 2020 & 2033
- Table 16: Global Gaming Chair Market Volume K Units Forecast, by Country 2020 & 2033
- Table 17: United States Gaming Chair Market Revenue (Million) Forecast, by Application 2020 & 2033
- Table 18: United States Gaming Chair Market Volume (K Units) Forecast, by Application 2020 & 2033
- Table 19: Canada Gaming Chair Market Revenue (Million) Forecast, by Application 2020 & 2033
- Table 20: Canada Gaming Chair Market Volume (K Units) Forecast, by Application 2020 & 2033
- Table 21: Rest of North America Gaming Chair Market Revenue (Million) Forecast, by Application 2020 & 2033
- Table 22: Rest of North America Gaming Chair Market Volume (K Units) Forecast, by Application 2020 & 2033
- Table 23: Global Gaming Chair Market Revenue Million Forecast, by Type 2020 & 2033
- Table 24: Global Gaming Chair Market Volume K Units Forecast, by Type 2020 & 2033
- Table 25: Global Gaming Chair Market Revenue Million Forecast, by End User 2020 & 2033
- Table 26: Global Gaming Chair Market Volume K Units Forecast, by End User 2020 & 2033
- Table 27: Global Gaming Chair Market Revenue Million Forecast, by Distribution Channel 2020 & 2033
- Table 28: Global Gaming Chair Market Volume K Units Forecast, by Distribution Channel 2020 & 2033
- Table 29: Global Gaming Chair Market Revenue Million Forecast, by Country 2020 & 2033
- Table 30: Global Gaming Chair Market Volume K Units Forecast, by Country 2020 & 2033
- Table 31: United Kingdom Gaming Chair Market Revenue (Million) Forecast, by Application 2020 & 2033
- Table 32: United Kingdom Gaming Chair Market Volume (K Units) Forecast, by Application 2020 & 2033
- Table 33: Germany Gaming Chair Market Revenue (Million) Forecast, by Application 2020 & 2033
- Table 34: Germany Gaming Chair Market Volume (K Units) Forecast, by Application 2020 & 2033
- Table 35: Rest of Europe Gaming Chair Market Revenue (Million) Forecast, by Application 2020 & 2033
- Table 36: Rest of Europe Gaming Chair Market Volume (K Units) Forecast, by Application 2020 & 2033
- Table 37: Global Gaming Chair Market Revenue Million Forecast, by Type 2020 & 2033
- Table 38: Global Gaming Chair Market Volume K Units Forecast, by Type 2020 & 2033
- Table 39: Global Gaming Chair Market Revenue Million Forecast, by End User 2020 & 2033
- Table 40: Global Gaming Chair Market Volume K Units Forecast, by End User 2020 & 2033
- Table 41: Global Gaming Chair Market Revenue Million Forecast, by Distribution Channel 2020 & 2033
- Table 42: Global Gaming Chair Market Volume K Units Forecast, by Distribution Channel 2020 & 2033
- Table 43: Global Gaming Chair Market Revenue Million Forecast, by Country 2020 & 2033
- Table 44: Global Gaming Chair Market Volume K Units Forecast, by Country 2020 & 2033
- Table 45: India Gaming Chair Market Revenue (Million) Forecast, by Application 2020 & 2033
- Table 46: India Gaming Chair Market Volume (K Units) Forecast, by Application 2020 & 2033
- Table 47: Japan Gaming Chair Market Revenue (Million) Forecast, by Application 2020 & 2033
- Table 48: Japan Gaming Chair Market Volume (K Units) Forecast, by Application 2020 & 2033
- Table 49: Rest of Asia Pacific Gaming Chair Market Revenue (Million) Forecast, by Application 2020 & 2033
- Table 50: Rest of Asia Pacific Gaming Chair Market Volume (K Units) Forecast, by Application 2020 & 2033
- Table 51: Global Gaming Chair Market Revenue Million Forecast, by Type 2020 & 2033
- Table 52: Global Gaming Chair Market Volume K Units Forecast, by Type 2020 & 2033
- Table 53: Global Gaming Chair Market Revenue Million Forecast, by End User 2020 & 2033
- Table 54: Global Gaming Chair Market Volume K Units Forecast, by End User 2020 & 2033
- Table 55: Global Gaming Chair Market Revenue Million Forecast, by Distribution Channel 2020 & 2033
- Table 56: Global Gaming Chair Market Volume K Units Forecast, by Distribution Channel 2020 & 2033
- Table 57: Global Gaming Chair Market Revenue Million Forecast, by Country 2020 & 2033
- Table 58: Global Gaming Chair Market Volume K Units Forecast, by Country 2020 & 2033
- Table 59: Brazil Gaming Chair Market Revenue (Million) Forecast, by Application 2020 & 2033
- Table 60: Brazil Gaming Chair Market Volume (K Units) Forecast, by Application 2020 & 2033
- Table 61: Peru Gaming Chair Market Revenue (Million) Forecast, by Application 2020 & 2033
- Table 62: Peru Gaming Chair Market Volume (K Units) Forecast, by Application 2020 & 2033
- Table 63: Rest of South America Gaming Chair Market Revenue (Million) Forecast, by Application 2020 & 2033
- Table 64: Rest of South America Gaming Chair Market Volume (K Units) Forecast, by Application 2020 & 2033
- Table 65: Global Gaming Chair Market Revenue Million Forecast, by Type 2020 & 2033
- Table 66: Global Gaming Chair Market Volume K Units Forecast, by Type 2020 & 2033
- Table 67: Global Gaming Chair Market Revenue Million Forecast, by End User 2020 & 2033
- Table 68: Global Gaming Chair Market Volume K Units Forecast, by End User 2020 & 2033
- Table 69: Global Gaming Chair Market Revenue Million Forecast, by Distribution Channel 2020 & 2033
- Table 70: Global Gaming Chair Market Volume K Units Forecast, by Distribution Channel 2020 & 2033
- Table 71: Global Gaming Chair Market Revenue Million Forecast, by Country 2020 & 2033
- Table 72: Global Gaming Chair Market Volume K Units Forecast, by Country 2020 & 2033
- Table 73: Saudi Arabia Gaming Chair Market Revenue (Million) Forecast, by Application 2020 & 2033
- Table 74: Saudi Arabia Gaming Chair Market Volume (K Units) Forecast, by Application 2020 & 2033
- Table 75: United Arab Emirates Gaming Chair Market Revenue (Million) Forecast, by Application 2020 & 2033
- Table 76: United Arab Emirates Gaming Chair Market Volume (K Units) Forecast, by Application 2020 & 2033
- Table 77: Rest of Middle East and Africa Gaming Chair Market Revenue (Million) Forecast, by Application 2020 & 2033
- Table 78: Rest of Middle East and Africa Gaming Chair Market Volume (K Units) Forecast, by Application 2020 & 2033
Frequently Asked Questions
1. What is the projected Compound Annual Growth Rate (CAGR) of the Gaming Chair Market?
The projected CAGR is approximately 8.15%.
2. Which companies are prominent players in the Gaming Chair Market?
Key companies in the market include GT Omega Racing, Corsair, X Rocker, DxRacer USA, Arozzi, AkRacing, Noblechairs, Vertagear, Ace Casual Furniture, Secretlab.
3. What are the main segments of the Gaming Chair Market?
The market segments include Type, End User, Distribution Channel.
4. Can you provide details about the market size?
The market size is estimated to be USD 1.45 Million as of 2022.
5. What are some drivers contributing to market growth?
Technological Advancement booming the industry; Focus on Ergonomics and Comfort.
6. What are the notable trends driving market growth?
Expanding Video Gaming Industry is Driving the Market.
7. Are there any restraints impacting market growth?
High cost; Limited Target Audience.
8. Can you provide examples of recent developments in the market?
August 2022: Cybeart, a Canadian manufacturer of premium gaming accessories, announced the world's first Lord of the Rings Chair on 25th August 2022. In addition to Cybeart's existing range of officially licensed products, the upcoming product line will be a continuation of its ongoing partnership with Warner Bros.
9. What pricing options are available for accessing the report?
Pricing options include single-user, multi-user, and enterprise licenses priced at USD 4750, USD 5250, and USD 8750 respectively.
10. Is the market size provided in terms of value or volume?
The market size is provided in terms of value, measured in Million and volume, measured in K Units.
11. Are there any specific market keywords associated with the report?
Yes, the market keyword associated with the report is "Gaming Chair Market," which aids in identifying and referencing the specific market segment covered.
12. How do I determine which pricing option suits my needs best?
The pricing options vary based on user requirements and access needs. Individual users may opt for single-user licenses, while businesses requiring broader access may choose multi-user or enterprise licenses for cost-effective access to the report.
13. Are there any additional resources or data provided in the Gaming Chair Market report?
While the report offers comprehensive insights, it's advisable to review the specific contents or supplementary materials provided to ascertain if additional resources or data are available.
14. How can I stay updated on further developments or reports in the Gaming Chair Market?
To stay informed about further developments, trends, and reports in the Gaming Chair Market, consider subscribing to industry newsletters, following relevant companies and organizations, or regularly checking reputable industry news sources and publications.
Methodology
Step 1 - Identification of Relevant Samples Size from Population Database


Step 2 - Approaches for Defining Global Market Size (Value, Volume* & Price*)

Note*: In applicable scenarios
Step 3 - Data Sources
Primary Research
- Web Analytics
- Survey Reports
- Research Institute
- Latest Research Reports
- Opinion Leaders
Secondary Research
- Annual Reports
- White Paper
- Latest Press Release
- Industry Association
- Paid Database
- Investor Presentations

Step 4 - Data Triangulation
Involves using different sources of information in order to increase the validity of a study
These sources are likely to be stakeholders in a program - participants, other researchers, program staff, other community members, and so on.
Then we put all data in single framework & apply various statistical tools to find out the dynamic on the market.
During the analysis stage, feedback from the stakeholder groups would be compared to determine areas of agreement as well as areas of divergence