
Key Insights
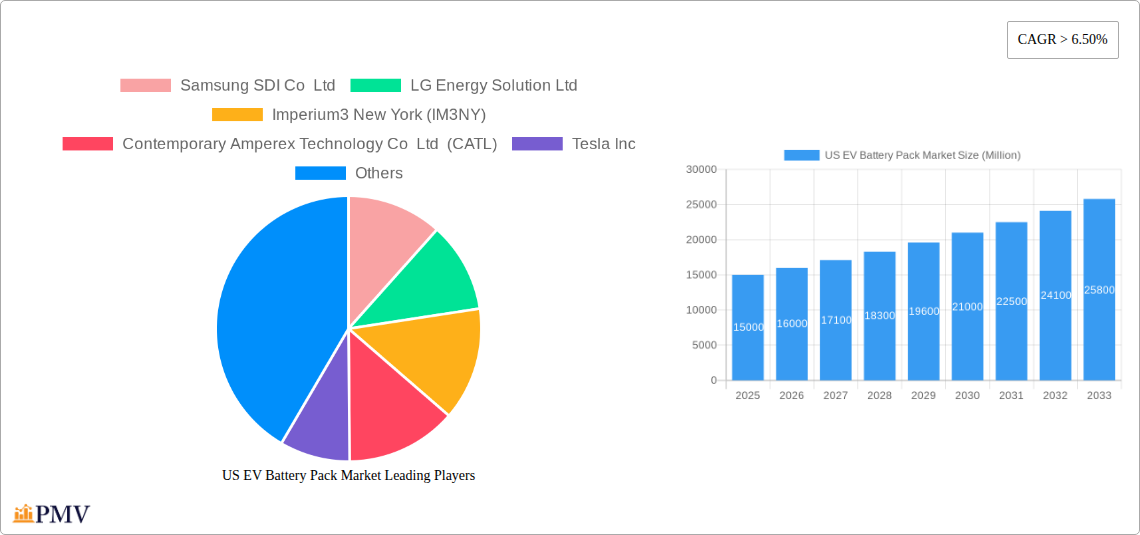
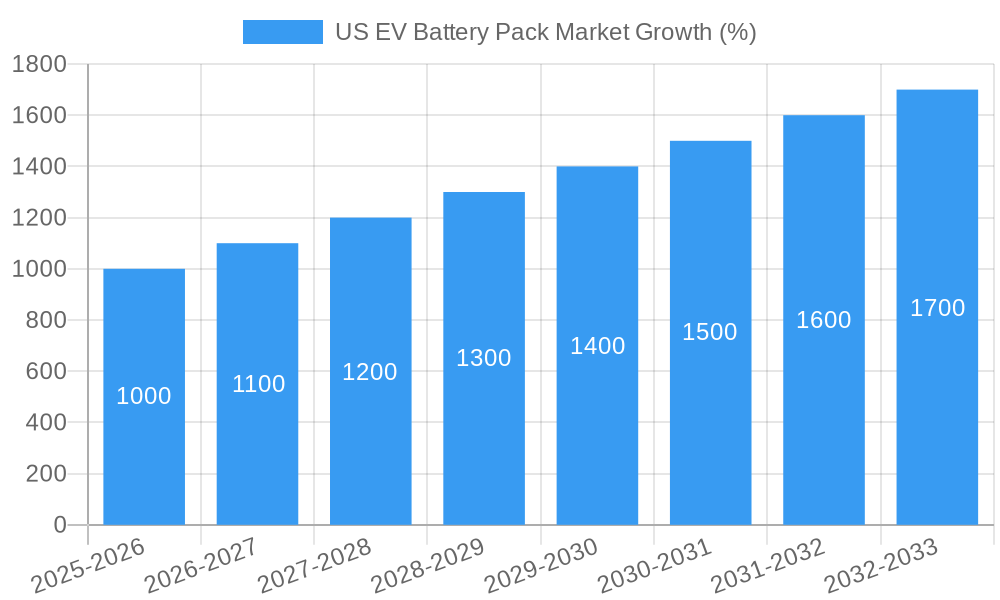
The US EV battery pack market is experiencing robust growth, driven by increasing electric vehicle adoption fueled by government incentives, environmental concerns, and advancements in battery technology. The market's Compound Annual Growth Rate (CAGR) exceeding 6.50% indicates a significant expansion from 2019 to 2033. Several factors contribute to this growth, including the rising demand for BEVs (Battery Electric Vehicles) and PHEVs (Plug-in Hybrid Electric Vehicles) across various vehicle segments like passenger cars, light commercial vehicles (LCVs), and buses. Technological advancements in battery chemistry (like the adoption of high-energy density NCM and NCA chemistries), battery form factors (pouch and prismatic cells gaining popularity), and manufacturing processes (laser welding for improved safety and efficiency) are further propelling market expansion. The market is segmented by battery capacity (with significant demand in the 40-80 kWh range), battery chemistry, form factor, and vehicle type. Key players like Samsung SDI, LG Energy Solution, CATL, and Tesla are actively investing in production capacity and technological innovation to meet this surging demand. While challenges remain, such as raw material price volatility and supply chain disruptions, the overall outlook for the US EV battery pack market remains positive, with substantial growth expected throughout the forecast period.
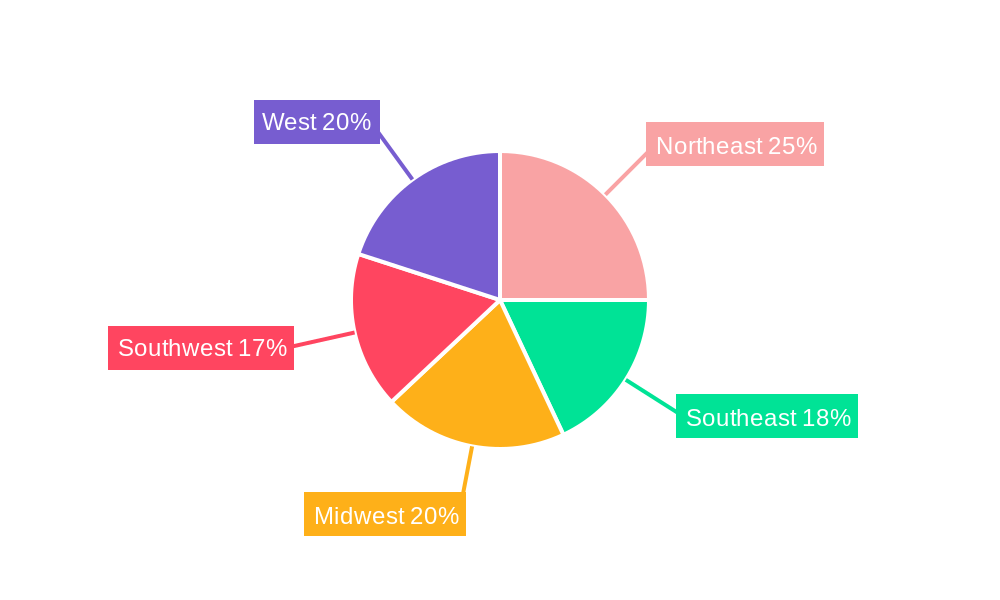
The regional distribution within the US market shows varying levels of adoption across different regions, with states like California and those in the Northeast experiencing higher demand due to stricter emission regulations and greater awareness of electric mobility. The Midwest and South are showing increasing growth as charging infrastructure improves and affordability increases. Competition among battery manufacturers is intense, leading to innovations in battery performance, cost reduction, and improved lifecycle management. The ongoing focus on sustainable sourcing of raw materials and responsible battery recycling will be crucial for long-term market sustainability. The market’s growth is directly linked to the overall success of the electric vehicle industry, making this a highly dynamic and impactful sector with significant potential for future investment and innovation.
US EV Battery Pack Market: A Comprehensive Report (2019-2033)
This in-depth report provides a comprehensive analysis of the US EV battery pack market, covering historical data (2019-2024), the base year (2025), and a detailed forecast (2025-2033). The report offers invaluable insights into market trends, competitive dynamics, and future growth opportunities, empowering stakeholders to make informed strategic decisions. The study delves into various segments, including battery chemistry, capacity, form factor, production method, components, materials, vehicle body type, and propulsion type. Key players like Samsung SDI, LG Energy Solution, CATL, and Tesla are profiled, offering a clear understanding of the market landscape.
US EV Battery Pack Market Structure & Competitive Dynamics
The US EV battery pack market exhibits a moderately concentrated structure, with a few dominant players holding significant market share. The competitive landscape is dynamic, characterized by intense innovation and strategic partnerships. Regulatory frameworks, such as those promoting domestic battery production and incentivizing EV adoption, significantly influence market dynamics. Product substitution, primarily from advancements in battery chemistry and technology, also shapes the competitive landscape. End-user trends, focusing on range anxiety, charging infrastructure, and affordability, impact demand. Mergers and acquisitions (M&A) are prevalent, with deal values exceeding xx Million in recent years.
- Market Concentration: The top five players account for approximately xx% of the market share in 2025.
- Innovation Ecosystems: Collaboration between battery manufacturers, automotive OEMs, and material suppliers drives innovation.
- Regulatory Frameworks: The Inflation Reduction Act and state-level incentives influence battery production and adoption.
- M&A Activity: Significant M&A activity has been observed, including strategic alliances and acquisitions of smaller battery technology companies. Total M&A deal value in the last 5 years is estimated at xx Million.
US EV Battery Pack Market Industry Trends & Insights
The US EV battery pack market is experiencing robust growth, driven by increasing EV sales, government support for electric mobility, and technological advancements in battery technology. The Compound Annual Growth Rate (CAGR) is projected to be xx% during the forecast period (2025-2033). Market penetration of EVs continues to increase, further fueling demand for battery packs. Consumer preferences are shifting towards longer-range EVs with improved charging times, prompting innovations in battery chemistry and design. Competitive dynamics remain fierce, with manufacturers investing heavily in R&D to enhance battery performance and reduce costs. Technological disruptions, such as the development of solid-state batteries and improved battery management systems, promise to reshape the market landscape.
Dominant Markets & Segments in US EV Battery Pack Market
The passenger car segment dominates the US EV battery pack market, driven by rising consumer demand and government incentives. Within battery chemistry, NCM and NMC chemistries hold a significant market share, though LFP chemistry is gaining traction due to its cost-effectiveness and improved performance. High-capacity battery packs (above 80 kWh) are experiencing strong growth, reflecting consumer preference for extended driving ranges. Prismatic battery form factors are widely adopted due to their suitability for various vehicle architectures. The use of wire bonding methods for battery cell connections remains prevalent. Lithium, Nickel, and Cobalt are dominant material types. California is the leading market within the US.
- Key Drivers for Passenger Car Segment Dominance:
- Increasing consumer adoption of EVs.
- Government incentives and regulations promoting EV adoption.
- Expanding charging infrastructure.
- Key Drivers for NCM/NMC Chemistry Dominance:
- High energy density and performance.
- Suitability for various vehicle applications.
- Key Drivers for High-Capacity Battery Pack Growth:
- Consumer demand for extended driving ranges.
- Technological advancements enabling higher energy density.
US EV Battery Pack Market Product Innovations
Recent innovations focus on enhancing energy density, improving thermal management, extending lifespan, and reducing costs. Solid-state batteries are emerging as a promising technology, offering superior safety and energy density. Advanced battery management systems (BMS) optimize battery performance and extend lifespan. The development of next-generation battery chemistries and improved manufacturing processes are aimed at increasing affordability and scalability. These innovations are driving market penetration and enhancing the competitiveness of EV battery packs.
Report Segmentation & Scope
This report segments the US EV battery pack market based on several key parameters:
- Battery Chemistry: LFP, NCA, NCM, NMC, Others (Market size and growth projections are provided for each chemistry).
- Capacity: Less than 15 kWh, 15 kWh to 40 kWh, 40 kWh to 80 kWh, Above 80 kWh (Market size and growth projections are detailed for each capacity range).
- Battery Form: Cylindrical, Pouch, Prismatic (Market share and competitive dynamics are analyzed for each form factor).
- Method: Laser, Wire (Analysis of adoption rates and technological advancements is provided).
- Component: Anode, Cathode, Electrolyte, Separator (Market trends and technological advancements in each component are discussed).
- Material Type: Cobalt, Lithium, Manganese, Natural Graphite, Nickel, Other Materials (Supply chain dynamics and market outlook for each material type are explored).
- Body Type: Passenger Car, LCV, M&HDT, Bus (Market size and growth projections for each vehicle type are given).
- Propulsion Type: BEV, PHEV (Market share and future outlook for both propulsion types are analyzed).
Key Drivers of US EV Battery Pack Market Growth
The US EV battery pack market is fueled by several key factors:
- Government Policies and Incentives: The Inflation Reduction Act and state-level incentives significantly boost EV adoption.
- Technological Advancements: Innovations in battery chemistry and manufacturing processes enhance performance and reduce costs.
- Increasing Environmental Concerns: Growing awareness of climate change and air pollution drives demand for EVs.
- Falling Battery Costs: Continuous advancements reduce battery pack prices, making EVs more affordable.
Challenges in the US EV Battery Pack Market Sector
The market faces several challenges:
- Supply Chain Disruptions: Reliance on critical raw materials like lithium and cobalt creates vulnerabilities.
- Raw Material Price Volatility: Fluctuations in raw material prices impact battery pack costs and profitability.
- Battery Recycling and Disposal: Effective battery recycling infrastructure is crucial for environmental sustainability.
- Safety Concerns: Addressing safety concerns related to battery fires and thermal runaway remains critical.
Leading Players in the US EV Battery Pack Market Market
- Samsung SDI Co Ltd
- LG Energy Solution Ltd
- Imperium3 New York (IM3NY)
- Contemporary Amperex Technology Co Ltd (CATL)
- Tesla Inc
- SK Innovation Co Ltd
- Ambri Inc
- Sila Nanotechnologies Inc
- Panasonic Holdings Corporation
- Envision AESC Japan Co Ltd
Key Developments in US EV Battery Pack Market Sector
- June 2023: CATL commits USD 1.4 Billion to develop lithium reserves in Bolivia, signaling increased investment in raw material sourcing.
- March 2023: Tesla explores building a battery factory in the U.S. with CATL, indicating potential expansion of domestic manufacturing.
- January 2023: Tesla invests USD 3.6 Billion to expand Gigafactory Nevada, including a 100 GWh 4680 cell factory, demonstrating significant capacity expansion.
Strategic US EV Battery Pack Market Outlook
The US EV battery pack market holds immense potential, driven by sustained EV adoption, technological progress, and supportive government policies. Strategic opportunities exist for companies focused on developing next-generation battery technologies, improving supply chain resilience, and enhancing battery recycling capabilities. The market is poised for significant growth, offering substantial returns for players who can effectively navigate the evolving landscape and capitalize on emerging trends.
US EV Battery Pack Market Segmentation
-
1. Body Type
- 1.1. Bus
- 1.2. LCV
- 1.3. M&HDT
- 1.4. Passenger Car
-
2. Propulsion Type
- 2.1. BEV
- 2.2. PHEV
-
3. Battery Chemistry
- 3.1. LFP
- 3.2. NCA
- 3.3. NCM
- 3.4. NMC
- 3.5. Others
-
4. Capacity
- 4.1. 15 kWh to 40 kWh
- 4.2. 40 kWh to 80 kWh
- 4.3. Above 80 kWh
- 4.4. Less than 15 kWh
-
5. Battery Form
- 5.1. Cylindrical
- 5.2. Pouch
- 5.3. Prismatic
-
6. Method
- 6.1. Laser
- 6.2. Wire
-
7. Component
- 7.1. Anode
- 7.2. Cathode
- 7.3. Electrolyte
- 7.4. Separator
-
8. Material Type
- 8.1. Cobalt
- 8.2. Lithium
- 8.3. Manganese
- 8.4. Natural Graphite
- 8.5. Nickel
- 8.6. Other Materials
US EV Battery Pack Market Segmentation By Geography
-
1. North America
- 1.1. United States
- 1.2. Canada
- 1.3. Mexico
-
2. South America
- 2.1. Brazil
- 2.2. Argentina
- 2.3. Rest of South America
-
3. Europe
- 3.1. United Kingdom
- 3.2. Germany
- 3.3. France
- 3.4. Italy
- 3.5. Spain
- 3.6. Russia
- 3.7. Benelux
- 3.8. Nordics
- 3.9. Rest of Europe
-
4. Middle East & Africa
- 4.1. Turkey
- 4.2. Israel
- 4.3. GCC
- 4.4. North Africa
- 4.5. South Africa
- 4.6. Rest of Middle East & Africa
-
5. Asia Pacific
- 5.1. China
- 5.2. India
- 5.3. Japan
- 5.4. South Korea
- 5.5. ASEAN
- 5.6. Oceania
- 5.7. Rest of Asia Pacific
US EV Battery Pack Market REPORT HIGHLIGHTS
| Aspects | Details |
|---|---|
| Study Period | 2019-2033 |
| Base Year | 2024 |
| Estimated Year | 2025 |
| Forecast Period | 2025-2033 |
| Historical Period | 2019-2024 |
| Growth Rate | CAGR of > 6.50% from 2019-2033 |
| Segmentation |
|
Table of Contents
- 1. Introduction
- 1.1. Research Scope
- 1.2. Market Segmentation
- 1.3. Research Methodology
- 1.4. Definitions and Assumptions
- 2. Executive Summary
- 2.1. Introduction
- 3. Market Dynamics
- 3.1. Introduction
- 3.2. Market Drivers
- 3.2.1. Increasing Demand and Sales of Commercial Vehicles is Driving the Market for Hydraulic Systems
- 3.3. Market Restrains
- 3.3.1. Increasing Replacement of Conventional Hydraulic Systems with Fully-electric Hydraulic Systems Acts as a Restraint
- 3.4. Market Trends
- 3.4.1. OTHER KEY INDUSTRY TRENDS COVERED IN THE REPORT
- 4. Market Factor Analysis
- 4.1. Porters Five Forces
- 4.2. Supply/Value Chain
- 4.3. PESTEL analysis
- 4.4. Market Entropy
- 4.5. Patent/Trademark Analysis
- 5. Global US EV Battery Pack Market Analysis, Insights and Forecast, 2019-2031
- 5.1. Market Analysis, Insights and Forecast - by Body Type
- 5.1.1. Bus
- 5.1.2. LCV
- 5.1.3. M&HDT
- 5.1.4. Passenger Car
- 5.2. Market Analysis, Insights and Forecast - by Propulsion Type
- 5.2.1. BEV
- 5.2.2. PHEV
- 5.3. Market Analysis, Insights and Forecast - by Battery Chemistry
- 5.3.1. LFP
- 5.3.2. NCA
- 5.3.3. NCM
- 5.3.4. NMC
- 5.3.5. Others
- 5.4. Market Analysis, Insights and Forecast - by Capacity
- 5.4.1. 15 kWh to 40 kWh
- 5.4.2. 40 kWh to 80 kWh
- 5.4.3. Above 80 kWh
- 5.4.4. Less than 15 kWh
- 5.5. Market Analysis, Insights and Forecast - by Battery Form
- 5.5.1. Cylindrical
- 5.5.2. Pouch
- 5.5.3. Prismatic
- 5.6. Market Analysis, Insights and Forecast - by Method
- 5.6.1. Laser
- 5.6.2. Wire
- 5.7. Market Analysis, Insights and Forecast - by Component
- 5.7.1. Anode
- 5.7.2. Cathode
- 5.7.3. Electrolyte
- 5.7.4. Separator
- 5.8. Market Analysis, Insights and Forecast - by Material Type
- 5.8.1. Cobalt
- 5.8.2. Lithium
- 5.8.3. Manganese
- 5.8.4. Natural Graphite
- 5.8.5. Nickel
- 5.8.6. Other Materials
- 5.9. Market Analysis, Insights and Forecast - by Region
- 5.9.1. North America
- 5.9.2. South America
- 5.9.3. Europe
- 5.9.4. Middle East & Africa
- 5.9.5. Asia Pacific
- 5.1. Market Analysis, Insights and Forecast - by Body Type
- 6. North America US EV Battery Pack Market Analysis, Insights and Forecast, 2019-2031
- 6.1. Market Analysis, Insights and Forecast - by Body Type
- 6.1.1. Bus
- 6.1.2. LCV
- 6.1.3. M&HDT
- 6.1.4. Passenger Car
- 6.2. Market Analysis, Insights and Forecast - by Propulsion Type
- 6.2.1. BEV
- 6.2.2. PHEV
- 6.3. Market Analysis, Insights and Forecast - by Battery Chemistry
- 6.3.1. LFP
- 6.3.2. NCA
- 6.3.3. NCM
- 6.3.4. NMC
- 6.3.5. Others
- 6.4. Market Analysis, Insights and Forecast - by Capacity
- 6.4.1. 15 kWh to 40 kWh
- 6.4.2. 40 kWh to 80 kWh
- 6.4.3. Above 80 kWh
- 6.4.4. Less than 15 kWh
- 6.5. Market Analysis, Insights and Forecast - by Battery Form
- 6.5.1. Cylindrical
- 6.5.2. Pouch
- 6.5.3. Prismatic
- 6.6. Market Analysis, Insights and Forecast - by Method
- 6.6.1. Laser
- 6.6.2. Wire
- 6.7. Market Analysis, Insights and Forecast - by Component
- 6.7.1. Anode
- 6.7.2. Cathode
- 6.7.3. Electrolyte
- 6.7.4. Separator
- 6.8. Market Analysis, Insights and Forecast - by Material Type
- 6.8.1. Cobalt
- 6.8.2. Lithium
- 6.8.3. Manganese
- 6.8.4. Natural Graphite
- 6.8.5. Nickel
- 6.8.6. Other Materials
- 6.1. Market Analysis, Insights and Forecast - by Body Type
- 7. South America US EV Battery Pack Market Analysis, Insights and Forecast, 2019-2031
- 7.1. Market Analysis, Insights and Forecast - by Body Type
- 7.1.1. Bus
- 7.1.2. LCV
- 7.1.3. M&HDT
- 7.1.4. Passenger Car
- 7.2. Market Analysis, Insights and Forecast - by Propulsion Type
- 7.2.1. BEV
- 7.2.2. PHEV
- 7.3. Market Analysis, Insights and Forecast - by Battery Chemistry
- 7.3.1. LFP
- 7.3.2. NCA
- 7.3.3. NCM
- 7.3.4. NMC
- 7.3.5. Others
- 7.4. Market Analysis, Insights and Forecast - by Capacity
- 7.4.1. 15 kWh to 40 kWh
- 7.4.2. 40 kWh to 80 kWh
- 7.4.3. Above 80 kWh
- 7.4.4. Less than 15 kWh
- 7.5. Market Analysis, Insights and Forecast - by Battery Form
- 7.5.1. Cylindrical
- 7.5.2. Pouch
- 7.5.3. Prismatic
- 7.6. Market Analysis, Insights and Forecast - by Method
- 7.6.1. Laser
- 7.6.2. Wire
- 7.7. Market Analysis, Insights and Forecast - by Component
- 7.7.1. Anode
- 7.7.2. Cathode
- 7.7.3. Electrolyte
- 7.7.4. Separator
- 7.8. Market Analysis, Insights and Forecast - by Material Type
- 7.8.1. Cobalt
- 7.8.2. Lithium
- 7.8.3. Manganese
- 7.8.4. Natural Graphite
- 7.8.5. Nickel
- 7.8.6. Other Materials
- 7.1. Market Analysis, Insights and Forecast - by Body Type
- 8. Europe US EV Battery Pack Market Analysis, Insights and Forecast, 2019-2031
- 8.1. Market Analysis, Insights and Forecast - by Body Type
- 8.1.1. Bus
- 8.1.2. LCV
- 8.1.3. M&HDT
- 8.1.4. Passenger Car
- 8.2. Market Analysis, Insights and Forecast - by Propulsion Type
- 8.2.1. BEV
- 8.2.2. PHEV
- 8.3. Market Analysis, Insights and Forecast - by Battery Chemistry
- 8.3.1. LFP
- 8.3.2. NCA
- 8.3.3. NCM
- 8.3.4. NMC
- 8.3.5. Others
- 8.4. Market Analysis, Insights and Forecast - by Capacity
- 8.4.1. 15 kWh to 40 kWh
- 8.4.2. 40 kWh to 80 kWh
- 8.4.3. Above 80 kWh
- 8.4.4. Less than 15 kWh
- 8.5. Market Analysis, Insights and Forecast - by Battery Form
- 8.5.1. Cylindrical
- 8.5.2. Pouch
- 8.5.3. Prismatic
- 8.6. Market Analysis, Insights and Forecast - by Method
- 8.6.1. Laser
- 8.6.2. Wire
- 8.7. Market Analysis, Insights and Forecast - by Component
- 8.7.1. Anode
- 8.7.2. Cathode
- 8.7.3. Electrolyte
- 8.7.4. Separator
- 8.8. Market Analysis, Insights and Forecast - by Material Type
- 8.8.1. Cobalt
- 8.8.2. Lithium
- 8.8.3. Manganese
- 8.8.4. Natural Graphite
- 8.8.5. Nickel
- 8.8.6. Other Materials
- 8.1. Market Analysis, Insights and Forecast - by Body Type
- 9. Middle East & Africa US EV Battery Pack Market Analysis, Insights and Forecast, 2019-2031
- 9.1. Market Analysis, Insights and Forecast - by Body Type
- 9.1.1. Bus
- 9.1.2. LCV
- 9.1.3. M&HDT
- 9.1.4. Passenger Car
- 9.2. Market Analysis, Insights and Forecast - by Propulsion Type
- 9.2.1. BEV
- 9.2.2. PHEV
- 9.3. Market Analysis, Insights and Forecast - by Battery Chemistry
- 9.3.1. LFP
- 9.3.2. NCA
- 9.3.3. NCM
- 9.3.4. NMC
- 9.3.5. Others
- 9.4. Market Analysis, Insights and Forecast - by Capacity
- 9.4.1. 15 kWh to 40 kWh
- 9.4.2. 40 kWh to 80 kWh
- 9.4.3. Above 80 kWh
- 9.4.4. Less than 15 kWh
- 9.5. Market Analysis, Insights and Forecast - by Battery Form
- 9.5.1. Cylindrical
- 9.5.2. Pouch
- 9.5.3. Prismatic
- 9.6. Market Analysis, Insights and Forecast - by Method
- 9.6.1. Laser
- 9.6.2. Wire
- 9.7. Market Analysis, Insights and Forecast - by Component
- 9.7.1. Anode
- 9.7.2. Cathode
- 9.7.3. Electrolyte
- 9.7.4. Separator
- 9.8. Market Analysis, Insights and Forecast - by Material Type
- 9.8.1. Cobalt
- 9.8.2. Lithium
- 9.8.3. Manganese
- 9.8.4. Natural Graphite
- 9.8.5. Nickel
- 9.8.6. Other Materials
- 9.1. Market Analysis, Insights and Forecast - by Body Type
- 10. Asia Pacific US EV Battery Pack Market Analysis, Insights and Forecast, 2019-2031
- 10.1. Market Analysis, Insights and Forecast - by Body Type
- 10.1.1. Bus
- 10.1.2. LCV
- 10.1.3. M&HDT
- 10.1.4. Passenger Car
- 10.2. Market Analysis, Insights and Forecast - by Propulsion Type
- 10.2.1. BEV
- 10.2.2. PHEV
- 10.3. Market Analysis, Insights and Forecast - by Battery Chemistry
- 10.3.1. LFP
- 10.3.2. NCA
- 10.3.3. NCM
- 10.3.4. NMC
- 10.3.5. Others
- 10.4. Market Analysis, Insights and Forecast - by Capacity
- 10.4.1. 15 kWh to 40 kWh
- 10.4.2. 40 kWh to 80 kWh
- 10.4.3. Above 80 kWh
- 10.4.4. Less than 15 kWh
- 10.5. Market Analysis, Insights and Forecast - by Battery Form
- 10.5.1. Cylindrical
- 10.5.2. Pouch
- 10.5.3. Prismatic
- 10.6. Market Analysis, Insights and Forecast - by Method
- 10.6.1. Laser
- 10.6.2. Wire
- 10.7. Market Analysis, Insights and Forecast - by Component
- 10.7.1. Anode
- 10.7.2. Cathode
- 10.7.3. Electrolyte
- 10.7.4. Separator
- 10.8. Market Analysis, Insights and Forecast - by Material Type
- 10.8.1. Cobalt
- 10.8.2. Lithium
- 10.8.3. Manganese
- 10.8.4. Natural Graphite
- 10.8.5. Nickel
- 10.8.6. Other Materials
- 10.1. Market Analysis, Insights and Forecast - by Body Type
- 11. Northeast US EV Battery Pack Market Analysis, Insights and Forecast, 2019-2031
- 12. Southeast US EV Battery Pack Market Analysis, Insights and Forecast, 2019-2031
- 13. Midwest US EV Battery Pack Market Analysis, Insights and Forecast, 2019-2031
- 14. Southwest US EV Battery Pack Market Analysis, Insights and Forecast, 2019-2031
- 15. West US EV Battery Pack Market Analysis, Insights and Forecast, 2019-2031
- 16. Competitive Analysis
- 16.1. Global Market Share Analysis 2024
- 16.2. Company Profiles
- 16.2.1 Samsung SDI Co Ltd
- 16.2.1.1. Overview
- 16.2.1.2. Products
- 16.2.1.3. SWOT Analysis
- 16.2.1.4. Recent Developments
- 16.2.1.5. Financials (Based on Availability)
- 16.2.2 LG Energy Solution Ltd
- 16.2.2.1. Overview
- 16.2.2.2. Products
- 16.2.2.3. SWOT Analysis
- 16.2.2.4. Recent Developments
- 16.2.2.5. Financials (Based on Availability)
- 16.2.3 Imperium3 New York (IM3NY)
- 16.2.3.1. Overview
- 16.2.3.2. Products
- 16.2.3.3. SWOT Analysis
- 16.2.3.4. Recent Developments
- 16.2.3.5. Financials (Based on Availability)
- 16.2.4 Contemporary Amperex Technology Co Ltd (CATL)
- 16.2.4.1. Overview
- 16.2.4.2. Products
- 16.2.4.3. SWOT Analysis
- 16.2.4.4. Recent Developments
- 16.2.4.5. Financials (Based on Availability)
- 16.2.5 Tesla Inc
- 16.2.5.1. Overview
- 16.2.5.2. Products
- 16.2.5.3. SWOT Analysis
- 16.2.5.4. Recent Developments
- 16.2.5.5. Financials (Based on Availability)
- 16.2.6 SK Innovation Co Ltd
- 16.2.6.1. Overview
- 16.2.6.2. Products
- 16.2.6.3. SWOT Analysis
- 16.2.6.4. Recent Developments
- 16.2.6.5. Financials (Based on Availability)
- 16.2.7 Ambri Inc
- 16.2.7.1. Overview
- 16.2.7.2. Products
- 16.2.7.3. SWOT Analysis
- 16.2.7.4. Recent Developments
- 16.2.7.5. Financials (Based on Availability)
- 16.2.8 Sila Nanotechnologies Inc
- 16.2.8.1. Overview
- 16.2.8.2. Products
- 16.2.8.3. SWOT Analysis
- 16.2.8.4. Recent Developments
- 16.2.8.5. Financials (Based on Availability)
- 16.2.9 Panasonic Holdings Corporation
- 16.2.9.1. Overview
- 16.2.9.2. Products
- 16.2.9.3. SWOT Analysis
- 16.2.9.4. Recent Developments
- 16.2.9.5. Financials (Based on Availability)
- 16.2.10 Envision AESC Japan Co Ltd
- 16.2.10.1. Overview
- 16.2.10.2. Products
- 16.2.10.3. SWOT Analysis
- 16.2.10.4. Recent Developments
- 16.2.10.5. Financials (Based on Availability)
- 16.2.1 Samsung SDI Co Ltd
List of Figures
- Figure 1: Global US EV Battery Pack Market Revenue Breakdown (Million, %) by Region 2024 & 2032
- Figure 2: United states US EV Battery Pack Market Revenue (Million), by Country 2024 & 2032
- Figure 3: United states US EV Battery Pack Market Revenue Share (%), by Country 2024 & 2032
- Figure 4: North America US EV Battery Pack Market Revenue (Million), by Body Type 2024 & 2032
- Figure 5: North America US EV Battery Pack Market Revenue Share (%), by Body Type 2024 & 2032
- Figure 6: North America US EV Battery Pack Market Revenue (Million), by Propulsion Type 2024 & 2032
- Figure 7: North America US EV Battery Pack Market Revenue Share (%), by Propulsion Type 2024 & 2032
- Figure 8: North America US EV Battery Pack Market Revenue (Million), by Battery Chemistry 2024 & 2032
- Figure 9: North America US EV Battery Pack Market Revenue Share (%), by Battery Chemistry 2024 & 2032
- Figure 10: North America US EV Battery Pack Market Revenue (Million), by Capacity 2024 & 2032
- Figure 11: North America US EV Battery Pack Market Revenue Share (%), by Capacity 2024 & 2032
- Figure 12: North America US EV Battery Pack Market Revenue (Million), by Battery Form 2024 & 2032
- Figure 13: North America US EV Battery Pack Market Revenue Share (%), by Battery Form 2024 & 2032
- Figure 14: North America US EV Battery Pack Market Revenue (Million), by Method 2024 & 2032
- Figure 15: North America US EV Battery Pack Market Revenue Share (%), by Method 2024 & 2032
- Figure 16: North America US EV Battery Pack Market Revenue (Million), by Component 2024 & 2032
- Figure 17: North America US EV Battery Pack Market Revenue Share (%), by Component 2024 & 2032
- Figure 18: North America US EV Battery Pack Market Revenue (Million), by Material Type 2024 & 2032
- Figure 19: North America US EV Battery Pack Market Revenue Share (%), by Material Type 2024 & 2032
- Figure 20: North America US EV Battery Pack Market Revenue (Million), by Country 2024 & 2032
- Figure 21: North America US EV Battery Pack Market Revenue Share (%), by Country 2024 & 2032
- Figure 22: South America US EV Battery Pack Market Revenue (Million), by Body Type 2024 & 2032
- Figure 23: South America US EV Battery Pack Market Revenue Share (%), by Body Type 2024 & 2032
- Figure 24: South America US EV Battery Pack Market Revenue (Million), by Propulsion Type 2024 & 2032
- Figure 25: South America US EV Battery Pack Market Revenue Share (%), by Propulsion Type 2024 & 2032
- Figure 26: South America US EV Battery Pack Market Revenue (Million), by Battery Chemistry 2024 & 2032
- Figure 27: South America US EV Battery Pack Market Revenue Share (%), by Battery Chemistry 2024 & 2032
- Figure 28: South America US EV Battery Pack Market Revenue (Million), by Capacity 2024 & 2032
- Figure 29: South America US EV Battery Pack Market Revenue Share (%), by Capacity 2024 & 2032
- Figure 30: South America US EV Battery Pack Market Revenue (Million), by Battery Form 2024 & 2032
- Figure 31: South America US EV Battery Pack Market Revenue Share (%), by Battery Form 2024 & 2032
- Figure 32: South America US EV Battery Pack Market Revenue (Million), by Method 2024 & 2032
- Figure 33: South America US EV Battery Pack Market Revenue Share (%), by Method 2024 & 2032
- Figure 34: South America US EV Battery Pack Market Revenue (Million), by Component 2024 & 2032
- Figure 35: South America US EV Battery Pack Market Revenue Share (%), by Component 2024 & 2032
- Figure 36: South America US EV Battery Pack Market Revenue (Million), by Material Type 2024 & 2032
- Figure 37: South America US EV Battery Pack Market Revenue Share (%), by Material Type 2024 & 2032
- Figure 38: South America US EV Battery Pack Market Revenue (Million), by Country 2024 & 2032
- Figure 39: South America US EV Battery Pack Market Revenue Share (%), by Country 2024 & 2032
- Figure 40: Europe US EV Battery Pack Market Revenue (Million), by Body Type 2024 & 2032
- Figure 41: Europe US EV Battery Pack Market Revenue Share (%), by Body Type 2024 & 2032
- Figure 42: Europe US EV Battery Pack Market Revenue (Million), by Propulsion Type 2024 & 2032
- Figure 43: Europe US EV Battery Pack Market Revenue Share (%), by Propulsion Type 2024 & 2032
- Figure 44: Europe US EV Battery Pack Market Revenue (Million), by Battery Chemistry 2024 & 2032
- Figure 45: Europe US EV Battery Pack Market Revenue Share (%), by Battery Chemistry 2024 & 2032
- Figure 46: Europe US EV Battery Pack Market Revenue (Million), by Capacity 2024 & 2032
- Figure 47: Europe US EV Battery Pack Market Revenue Share (%), by Capacity 2024 & 2032
- Figure 48: Europe US EV Battery Pack Market Revenue (Million), by Battery Form 2024 & 2032
- Figure 49: Europe US EV Battery Pack Market Revenue Share (%), by Battery Form 2024 & 2032
- Figure 50: Europe US EV Battery Pack Market Revenue (Million), by Method 2024 & 2032
- Figure 51: Europe US EV Battery Pack Market Revenue Share (%), by Method 2024 & 2032
- Figure 52: Europe US EV Battery Pack Market Revenue (Million), by Component 2024 & 2032
- Figure 53: Europe US EV Battery Pack Market Revenue Share (%), by Component 2024 & 2032
- Figure 54: Europe US EV Battery Pack Market Revenue (Million), by Material Type 2024 & 2032
- Figure 55: Europe US EV Battery Pack Market Revenue Share (%), by Material Type 2024 & 2032
- Figure 56: Europe US EV Battery Pack Market Revenue (Million), by Country 2024 & 2032
- Figure 57: Europe US EV Battery Pack Market Revenue Share (%), by Country 2024 & 2032
- Figure 58: Middle East & Africa US EV Battery Pack Market Revenue (Million), by Body Type 2024 & 2032
- Figure 59: Middle East & Africa US EV Battery Pack Market Revenue Share (%), by Body Type 2024 & 2032
- Figure 60: Middle East & Africa US EV Battery Pack Market Revenue (Million), by Propulsion Type 2024 & 2032
- Figure 61: Middle East & Africa US EV Battery Pack Market Revenue Share (%), by Propulsion Type 2024 & 2032
- Figure 62: Middle East & Africa US EV Battery Pack Market Revenue (Million), by Battery Chemistry 2024 & 2032
- Figure 63: Middle East & Africa US EV Battery Pack Market Revenue Share (%), by Battery Chemistry 2024 & 2032
- Figure 64: Middle East & Africa US EV Battery Pack Market Revenue (Million), by Capacity 2024 & 2032
- Figure 65: Middle East & Africa US EV Battery Pack Market Revenue Share (%), by Capacity 2024 & 2032
- Figure 66: Middle East & Africa US EV Battery Pack Market Revenue (Million), by Battery Form 2024 & 2032
- Figure 67: Middle East & Africa US EV Battery Pack Market Revenue Share (%), by Battery Form 2024 & 2032
- Figure 68: Middle East & Africa US EV Battery Pack Market Revenue (Million), by Method 2024 & 2032
- Figure 69: Middle East & Africa US EV Battery Pack Market Revenue Share (%), by Method 2024 & 2032
- Figure 70: Middle East & Africa US EV Battery Pack Market Revenue (Million), by Component 2024 & 2032
- Figure 71: Middle East & Africa US EV Battery Pack Market Revenue Share (%), by Component 2024 & 2032
- Figure 72: Middle East & Africa US EV Battery Pack Market Revenue (Million), by Material Type 2024 & 2032
- Figure 73: Middle East & Africa US EV Battery Pack Market Revenue Share (%), by Material Type 2024 & 2032
- Figure 74: Middle East & Africa US EV Battery Pack Market Revenue (Million), by Country 2024 & 2032
- Figure 75: Middle East & Africa US EV Battery Pack Market Revenue Share (%), by Country 2024 & 2032
- Figure 76: Asia Pacific US EV Battery Pack Market Revenue (Million), by Body Type 2024 & 2032
- Figure 77: Asia Pacific US EV Battery Pack Market Revenue Share (%), by Body Type 2024 & 2032
- Figure 78: Asia Pacific US EV Battery Pack Market Revenue (Million), by Propulsion Type 2024 & 2032
- Figure 79: Asia Pacific US EV Battery Pack Market Revenue Share (%), by Propulsion Type 2024 & 2032
- Figure 80: Asia Pacific US EV Battery Pack Market Revenue (Million), by Battery Chemistry 2024 & 2032
- Figure 81: Asia Pacific US EV Battery Pack Market Revenue Share (%), by Battery Chemistry 2024 & 2032
- Figure 82: Asia Pacific US EV Battery Pack Market Revenue (Million), by Capacity 2024 & 2032
- Figure 83: Asia Pacific US EV Battery Pack Market Revenue Share (%), by Capacity 2024 & 2032
- Figure 84: Asia Pacific US EV Battery Pack Market Revenue (Million), by Battery Form 2024 & 2032
- Figure 85: Asia Pacific US EV Battery Pack Market Revenue Share (%), by Battery Form 2024 & 2032
- Figure 86: Asia Pacific US EV Battery Pack Market Revenue (Million), by Method 2024 & 2032
- Figure 87: Asia Pacific US EV Battery Pack Market Revenue Share (%), by Method 2024 & 2032
- Figure 88: Asia Pacific US EV Battery Pack Market Revenue (Million), by Component 2024 & 2032
- Figure 89: Asia Pacific US EV Battery Pack Market Revenue Share (%), by Component 2024 & 2032
- Figure 90: Asia Pacific US EV Battery Pack Market Revenue (Million), by Material Type 2024 & 2032
- Figure 91: Asia Pacific US EV Battery Pack Market Revenue Share (%), by Material Type 2024 & 2032
- Figure 92: Asia Pacific US EV Battery Pack Market Revenue (Million), by Country 2024 & 2032
- Figure 93: Asia Pacific US EV Battery Pack Market Revenue Share (%), by Country 2024 & 2032
List of Tables
- Table 1: Global US EV Battery Pack Market Revenue Million Forecast, by Region 2019 & 2032
- Table 2: Global US EV Battery Pack Market Revenue Million Forecast, by Body Type 2019 & 2032
- Table 3: Global US EV Battery Pack Market Revenue Million Forecast, by Propulsion Type 2019 & 2032
- Table 4: Global US EV Battery Pack Market Revenue Million Forecast, by Battery Chemistry 2019 & 2032
- Table 5: Global US EV Battery Pack Market Revenue Million Forecast, by Capacity 2019 & 2032
- Table 6: Global US EV Battery Pack Market Revenue Million Forecast, by Battery Form 2019 & 2032
- Table 7: Global US EV Battery Pack Market Revenue Million Forecast, by Method 2019 & 2032
- Table 8: Global US EV Battery Pack Market Revenue Million Forecast, by Component 2019 & 2032
- Table 9: Global US EV Battery Pack Market Revenue Million Forecast, by Material Type 2019 & 2032
- Table 10: Global US EV Battery Pack Market Revenue Million Forecast, by Region 2019 & 2032
- Table 11: Global US EV Battery Pack Market Revenue Million Forecast, by Country 2019 & 2032
- Table 12: Northeast US EV Battery Pack Market Revenue (Million) Forecast, by Application 2019 & 2032
- Table 13: Southeast US EV Battery Pack Market Revenue (Million) Forecast, by Application 2019 & 2032
- Table 14: Midwest US EV Battery Pack Market Revenue (Million) Forecast, by Application 2019 & 2032
- Table 15: Southwest US EV Battery Pack Market Revenue (Million) Forecast, by Application 2019 & 2032
- Table 16: West US EV Battery Pack Market Revenue (Million) Forecast, by Application 2019 & 2032
- Table 17: Global US EV Battery Pack Market Revenue Million Forecast, by Body Type 2019 & 2032
- Table 18: Global US EV Battery Pack Market Revenue Million Forecast, by Propulsion Type 2019 & 2032
- Table 19: Global US EV Battery Pack Market Revenue Million Forecast, by Battery Chemistry 2019 & 2032
- Table 20: Global US EV Battery Pack Market Revenue Million Forecast, by Capacity 2019 & 2032
- Table 21: Global US EV Battery Pack Market Revenue Million Forecast, by Battery Form 2019 & 2032
- Table 22: Global US EV Battery Pack Market Revenue Million Forecast, by Method 2019 & 2032
- Table 23: Global US EV Battery Pack Market Revenue Million Forecast, by Component 2019 & 2032
- Table 24: Global US EV Battery Pack Market Revenue Million Forecast, by Material Type 2019 & 2032
- Table 25: Global US EV Battery Pack Market Revenue Million Forecast, by Country 2019 & 2032
- Table 26: United States US EV Battery Pack Market Revenue (Million) Forecast, by Application 2019 & 2032
- Table 27: Canada US EV Battery Pack Market Revenue (Million) Forecast, by Application 2019 & 2032
- Table 28: Mexico US EV Battery Pack Market Revenue (Million) Forecast, by Application 2019 & 2032
- Table 29: Global US EV Battery Pack Market Revenue Million Forecast, by Body Type 2019 & 2032
- Table 30: Global US EV Battery Pack Market Revenue Million Forecast, by Propulsion Type 2019 & 2032
- Table 31: Global US EV Battery Pack Market Revenue Million Forecast, by Battery Chemistry 2019 & 2032
- Table 32: Global US EV Battery Pack Market Revenue Million Forecast, by Capacity 2019 & 2032
- Table 33: Global US EV Battery Pack Market Revenue Million Forecast, by Battery Form 2019 & 2032
- Table 34: Global US EV Battery Pack Market Revenue Million Forecast, by Method 2019 & 2032
- Table 35: Global US EV Battery Pack Market Revenue Million Forecast, by Component 2019 & 2032
- Table 36: Global US EV Battery Pack Market Revenue Million Forecast, by Material Type 2019 & 2032
- Table 37: Global US EV Battery Pack Market Revenue Million Forecast, by Country 2019 & 2032
- Table 38: Brazil US EV Battery Pack Market Revenue (Million) Forecast, by Application 2019 & 2032
- Table 39: Argentina US EV Battery Pack Market Revenue (Million) Forecast, by Application 2019 & 2032
- Table 40: Rest of South America US EV Battery Pack Market Revenue (Million) Forecast, by Application 2019 & 2032
- Table 41: Global US EV Battery Pack Market Revenue Million Forecast, by Body Type 2019 & 2032
- Table 42: Global US EV Battery Pack Market Revenue Million Forecast, by Propulsion Type 2019 & 2032
- Table 43: Global US EV Battery Pack Market Revenue Million Forecast, by Battery Chemistry 2019 & 2032
- Table 44: Global US EV Battery Pack Market Revenue Million Forecast, by Capacity 2019 & 2032
- Table 45: Global US EV Battery Pack Market Revenue Million Forecast, by Battery Form 2019 & 2032
- Table 46: Global US EV Battery Pack Market Revenue Million Forecast, by Method 2019 & 2032
- Table 47: Global US EV Battery Pack Market Revenue Million Forecast, by Component 2019 & 2032
- Table 48: Global US EV Battery Pack Market Revenue Million Forecast, by Material Type 2019 & 2032
- Table 49: Global US EV Battery Pack Market Revenue Million Forecast, by Country 2019 & 2032
- Table 50: United Kingdom US EV Battery Pack Market Revenue (Million) Forecast, by Application 2019 & 2032
- Table 51: Germany US EV Battery Pack Market Revenue (Million) Forecast, by Application 2019 & 2032
- Table 52: France US EV Battery Pack Market Revenue (Million) Forecast, by Application 2019 & 2032
- Table 53: Italy US EV Battery Pack Market Revenue (Million) Forecast, by Application 2019 & 2032
- Table 54: Spain US EV Battery Pack Market Revenue (Million) Forecast, by Application 2019 & 2032
- Table 55: Russia US EV Battery Pack Market Revenue (Million) Forecast, by Application 2019 & 2032
- Table 56: Benelux US EV Battery Pack Market Revenue (Million) Forecast, by Application 2019 & 2032
- Table 57: Nordics US EV Battery Pack Market Revenue (Million) Forecast, by Application 2019 & 2032
- Table 58: Rest of Europe US EV Battery Pack Market Revenue (Million) Forecast, by Application 2019 & 2032
- Table 59: Global US EV Battery Pack Market Revenue Million Forecast, by Body Type 2019 & 2032
- Table 60: Global US EV Battery Pack Market Revenue Million Forecast, by Propulsion Type 2019 & 2032
- Table 61: Global US EV Battery Pack Market Revenue Million Forecast, by Battery Chemistry 2019 & 2032
- Table 62: Global US EV Battery Pack Market Revenue Million Forecast, by Capacity 2019 & 2032
- Table 63: Global US EV Battery Pack Market Revenue Million Forecast, by Battery Form 2019 & 2032
- Table 64: Global US EV Battery Pack Market Revenue Million Forecast, by Method 2019 & 2032
- Table 65: Global US EV Battery Pack Market Revenue Million Forecast, by Component 2019 & 2032
- Table 66: Global US EV Battery Pack Market Revenue Million Forecast, by Material Type 2019 & 2032
- Table 67: Global US EV Battery Pack Market Revenue Million Forecast, by Country 2019 & 2032
- Table 68: Turkey US EV Battery Pack Market Revenue (Million) Forecast, by Application 2019 & 2032
- Table 69: Israel US EV Battery Pack Market Revenue (Million) Forecast, by Application 2019 & 2032
- Table 70: GCC US EV Battery Pack Market Revenue (Million) Forecast, by Application 2019 & 2032
- Table 71: North Africa US EV Battery Pack Market Revenue (Million) Forecast, by Application 2019 & 2032
- Table 72: South Africa US EV Battery Pack Market Revenue (Million) Forecast, by Application 2019 & 2032
- Table 73: Rest of Middle East & Africa US EV Battery Pack Market Revenue (Million) Forecast, by Application 2019 & 2032
- Table 74: Global US EV Battery Pack Market Revenue Million Forecast, by Body Type 2019 & 2032
- Table 75: Global US EV Battery Pack Market Revenue Million Forecast, by Propulsion Type 2019 & 2032
- Table 76: Global US EV Battery Pack Market Revenue Million Forecast, by Battery Chemistry 2019 & 2032
- Table 77: Global US EV Battery Pack Market Revenue Million Forecast, by Capacity 2019 & 2032
- Table 78: Global US EV Battery Pack Market Revenue Million Forecast, by Battery Form 2019 & 2032
- Table 79: Global US EV Battery Pack Market Revenue Million Forecast, by Method 2019 & 2032
- Table 80: Global US EV Battery Pack Market Revenue Million Forecast, by Component 2019 & 2032
- Table 81: Global US EV Battery Pack Market Revenue Million Forecast, by Material Type 2019 & 2032
- Table 82: Global US EV Battery Pack Market Revenue Million Forecast, by Country 2019 & 2032
- Table 83: China US EV Battery Pack Market Revenue (Million) Forecast, by Application 2019 & 2032
- Table 84: India US EV Battery Pack Market Revenue (Million) Forecast, by Application 2019 & 2032
- Table 85: Japan US EV Battery Pack Market Revenue (Million) Forecast, by Application 2019 & 2032
- Table 86: South Korea US EV Battery Pack Market Revenue (Million) Forecast, by Application 2019 & 2032
- Table 87: ASEAN US EV Battery Pack Market Revenue (Million) Forecast, by Application 2019 & 2032
- Table 88: Oceania US EV Battery Pack Market Revenue (Million) Forecast, by Application 2019 & 2032
- Table 89: Rest of Asia Pacific US EV Battery Pack Market Revenue (Million) Forecast, by Application 2019 & 2032
Frequently Asked Questions
1. What is the projected Compound Annual Growth Rate (CAGR) of the US EV Battery Pack Market?
The projected CAGR is approximately > 6.50%.
2. Which companies are prominent players in the US EV Battery Pack Market?
Key companies in the market include Samsung SDI Co Ltd, LG Energy Solution Ltd, Imperium3 New York (IM3NY), Contemporary Amperex Technology Co Ltd (CATL), Tesla Inc, SK Innovation Co Ltd, Ambri Inc, Sila Nanotechnologies Inc, Panasonic Holdings Corporation, Envision AESC Japan Co Ltd.
3. What are the main segments of the US EV Battery Pack Market?
The market segments include Body Type, Propulsion Type, Battery Chemistry, Capacity, Battery Form, Method, Component, Material Type.
4. Can you provide details about the market size?
The market size is estimated to be USD XX Million as of 2022.
5. What are some drivers contributing to market growth?
Increasing Demand and Sales of Commercial Vehicles is Driving the Market for Hydraulic Systems.
6. What are the notable trends driving market growth?
OTHER KEY INDUSTRY TRENDS COVERED IN THE REPORT.
7. Are there any restraints impacting market growth?
Increasing Replacement of Conventional Hydraulic Systems with Fully-electric Hydraulic Systems Acts as a Restraint.
8. Can you provide examples of recent developments in the market?
June 2023: CATL will invest USD 1.4 billion in helping Bolivia develop its huge but largely untapped reserves of lithium. Following a meeting with CATL executives on June 25, Bolivian President Luis Arce confirmed the commitment to build two lithium plants to extract minerals from the country’s Uyuni and Oruro salt flats. Construction of both plants could begin as soon as July, according to the country’s energy ministry.March 2023: Tesla was reported to be in talks with Contemporary Amperex Technology Co. Ltd. (CATL) regarding plans to build a battery factory in the U.S., according to sources familiar with the matter.January 2023: Tesla has announced a new investment of USD 3.6 billion to expand its Gigafactory Nevada complex, hire 3,000 additional employees, and construct two new facilities on the site, including a 100 GWh 4680 cell factory.
9. What pricing options are available for accessing the report?
Pricing options include single-user, multi-user, and enterprise licenses priced at USD 3800, USD 4500, and USD 5800 respectively.
10. Is the market size provided in terms of value or volume?
The market size is provided in terms of value, measured in Million.
11. Are there any specific market keywords associated with the report?
Yes, the market keyword associated with the report is "US EV Battery Pack Market," which aids in identifying and referencing the specific market segment covered.
12. How do I determine which pricing option suits my needs best?
The pricing options vary based on user requirements and access needs. Individual users may opt for single-user licenses, while businesses requiring broader access may choose multi-user or enterprise licenses for cost-effective access to the report.
13. Are there any additional resources or data provided in the US EV Battery Pack Market report?
While the report offers comprehensive insights, it's advisable to review the specific contents or supplementary materials provided to ascertain if additional resources or data are available.
14. How can I stay updated on further developments or reports in the US EV Battery Pack Market?
To stay informed about further developments, trends, and reports in the US EV Battery Pack Market, consider subscribing to industry newsletters, following relevant companies and organizations, or regularly checking reputable industry news sources and publications.
Methodology
Step 1 - Identification of Relevant Samples Size from Population Database


Step 2 - Approaches for Defining Global Market Size (Value, Volume* & Price*)

Note*: In applicable scenarios
Step 3 - Data Sources
Primary Research
- Web Analytics
- Survey Reports
- Research Institute
- Latest Research Reports
- Opinion Leaders
Secondary Research
- Annual Reports
- White Paper
- Latest Press Release
- Industry Association
- Paid Database
- Investor Presentations

Step 4 - Data Triangulation
Involves using different sources of information in order to increase the validity of a study
These sources are likely to be stakeholders in a program - participants, other researchers, program staff, other community members, and so on.
Then we put all data in single framework & apply various statistical tools to find out the dynamic on the market.
During the analysis stage, feedback from the stakeholder groups would be compared to determine areas of agreement as well as areas of divergence


