
Key Insights
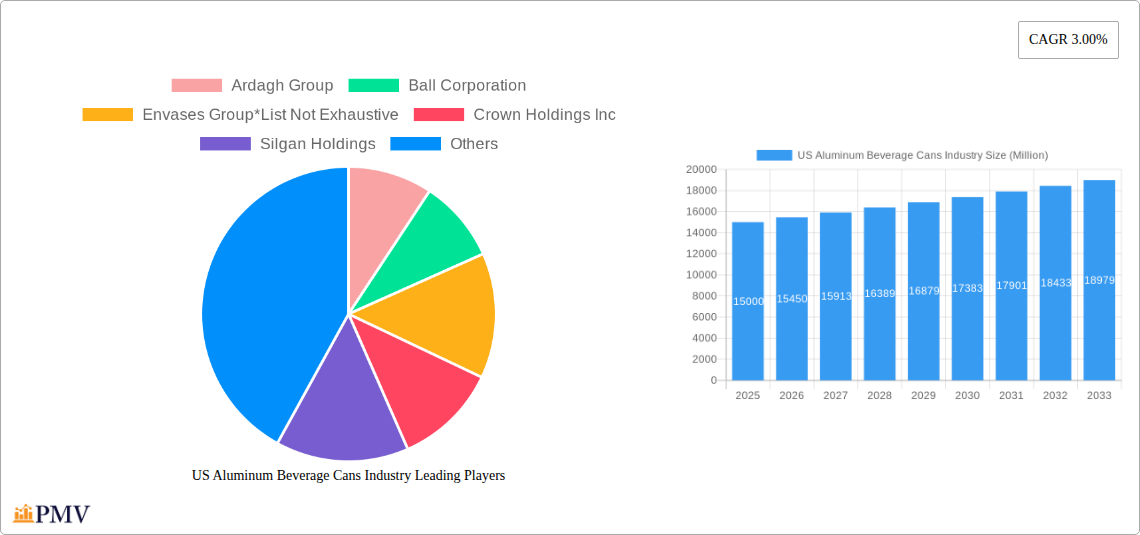
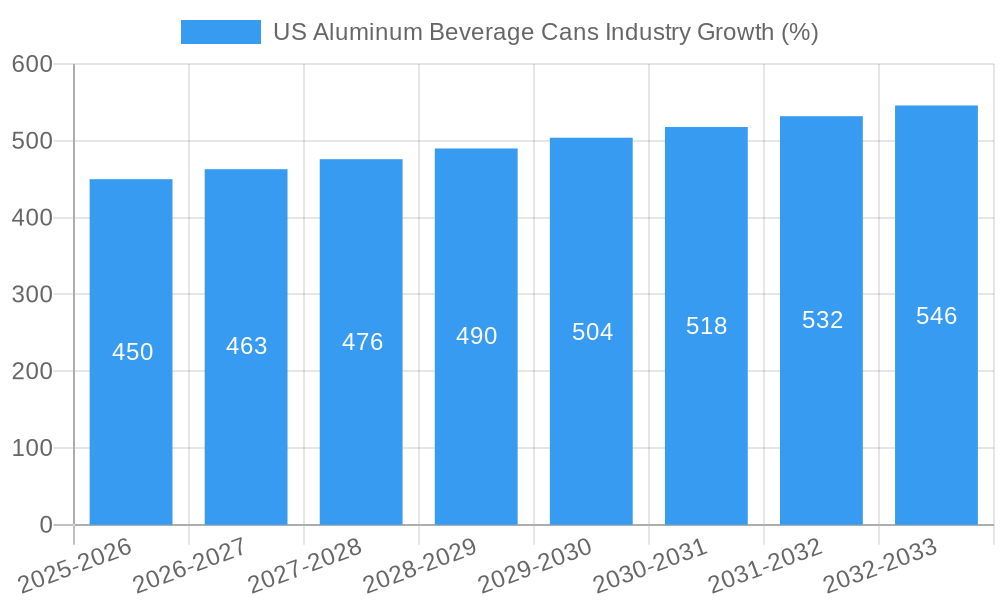
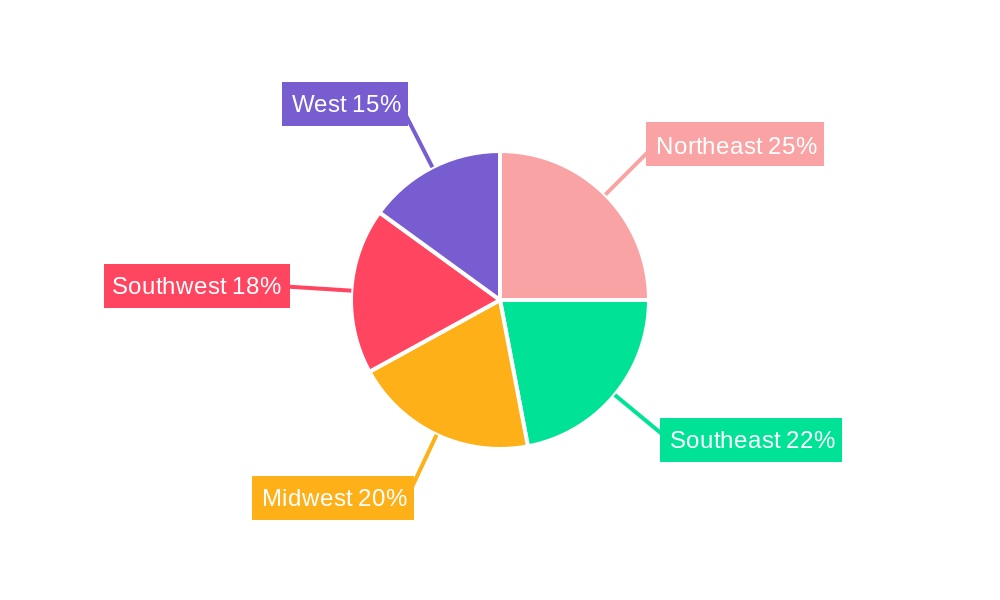
The US aluminum beverage can market, valued at approximately $15 billion in 2025, is experiencing steady growth, projected to maintain a 3.00% Compound Annual Growth Rate (CAGR) through 2033. This expansion is driven by several key factors. The increasing popularity of carbonated soft drinks, energy drinks, and craft beers fuels demand for lightweight, recyclable aluminum cans. Consumer preference for convenient, portable packaging and the sustainability advantages of aluminum over other materials further contribute to market growth. Furthermore, advancements in can manufacturing technologies, allowing for more innovative designs and improved recyclability, are positively influencing market dynamics. The market is segmented by can type (2-piece and 3-piece) and beverage application (carbonated soft drinks, beer, water, energy drinks, and others). While the carbonated soft drinks segment currently holds a significant share, the growing popularity of craft beers and ready-to-drink beverages is driving substantial growth in these segments. Regional variations exist, with the West and Southeast regions expected to witness comparatively faster growth due to population density and consumption patterns. However, challenges remain. Fluctuations in aluminum prices and potential supply chain disruptions could impact production costs and profitability. Furthermore, increasing competition from alternative packaging materials like plastic and glass necessitates continuous innovation within the aluminum can industry to maintain its market position.
Despite potential challenges, the long-term outlook for the US aluminum beverage can market remains positive. The increasing focus on sustainability, coupled with the inherent recyclability and lightweight nature of aluminum cans, positions the industry for sustained growth. Major players like Ardagh Group, Ball Corporation, Crown Holdings Inc., and Silgan Holdings are actively investing in research and development, capacity expansion, and sustainable manufacturing processes to capitalize on emerging market opportunities and strengthen their market share. The strategic adoption of innovative can designs and the exploration of new beverage applications will further contribute to the market's continued expansion and diversification in the forecast period.
US Aluminum Beverage Cans Industry: 2019-2033 Market Report
This comprehensive report provides an in-depth analysis of the US aluminum beverage cans industry, covering market size, segmentation, competitive landscape, growth drivers, and future outlook. The study period spans from 2019 to 2033, with 2025 serving as the base and estimated year. The forecast period is 2025-2033, and the historical period is 2019-2024. Key players analyzed include Ardagh Group, Ball Corporation, Envases Group, Crown Holdings Inc., Silgan Holdings, and Metal Container Corporation. This report is crucial for industry stakeholders seeking to understand market trends and opportunities in this dynamic sector.
US Aluminum Beverage Cans Industry Market Structure & Competitive Dynamics
The US aluminum beverage can market exhibits a moderately concentrated structure, with a few major players holding significant market share. Ardagh Group, Ball Corporation, and Crown Holdings Inc. are among the leading companies, competing intensely on price, quality, and innovation. Market concentration is further influenced by mergers and acquisitions (M&A) activity, with deal values reaching xx Million in recent years. Several factors shape competitive dynamics, including:
- Innovation Ecosystems: Continuous innovation in can design, manufacturing processes (e.g., lightweighting), and sustainable materials (e.g., increased recycled aluminum content) are crucial for competitive advantage.
- Regulatory Frameworks: Environmental regulations, particularly those related to recycling and sustainable packaging, significantly influence industry practices and investment decisions.
- Product Substitutes: While aluminum cans dominate the beverage packaging market, competition exists from alternative packaging materials like plastic bottles and glass containers. These substitutes exert pressure on pricing and market share.
- End-User Trends: Growing consumer demand for convenience, sustainability, and premiumization drives innovation and market growth within specific segments (e.g., sleek designs for craft beers).
- M&A Activities: Consolidation through mergers and acquisitions shapes the competitive landscape, leading to increased market share for larger players and potentially higher barriers to entry for smaller companies. The total value of M&A deals in the period 2019-2024 is estimated at xx Million.
US Aluminum Beverage Cans Industry Industry Trends & Insights
The US aluminum beverage cans market is experiencing robust growth, driven by several key factors. The Compound Annual Growth Rate (CAGR) during the forecast period (2025-2033) is projected to be xx%. This growth is fueled by:
- Increased Demand for Convenient Packaging: The preference for convenient, portable, and resealable packaging across various beverage categories continues to be a major growth driver.
- Technological Advancements: Innovations in can manufacturing technologies, such as lightweighting and improved printing capabilities, enhance efficiency and product appeal.
- Sustainability Concerns: Growing consumer awareness of environmental issues and the increasing adoption of sustainable practices are boosting demand for infinitely recyclable aluminum cans. Market penetration of cans made with recycled aluminum is projected to reach xx% by 2033.
- Shifting Consumer Preferences: Changing beverage consumption patterns, with a rise in popularity of craft beers, energy drinks, and ready-to-drink cocktails, are expanding the market for aluminum cans.
- Competitive Landscape: The competitive nature of the industry spurs innovation and drives down prices, further benefiting consumers and expanding market access.
Dominant Markets & Segments in US Aluminum Beverage Cans Industry
The US aluminum beverage cans market demonstrates strong growth across various segments. However, certain segments and regions exhibit particularly strong dominance:
- By Type: The 2-piece can segment currently holds a larger market share than the 3-piece segment due to its higher production efficiency and cost-effectiveness. This trend is expected to continue during the forecast period.
- By Application: The carbonated soft drinks (CSD) segment remains the largest application area for aluminum beverage cans, driven by significant volume sales. The beer segment also holds a substantial market share, particularly with the rise of craft breweries and the increasing popularity of ready-to-drink alcoholic beverages.
Key Drivers of Segment Dominance:
- Economic Factors: Consumer spending power and disposable income levels are crucial determinants of overall beverage consumption, particularly within the CSD and beer segments.
- Infrastructure: The availability of efficient transportation networks and distribution channels is vital for delivering aluminum cans to consumers across the US.
US Aluminum Beverage Cans Industry Product Innovations
Recent innovations focus on enhancing sustainability, improving functionality, and creating unique designs. Lightweighting techniques reduce material costs and environmental impact. Improved printing technologies allow for highly customized and visually appealing can designs, reflecting the growing importance of branding and consumer preferences. New materials and coatings offer extended shelf life and improved product protection. These innovations cater to evolving consumer demands and strengthen the competitive position of aluminum cans in the beverage packaging market.
Report Segmentation & Scope
This report segments the US aluminum beverage cans market by type (2-piece and 3-piece) and by application (carbonated soft drinks, beer, water, energy drinks, and other beverages including wine, spirits, flavored alcoholic beverages, juices, and dairy-based beverages). Each segment’s market size, growth projections, and competitive dynamics are analyzed in detail. For instance, the CSD segment is projected to witness a CAGR of xx% during the forecast period, driven by strong demand and continuous product innovation. Similarly, the beer segment shows promising growth potential, fueled by the expanding craft beer market. The growth projections for each segment are derived from detailed analysis of historical data, market trends, and future forecasts.
Key Drivers of US Aluminum Beverage Cans Industry Growth
Several factors propel the growth of the US aluminum beverage cans industry:
- Technological advancements: Lightweighting, improved printing capabilities, and enhanced sustainability features drive increased efficiency and market appeal.
- Economic growth: Rising disposable incomes and increased consumer spending power fuel greater demand for packaged beverages.
- Favorable regulatory environment: Policies supporting recycling and sustainable packaging further strengthen the competitiveness of aluminum cans. The increasing adoption of ESG goals by major players, like Crown Holdings' Twentyby30 initiative, underscores the industry's commitment to sustainable practices.
Challenges in the US Aluminum Beverage Cans Industry Sector
Despite the positive outlook, the industry faces several challenges:
- Fluctuating raw material prices: Aluminum prices impact production costs and profitability.
- Supply chain disruptions: Global events can impact the availability of raw materials and packaging components.
- Intense competition: Competition from alternative packaging materials necessitates continuous innovation and efficiency improvements.
Leading Players in the US Aluminum Beverage Cans Industry Market
- Ardagh Group
- Ball Corporation
- Envases Group
- Crown Holdings Inc.
- Silgan Holdings
- Metal Container Corporation
Key Developments in US Aluminum Beverage Cans Industry Sector
- August 2020: Crown Holdings Inc. launched the Twentyby30 initiative, outlining 20 ESG goals to be achieved by 2030, focusing on circularity and recycled content. This signals a significant commitment to sustainability within the industry.
- September 2020: Ball Corporation announced a new aluminum beverage can plant in Pittston, PA, demonstrating investment in meeting escalating demand, especially for seltzers and sparkling water. This expansion reflects confidence in future market growth.
Strategic US Aluminum Beverage Cans Industry Market Outlook
The US aluminum beverage cans industry is poised for continued growth, driven by innovation, sustainability, and evolving consumer preferences. Strategic opportunities lie in developing sustainable packaging solutions, expanding into emerging beverage segments, and leveraging technological advancements to enhance efficiency and product differentiation. The focus on circular economy principles and ESG initiatives will be crucial for long-term success in this competitive market. The industry's future hinges on a successful balance between sustainability, innovation, and cost-effectiveness.
US Aluminum Beverage Cans Industry Segmentation
-
1. Type
- 1.1. 2-Piece
- 1.2. 3-Piece
-
2. Application
- 2.1. Carbonated Soft Drinks
- 2.2. Beer
- 2.3. Water
- 2.4. Energy Drinks
- 2.5. Other Ty
US Aluminum Beverage Cans Industry Segmentation By Geography
-
1. North America
- 1.1. United States
- 1.2. Canada
- 1.3. Mexico
-
2. South America
- 2.1. Brazil
- 2.2. Argentina
- 2.3. Rest of South America
-
3. Europe
- 3.1. United Kingdom
- 3.2. Germany
- 3.3. France
- 3.4. Italy
- 3.5. Spain
- 3.6. Russia
- 3.7. Benelux
- 3.8. Nordics
- 3.9. Rest of Europe
-
4. Middle East & Africa
- 4.1. Turkey
- 4.2. Israel
- 4.3. GCC
- 4.4. North Africa
- 4.5. South Africa
- 4.6. Rest of Middle East & Africa
-
5. Asia Pacific
- 5.1. China
- 5.2. India
- 5.3. Japan
- 5.4. South Korea
- 5.5. ASEAN
- 5.6. Oceania
- 5.7. Rest of Asia Pacific
US Aluminum Beverage Cans Industry REPORT HIGHLIGHTS
| Aspects | Details |
|---|---|
| Study Period | 2019-2033 |
| Base Year | 2024 |
| Estimated Year | 2025 |
| Forecast Period | 2025-2033 |
| Historical Period | 2019-2024 |
| Growth Rate | CAGR of 3.00% from 2019-2033 |
| Segmentation |
|
Table of Contents
- 1. Introduction
- 1.1. Research Scope
- 1.2. Market Segmentation
- 1.3. Research Methodology
- 1.4. Definitions and Assumptions
- 2. Executive Summary
- 2.1. Introduction
- 3. Market Dynamics
- 3.1. Introduction
- 3.2. Market Drivers
- 3.2.1. Growing demand from the Non-Alcoholic Beverage sector; High Recyclability Rates of Metal Packaging
- 3.3. Market Restrains
- 3.3.1. Availability Of Alernative Packaging Solutions; Food Stored In Metallic Cans Cause Severe Health Issues
- 3.4. Market Trends
- 3.4.1. High Recyclability Rates of Metal Packaging is Expected to Drive the Market Growth
- 4. Market Factor Analysis
- 4.1. Porters Five Forces
- 4.2. Supply/Value Chain
- 4.3. PESTEL analysis
- 4.4. Market Entropy
- 4.5. Patent/Trademark Analysis
- 5. Global US Aluminum Beverage Cans Industry Analysis, Insights and Forecast, 2019-2031
- 5.1. Market Analysis, Insights and Forecast - by Type
- 5.1.1. 2-Piece
- 5.1.2. 3-Piece
- 5.2. Market Analysis, Insights and Forecast - by Application
- 5.2.1. Carbonated Soft Drinks
- 5.2.2. Beer
- 5.2.3. Water
- 5.2.4. Energy Drinks
- 5.2.5. Other Ty
- 5.3. Market Analysis, Insights and Forecast - by Region
- 5.3.1. North America
- 5.3.2. South America
- 5.3.3. Europe
- 5.3.4. Middle East & Africa
- 5.3.5. Asia Pacific
- 5.1. Market Analysis, Insights and Forecast - by Type
- 6. North America US Aluminum Beverage Cans Industry Analysis, Insights and Forecast, 2019-2031
- 6.1. Market Analysis, Insights and Forecast - by Type
- 6.1.1. 2-Piece
- 6.1.2. 3-Piece
- 6.2. Market Analysis, Insights and Forecast - by Application
- 6.2.1. Carbonated Soft Drinks
- 6.2.2. Beer
- 6.2.3. Water
- 6.2.4. Energy Drinks
- 6.2.5. Other Ty
- 6.1. Market Analysis, Insights and Forecast - by Type
- 7. South America US Aluminum Beverage Cans Industry Analysis, Insights and Forecast, 2019-2031
- 7.1. Market Analysis, Insights and Forecast - by Type
- 7.1.1. 2-Piece
- 7.1.2. 3-Piece
- 7.2. Market Analysis, Insights and Forecast - by Application
- 7.2.1. Carbonated Soft Drinks
- 7.2.2. Beer
- 7.2.3. Water
- 7.2.4. Energy Drinks
- 7.2.5. Other Ty
- 7.1. Market Analysis, Insights and Forecast - by Type
- 8. Europe US Aluminum Beverage Cans Industry Analysis, Insights and Forecast, 2019-2031
- 8.1. Market Analysis, Insights and Forecast - by Type
- 8.1.1. 2-Piece
- 8.1.2. 3-Piece
- 8.2. Market Analysis, Insights and Forecast - by Application
- 8.2.1. Carbonated Soft Drinks
- 8.2.2. Beer
- 8.2.3. Water
- 8.2.4. Energy Drinks
- 8.2.5. Other Ty
- 8.1. Market Analysis, Insights and Forecast - by Type
- 9. Middle East & Africa US Aluminum Beverage Cans Industry Analysis, Insights and Forecast, 2019-2031
- 9.1. Market Analysis, Insights and Forecast - by Type
- 9.1.1. 2-Piece
- 9.1.2. 3-Piece
- 9.2. Market Analysis, Insights and Forecast - by Application
- 9.2.1. Carbonated Soft Drinks
- 9.2.2. Beer
- 9.2.3. Water
- 9.2.4. Energy Drinks
- 9.2.5. Other Ty
- 9.1. Market Analysis, Insights and Forecast - by Type
- 10. Asia Pacific US Aluminum Beverage Cans Industry Analysis, Insights and Forecast, 2019-2031
- 10.1. Market Analysis, Insights and Forecast - by Type
- 10.1.1. 2-Piece
- 10.1.2. 3-Piece
- 10.2. Market Analysis, Insights and Forecast - by Application
- 10.2.1. Carbonated Soft Drinks
- 10.2.2. Beer
- 10.2.3. Water
- 10.2.4. Energy Drinks
- 10.2.5. Other Ty
- 10.1. Market Analysis, Insights and Forecast - by Type
- 11. Northeast US Aluminum Beverage Cans Industry Analysis, Insights and Forecast, 2019-2031
- 12. Southeast US Aluminum Beverage Cans Industry Analysis, Insights and Forecast, 2019-2031
- 13. Midwest US Aluminum Beverage Cans Industry Analysis, Insights and Forecast, 2019-2031
- 14. Southwest US Aluminum Beverage Cans Industry Analysis, Insights and Forecast, 2019-2031
- 15. West US Aluminum Beverage Cans Industry Analysis, Insights and Forecast, 2019-2031
- 16. Competitive Analysis
- 16.1. Global Market Share Analysis 2024
- 16.2. Company Profiles
- 16.2.1 Ardagh Group
- 16.2.1.1. Overview
- 16.2.1.2. Products
- 16.2.1.3. SWOT Analysis
- 16.2.1.4. Recent Developments
- 16.2.1.5. Financials (Based on Availability)
- 16.2.2 Ball Corporation
- 16.2.2.1. Overview
- 16.2.2.2. Products
- 16.2.2.3. SWOT Analysis
- 16.2.2.4. Recent Developments
- 16.2.2.5. Financials (Based on Availability)
- 16.2.3 Envases Group*List Not Exhaustive
- 16.2.3.1. Overview
- 16.2.3.2. Products
- 16.2.3.3. SWOT Analysis
- 16.2.3.4. Recent Developments
- 16.2.3.5. Financials (Based on Availability)
- 16.2.4 Crown Holdings Inc
- 16.2.4.1. Overview
- 16.2.4.2. Products
- 16.2.4.3. SWOT Analysis
- 16.2.4.4. Recent Developments
- 16.2.4.5. Financials (Based on Availability)
- 16.2.5 Silgan Holdings
- 16.2.5.1. Overview
- 16.2.5.2. Products
- 16.2.5.3. SWOT Analysis
- 16.2.5.4. Recent Developments
- 16.2.5.5. Financials (Based on Availability)
- 16.2.6 Metal Container Corporation
- 16.2.6.1. Overview
- 16.2.6.2. Products
- 16.2.6.3. SWOT Analysis
- 16.2.6.4. Recent Developments
- 16.2.6.5. Financials (Based on Availability)
- 16.2.1 Ardagh Group
List of Figures
- Figure 1: Global US Aluminum Beverage Cans Industry Revenue Breakdown (Million, %) by Region 2024 & 2032
- Figure 2: United states US Aluminum Beverage Cans Industry Revenue (Million), by Country 2024 & 2032
- Figure 3: United states US Aluminum Beverage Cans Industry Revenue Share (%), by Country 2024 & 2032
- Figure 4: North America US Aluminum Beverage Cans Industry Revenue (Million), by Type 2024 & 2032
- Figure 5: North America US Aluminum Beverage Cans Industry Revenue Share (%), by Type 2024 & 2032
- Figure 6: North America US Aluminum Beverage Cans Industry Revenue (Million), by Application 2024 & 2032
- Figure 7: North America US Aluminum Beverage Cans Industry Revenue Share (%), by Application 2024 & 2032
- Figure 8: North America US Aluminum Beverage Cans Industry Revenue (Million), by Country 2024 & 2032
- Figure 9: North America US Aluminum Beverage Cans Industry Revenue Share (%), by Country 2024 & 2032
- Figure 10: South America US Aluminum Beverage Cans Industry Revenue (Million), by Type 2024 & 2032
- Figure 11: South America US Aluminum Beverage Cans Industry Revenue Share (%), by Type 2024 & 2032
- Figure 12: South America US Aluminum Beverage Cans Industry Revenue (Million), by Application 2024 & 2032
- Figure 13: South America US Aluminum Beverage Cans Industry Revenue Share (%), by Application 2024 & 2032
- Figure 14: South America US Aluminum Beverage Cans Industry Revenue (Million), by Country 2024 & 2032
- Figure 15: South America US Aluminum Beverage Cans Industry Revenue Share (%), by Country 2024 & 2032
- Figure 16: Europe US Aluminum Beverage Cans Industry Revenue (Million), by Type 2024 & 2032
- Figure 17: Europe US Aluminum Beverage Cans Industry Revenue Share (%), by Type 2024 & 2032
- Figure 18: Europe US Aluminum Beverage Cans Industry Revenue (Million), by Application 2024 & 2032
- Figure 19: Europe US Aluminum Beverage Cans Industry Revenue Share (%), by Application 2024 & 2032
- Figure 20: Europe US Aluminum Beverage Cans Industry Revenue (Million), by Country 2024 & 2032
- Figure 21: Europe US Aluminum Beverage Cans Industry Revenue Share (%), by Country 2024 & 2032
- Figure 22: Middle East & Africa US Aluminum Beverage Cans Industry Revenue (Million), by Type 2024 & 2032
- Figure 23: Middle East & Africa US Aluminum Beverage Cans Industry Revenue Share (%), by Type 2024 & 2032
- Figure 24: Middle East & Africa US Aluminum Beverage Cans Industry Revenue (Million), by Application 2024 & 2032
- Figure 25: Middle East & Africa US Aluminum Beverage Cans Industry Revenue Share (%), by Application 2024 & 2032
- Figure 26: Middle East & Africa US Aluminum Beverage Cans Industry Revenue (Million), by Country 2024 & 2032
- Figure 27: Middle East & Africa US Aluminum Beverage Cans Industry Revenue Share (%), by Country 2024 & 2032
- Figure 28: Asia Pacific US Aluminum Beverage Cans Industry Revenue (Million), by Type 2024 & 2032
- Figure 29: Asia Pacific US Aluminum Beverage Cans Industry Revenue Share (%), by Type 2024 & 2032
- Figure 30: Asia Pacific US Aluminum Beverage Cans Industry Revenue (Million), by Application 2024 & 2032
- Figure 31: Asia Pacific US Aluminum Beverage Cans Industry Revenue Share (%), by Application 2024 & 2032
- Figure 32: Asia Pacific US Aluminum Beverage Cans Industry Revenue (Million), by Country 2024 & 2032
- Figure 33: Asia Pacific US Aluminum Beverage Cans Industry Revenue Share (%), by Country 2024 & 2032
List of Tables
- Table 1: Global US Aluminum Beverage Cans Industry Revenue Million Forecast, by Region 2019 & 2032
- Table 2: Global US Aluminum Beverage Cans Industry Revenue Million Forecast, by Type 2019 & 2032
- Table 3: Global US Aluminum Beverage Cans Industry Revenue Million Forecast, by Application 2019 & 2032
- Table 4: Global US Aluminum Beverage Cans Industry Revenue Million Forecast, by Region 2019 & 2032
- Table 5: Global US Aluminum Beverage Cans Industry Revenue Million Forecast, by Country 2019 & 2032
- Table 6: Northeast US Aluminum Beverage Cans Industry Revenue (Million) Forecast, by Application 2019 & 2032
- Table 7: Southeast US Aluminum Beverage Cans Industry Revenue (Million) Forecast, by Application 2019 & 2032
- Table 8: Midwest US Aluminum Beverage Cans Industry Revenue (Million) Forecast, by Application 2019 & 2032
- Table 9: Southwest US Aluminum Beverage Cans Industry Revenue (Million) Forecast, by Application 2019 & 2032
- Table 10: West US Aluminum Beverage Cans Industry Revenue (Million) Forecast, by Application 2019 & 2032
- Table 11: Global US Aluminum Beverage Cans Industry Revenue Million Forecast, by Type 2019 & 2032
- Table 12: Global US Aluminum Beverage Cans Industry Revenue Million Forecast, by Application 2019 & 2032
- Table 13: Global US Aluminum Beverage Cans Industry Revenue Million Forecast, by Country 2019 & 2032
- Table 14: United States US Aluminum Beverage Cans Industry Revenue (Million) Forecast, by Application 2019 & 2032
- Table 15: Canada US Aluminum Beverage Cans Industry Revenue (Million) Forecast, by Application 2019 & 2032
- Table 16: Mexico US Aluminum Beverage Cans Industry Revenue (Million) Forecast, by Application 2019 & 2032
- Table 17: Global US Aluminum Beverage Cans Industry Revenue Million Forecast, by Type 2019 & 2032
- Table 18: Global US Aluminum Beverage Cans Industry Revenue Million Forecast, by Application 2019 & 2032
- Table 19: Global US Aluminum Beverage Cans Industry Revenue Million Forecast, by Country 2019 & 2032
- Table 20: Brazil US Aluminum Beverage Cans Industry Revenue (Million) Forecast, by Application 2019 & 2032
- Table 21: Argentina US Aluminum Beverage Cans Industry Revenue (Million) Forecast, by Application 2019 & 2032
- Table 22: Rest of South America US Aluminum Beverage Cans Industry Revenue (Million) Forecast, by Application 2019 & 2032
- Table 23: Global US Aluminum Beverage Cans Industry Revenue Million Forecast, by Type 2019 & 2032
- Table 24: Global US Aluminum Beverage Cans Industry Revenue Million Forecast, by Application 2019 & 2032
- Table 25: Global US Aluminum Beverage Cans Industry Revenue Million Forecast, by Country 2019 & 2032
- Table 26: United Kingdom US Aluminum Beverage Cans Industry Revenue (Million) Forecast, by Application 2019 & 2032
- Table 27: Germany US Aluminum Beverage Cans Industry Revenue (Million) Forecast, by Application 2019 & 2032
- Table 28: France US Aluminum Beverage Cans Industry Revenue (Million) Forecast, by Application 2019 & 2032
- Table 29: Italy US Aluminum Beverage Cans Industry Revenue (Million) Forecast, by Application 2019 & 2032
- Table 30: Spain US Aluminum Beverage Cans Industry Revenue (Million) Forecast, by Application 2019 & 2032
- Table 31: Russia US Aluminum Beverage Cans Industry Revenue (Million) Forecast, by Application 2019 & 2032
- Table 32: Benelux US Aluminum Beverage Cans Industry Revenue (Million) Forecast, by Application 2019 & 2032
- Table 33: Nordics US Aluminum Beverage Cans Industry Revenue (Million) Forecast, by Application 2019 & 2032
- Table 34: Rest of Europe US Aluminum Beverage Cans Industry Revenue (Million) Forecast, by Application 2019 & 2032
- Table 35: Global US Aluminum Beverage Cans Industry Revenue Million Forecast, by Type 2019 & 2032
- Table 36: Global US Aluminum Beverage Cans Industry Revenue Million Forecast, by Application 2019 & 2032
- Table 37: Global US Aluminum Beverage Cans Industry Revenue Million Forecast, by Country 2019 & 2032
- Table 38: Turkey US Aluminum Beverage Cans Industry Revenue (Million) Forecast, by Application 2019 & 2032
- Table 39: Israel US Aluminum Beverage Cans Industry Revenue (Million) Forecast, by Application 2019 & 2032
- Table 40: GCC US Aluminum Beverage Cans Industry Revenue (Million) Forecast, by Application 2019 & 2032
- Table 41: North Africa US Aluminum Beverage Cans Industry Revenue (Million) Forecast, by Application 2019 & 2032
- Table 42: South Africa US Aluminum Beverage Cans Industry Revenue (Million) Forecast, by Application 2019 & 2032
- Table 43: Rest of Middle East & Africa US Aluminum Beverage Cans Industry Revenue (Million) Forecast, by Application 2019 & 2032
- Table 44: Global US Aluminum Beverage Cans Industry Revenue Million Forecast, by Type 2019 & 2032
- Table 45: Global US Aluminum Beverage Cans Industry Revenue Million Forecast, by Application 2019 & 2032
- Table 46: Global US Aluminum Beverage Cans Industry Revenue Million Forecast, by Country 2019 & 2032
- Table 47: China US Aluminum Beverage Cans Industry Revenue (Million) Forecast, by Application 2019 & 2032
- Table 48: India US Aluminum Beverage Cans Industry Revenue (Million) Forecast, by Application 2019 & 2032
- Table 49: Japan US Aluminum Beverage Cans Industry Revenue (Million) Forecast, by Application 2019 & 2032
- Table 50: South Korea US Aluminum Beverage Cans Industry Revenue (Million) Forecast, by Application 2019 & 2032
- Table 51: ASEAN US Aluminum Beverage Cans Industry Revenue (Million) Forecast, by Application 2019 & 2032
- Table 52: Oceania US Aluminum Beverage Cans Industry Revenue (Million) Forecast, by Application 2019 & 2032
- Table 53: Rest of Asia Pacific US Aluminum Beverage Cans Industry Revenue (Million) Forecast, by Application 2019 & 2032
Frequently Asked Questions
1. What is the projected Compound Annual Growth Rate (CAGR) of the US Aluminum Beverage Cans Industry?
The projected CAGR is approximately 3.00%.
2. Which companies are prominent players in the US Aluminum Beverage Cans Industry?
Key companies in the market include Ardagh Group, Ball Corporation, Envases Group*List Not Exhaustive, Crown Holdings Inc, Silgan Holdings, Metal Container Corporation.
3. What are the main segments of the US Aluminum Beverage Cans Industry?
The market segments include Type, Application.
4. Can you provide details about the market size?
The market size is estimated to be USD XX Million as of 2022.
5. What are some drivers contributing to market growth?
Growing demand from the Non-Alcoholic Beverage sector; High Recyclability Rates of Metal Packaging.
6. What are the notable trends driving market growth?
High Recyclability Rates of Metal Packaging is Expected to Drive the Market Growth.
7. Are there any restraints impacting market growth?
Availability Of Alernative Packaging Solutions; Food Stored In Metallic Cans Cause Severe Health Issues.
8. Can you provide examples of recent developments in the market?
August 2020 - Crown Holdings Inc. announced an initiative called Twentyby30, which the company calls 'a robust program that outlines 20 measurable environmental, social and governance (ESG) goals to be completed by 2030 or sooner. The maker of steel and aluminum cans and other forms of packaging has deviced the 20 goals into five categories, one of which is called Optimum Circularity and addresses the use of recycled content and the recycling of discarded packaging.
9. What pricing options are available for accessing the report?
Pricing options include single-user, multi-user, and enterprise licenses priced at USD 3800, USD 4500, and USD 5800 respectively.
10. Is the market size provided in terms of value or volume?
The market size is provided in terms of value, measured in Million.
11. Are there any specific market keywords associated with the report?
Yes, the market keyword associated with the report is "US Aluminum Beverage Cans Industry," which aids in identifying and referencing the specific market segment covered.
12. How do I determine which pricing option suits my needs best?
The pricing options vary based on user requirements and access needs. Individual users may opt for single-user licenses, while businesses requiring broader access may choose multi-user or enterprise licenses for cost-effective access to the report.
13. Are there any additional resources or data provided in the US Aluminum Beverage Cans Industry report?
While the report offers comprehensive insights, it's advisable to review the specific contents or supplementary materials provided to ascertain if additional resources or data are available.
14. How can I stay updated on further developments or reports in the US Aluminum Beverage Cans Industry?
To stay informed about further developments, trends, and reports in the US Aluminum Beverage Cans Industry, consider subscribing to industry newsletters, following relevant companies and organizations, or regularly checking reputable industry news sources and publications.
Methodology
Step 1 - Identification of Relevant Samples Size from Population Database


Step 2 - Approaches for Defining Global Market Size (Value, Volume* & Price*)

Note*: In applicable scenarios
Step 3 - Data Sources
Primary Research
- Web Analytics
- Survey Reports
- Research Institute
- Latest Research Reports
- Opinion Leaders
Secondary Research
- Annual Reports
- White Paper
- Latest Press Release
- Industry Association
- Paid Database
- Investor Presentations

Step 4 - Data Triangulation
Involves using different sources of information in order to increase the validity of a study
These sources are likely to be stakeholders in a program - participants, other researchers, program staff, other community members, and so on.
Then we put all data in single framework & apply various statistical tools to find out the dynamic on the market.
During the analysis stage, feedback from the stakeholder groups would be compared to determine areas of agreement as well as areas of divergence


