
Key Insights
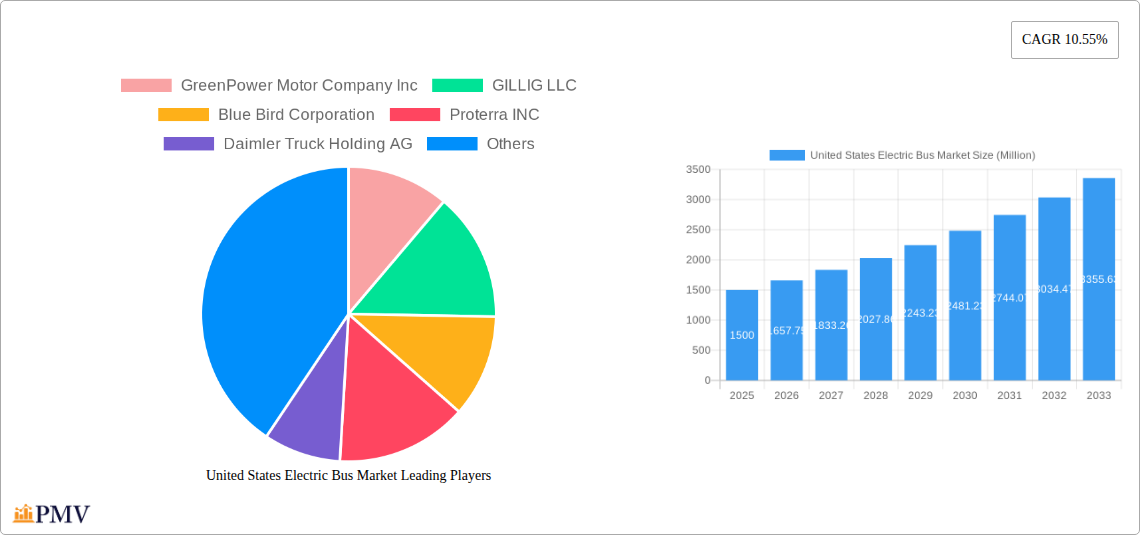
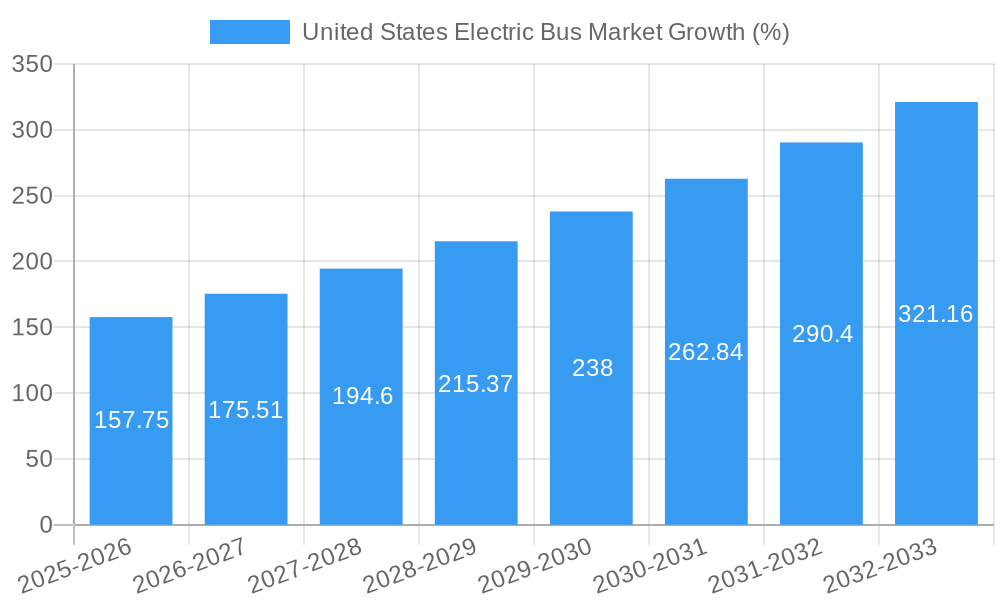
The United States electric bus market is experiencing robust growth, driven by increasing environmental concerns, stringent emission regulations, and government incentives promoting sustainable transportation. The market, valued at approximately $1.5 billion in 2025, is projected to expand significantly over the forecast period (2025-2033), exhibiting a Compound Annual Growth Rate (CAGR) of 10.55%. This growth is fueled by a rising demand for cleaner public transportation, particularly in major metropolitan areas grappling with air pollution and traffic congestion. Key market segments include Battery Electric Vehicles (BEVs), Fuel Cell Electric Vehicles (FCEVs), and Hybrid Electric Vehicles (HEVs), with BEVs currently dominating due to advancements in battery technology and decreasing costs. Leading players like GreenPower Motor Company Inc, GILLIG LLC, Blue Bird Corporation, and Proterra INC are actively investing in research and development, expanding their product portfolios, and strengthening their market positions through strategic partnerships and acquisitions. The market's growth trajectory is further supported by continuous improvements in electric bus technology, including longer ranges, faster charging times, and enhanced performance, thereby increasing their appeal to transit authorities.
However, the market faces certain challenges. High initial capital costs associated with electric bus procurement and infrastructure development remain a barrier to widespread adoption. Furthermore, the limited availability of charging infrastructure and concerns surrounding battery lifespan and replacement costs could potentially impede market expansion. Overcoming these hurdles requires collaborative efforts between government agencies, private sector companies, and research institutions to foster innovation, provide financial incentives, and develop robust charging infrastructure networks. This will accelerate the transition to a more sustainable and efficient public transportation system in the United States. Despite these challenges, the long-term outlook for the US electric bus market remains positive, driven by the increasing urgency for decarbonizing transportation and the continuous technological advancements in the sector.
United States Electric Bus Market: A Comprehensive Report (2019-2033)
This in-depth report provides a comprehensive analysis of the United States electric bus market, offering crucial insights for industry stakeholders, investors, and policymakers. Covering the period from 2019 to 2033, with a focus on 2025, this study dissects market trends, competitive dynamics, and future growth potential. The report leverages extensive data analysis to forecast market size, penetration rates, and segment-specific growth trajectories. Key players like GreenPower Motor Company Inc, GILLIG LLC, Blue Bird Corporation, Proterra INC, Daimler Truck Holding AG, NFI Group Inc, Volvo Group, BYD Auto Co Ltd, REV group Inc, and Lion Electric Company are profiled, examining their market share and strategic initiatives. The report segments the market by fuel category (BEV, FCEV, HEV), providing granular insights into each segment's performance and growth drivers.
United States Electric Bus Market Market Structure & Competitive Dynamics
The US electric bus market exhibits a moderately concentrated structure, with a few major players holding significant market share. However, the emergence of several smaller, innovative companies is fostering increased competition. The innovation ecosystem is dynamic, driven by advancements in battery technology, charging infrastructure, and vehicle design. Regulatory frameworks, particularly those focused on emission reduction targets and government incentives, significantly influence market growth. Product substitutes, mainly conventional diesel buses, are facing increasing pressure due to environmental concerns and stricter regulations. End-user trends, including a growing preference for sustainable transportation solutions among transit authorities and school districts, are bolstering market demand. M&A activity in the sector has been moderate, with deal values fluctuating based on market conditions and technological advancements. For instance, recent deals indicate an average M&A value of approximately xx Million. Key market share metrics are analyzed in detail within the report.
- Market Concentration: xx% held by top 5 players.
- Average M&A Deal Value (2019-2024): xx Million
- Number of M&A deals (2019-2024): xx
United States Electric Bus Market Industry Trends & Insights
The US electric bus market is experiencing robust growth, driven by factors such as stringent emission regulations, government incentives, and rising environmental awareness. Technological disruptions, particularly in battery technology and charging infrastructure, are enabling the wider adoption of electric buses. Consumer preferences are shifting towards eco-friendly public transportation, leading to increased demand for electric buses from both transit agencies and school districts. The market is projected to witness a CAGR of xx% during the forecast period (2025-2033), reaching a market size of xx Million by 2033. Market penetration is expected to increase significantly, driven by continued technological advancements and supportive government policies. Competitive dynamics are characterized by both intense rivalry among established players and the emergence of new entrants, fostering innovation and driving down prices.
Dominant Markets & Segments in United States Electric Bus Market
The analysis indicates that the BEV (Battery Electric Vehicle) segment dominates the US electric bus market, capturing xx% of the market share in 2025. This dominance is primarily due to the relatively lower cost and greater technological maturity of BEV technology compared to FCEV (Fuel Cell Electric Vehicle) and HEV (Hybrid Electric Vehicle).
Key Drivers for BEV Dominance:
- Lower upfront cost compared to FCEV.
- Well-established charging infrastructure.
- Extensive technological advancements in battery technology.
- Government incentives favoring BEV adoption.
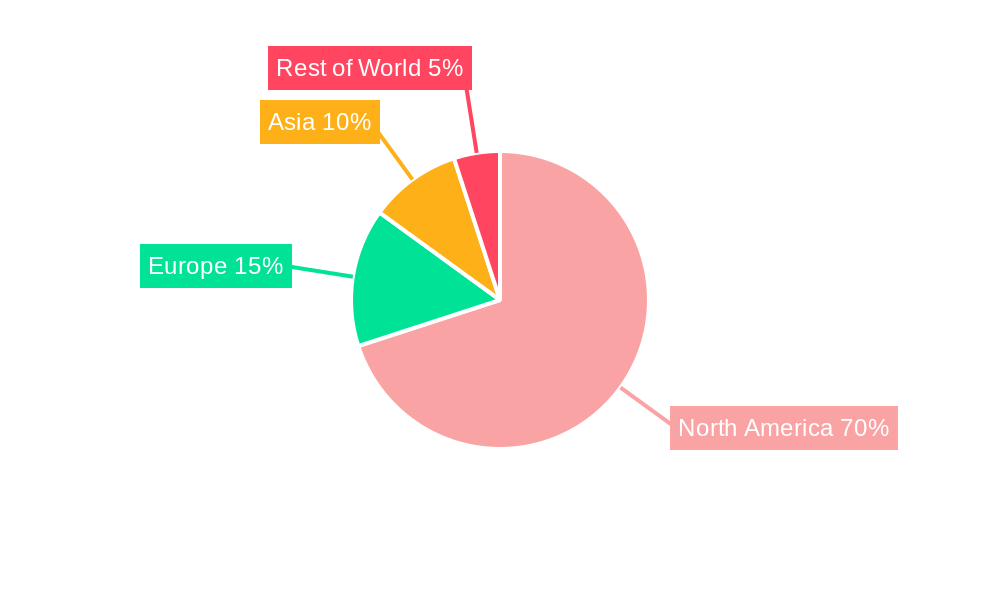
Regional Dominance: California and other states with strong emission reduction targets and supportive policies are leading the adoption of electric buses.
United States Electric Bus Market Product Innovations
Recent product innovations focus on enhancing battery life, improving charging speed, and optimizing vehicle design for better efficiency and passenger comfort. Technological trends include advancements in solid-state batteries, wireless charging, and autonomous driving capabilities. These innovations are improving the market fit of electric buses by addressing range anxiety, reducing charging times, and enhancing overall operational efficiency.
Report Segmentation & Scope
The report segments the market by fuel category:
BEV (Battery Electric Vehicles): This segment is projected to maintain its dominance, with a xx% market share in 2033. Growth is driven by declining battery costs and improvements in battery technology. Competitive dynamics are intense, with established players and new entrants vying for market share.
FCEV (Fuel Cell Electric Vehicles): This segment is expected to experience moderate growth, driven by advancements in fuel cell technology and hydrogen infrastructure development. However, high initial costs and limited refueling infrastructure remain significant challenges.
HEV (Hybrid Electric Vehicles): This segment is expected to exhibit slower growth compared to BEV and FCEV, as transit authorities and school districts increasingly prefer fully electric solutions.
Key Drivers of United States Electric Bus Market Growth
The growth of the US electric bus market is propelled by several key factors:
- Stringent emission regulations pushing for the adoption of cleaner transportation options.
- Government incentives, such as tax credits and grants, making electric buses more financially attractive.
- Advances in battery technology, leading to increased range, longer lifespan, and reduced costs.
- Growing environmental awareness among consumers and policymakers.
Challenges in the United States Electric Bus Market Sector
Despite the positive outlook, the US electric bus market faces several challenges:
- High initial investment costs associated with purchasing and deploying electric buses and charging infrastructure.
- Limited availability of skilled labor to maintain and repair electric buses.
- Concerns about range anxiety and the availability of charging stations, particularly in rural areas.
- Supply chain disruptions impacting the availability of key components.
Leading Players in the United States Electric Bus Market Market
- GreenPower Motor Company Inc
- GILLIG LLC
- Blue Bird Corporation
- Proterra INC
- Daimler Truck Holding AG
- NFI Group Inc
- Volvo Group
- BYD Auto Co Ltd
- REV group Inc
- Lion Electric Company
Key Developments in United States Electric Bus Market Sector
- December 2023: Proterra announced its new EV battery factory in South Carolina, signaling increased investment in meeting growing demand for electric vehicles.
- October 2023: BYD's partnership with Los Olivos Elementary School District resulted in the first 100% zero-emission school bus fleet in the US.
- October 2022: Solaris launched two new electric bus models, expanding the range of available options in the market.
Strategic United States Electric Bus Market Market Outlook
The US electric bus market presents significant growth opportunities in the coming years. Continued technological advancements, supportive government policies, and rising environmental awareness will fuel market expansion. Strategic investments in charging infrastructure and skilled workforce development are crucial for sustaining this growth. Furthermore, focusing on innovative business models, such as battery-as-a-service, can further accelerate the adoption of electric buses, making them more accessible and financially viable for operators. The market is ripe for players who can capitalize on these opportunities and offer competitive solutions.
United States Electric Bus Market Segmentation
-
1. Fuel Category
- 1.1. BEV
- 1.2. FCEV
- 1.3. HEV
United States Electric Bus Market Segmentation By Geography
- 1. United States
United States Electric Bus Market REPORT HIGHLIGHTS
| Aspects | Details |
|---|---|
| Study Period | 2019-2033 |
| Base Year | 2024 |
| Estimated Year | 2025 |
| Forecast Period | 2025-2033 |
| Historical Period | 2019-2024 |
| Growth Rate | CAGR of 10.55% from 2019-2033 |
| Segmentation |
|
Table of Contents
- 1. Introduction
- 1.1. Research Scope
- 1.2. Market Segmentation
- 1.3. Research Methodology
- 1.4. Definitions and Assumptions
- 2. Executive Summary
- 2.1. Introduction
- 3. Market Dynamics
- 3.1. Introduction
- 3.2. Market Drivers
- 3.2.1. Growing Travel and Tourism Industry is Driving the Car Rental Market
- 3.3. Market Restrains
- 3.3.1. Increasing Popularity of Ride-Sharing Services Pose Challenges for the Conventional Car Rental Market
- 3.4. Market Trends
- 3.4.1. OTHER KEY INDUSTRY TRENDS COVERED IN THE REPORT
- 4. Market Factor Analysis
- 4.1. Porters Five Forces
- 4.2. Supply/Value Chain
- 4.3. PESTEL analysis
- 4.4. Market Entropy
- 4.5. Patent/Trademark Analysis
- 5. United States Electric Bus Market Analysis, Insights and Forecast, 2019-2031
- 5.1. Market Analysis, Insights and Forecast - by Fuel Category
- 5.1.1. BEV
- 5.1.2. FCEV
- 5.1.3. HEV
- 5.2. Market Analysis, Insights and Forecast - by Region
- 5.2.1. United States
- 5.1. Market Analysis, Insights and Forecast - by Fuel Category
- 6. Competitive Analysis
- 6.1. Market Share Analysis 2024
- 6.2. Company Profiles
- 6.2.1 GreenPower Motor Company Inc
- 6.2.1.1. Overview
- 6.2.1.2. Products
- 6.2.1.3. SWOT Analysis
- 6.2.1.4. Recent Developments
- 6.2.1.5. Financials (Based on Availability)
- 6.2.2 GILLIG LLC
- 6.2.2.1. Overview
- 6.2.2.2. Products
- 6.2.2.3. SWOT Analysis
- 6.2.2.4. Recent Developments
- 6.2.2.5. Financials (Based on Availability)
- 6.2.3 Blue Bird Corporation
- 6.2.3.1. Overview
- 6.2.3.2. Products
- 6.2.3.3. SWOT Analysis
- 6.2.3.4. Recent Developments
- 6.2.3.5. Financials (Based on Availability)
- 6.2.4 Proterra INC
- 6.2.4.1. Overview
- 6.2.4.2. Products
- 6.2.4.3. SWOT Analysis
- 6.2.4.4. Recent Developments
- 6.2.4.5. Financials (Based on Availability)
- 6.2.5 Daimler Truck Holding AG
- 6.2.5.1. Overview
- 6.2.5.2. Products
- 6.2.5.3. SWOT Analysis
- 6.2.5.4. Recent Developments
- 6.2.5.5. Financials (Based on Availability)
- 6.2.6 NFI Group Inc
- 6.2.6.1. Overview
- 6.2.6.2. Products
- 6.2.6.3. SWOT Analysis
- 6.2.6.4. Recent Developments
- 6.2.6.5. Financials (Based on Availability)
- 6.2.7 Volvo Grou
- 6.2.7.1. Overview
- 6.2.7.2. Products
- 6.2.7.3. SWOT Analysis
- 6.2.7.4. Recent Developments
- 6.2.7.5. Financials (Based on Availability)
- 6.2.8 BYD Auto Co Ltd
- 6.2.8.1. Overview
- 6.2.8.2. Products
- 6.2.8.3. SWOT Analysis
- 6.2.8.4. Recent Developments
- 6.2.8.5. Financials (Based on Availability)
- 6.2.9 REV group Inc
- 6.2.9.1. Overview
- 6.2.9.2. Products
- 6.2.9.3. SWOT Analysis
- 6.2.9.4. Recent Developments
- 6.2.9.5. Financials (Based on Availability)
- 6.2.10 Lion Electric Company
- 6.2.10.1. Overview
- 6.2.10.2. Products
- 6.2.10.3. SWOT Analysis
- 6.2.10.4. Recent Developments
- 6.2.10.5. Financials (Based on Availability)
- 6.2.1 GreenPower Motor Company Inc
List of Figures
- Figure 1: United States Electric Bus Market Revenue Breakdown (Million, %) by Product 2024 & 2032
- Figure 2: United States Electric Bus Market Share (%) by Company 2024
List of Tables
- Table 1: United States Electric Bus Market Revenue Million Forecast, by Region 2019 & 2032
- Table 2: United States Electric Bus Market Revenue Million Forecast, by Fuel Category 2019 & 2032
- Table 3: United States Electric Bus Market Revenue Million Forecast, by Region 2019 & 2032
- Table 4: United States Electric Bus Market Revenue Million Forecast, by Fuel Category 2019 & 2032
- Table 5: United States Electric Bus Market Revenue Million Forecast, by Country 2019 & 2032
Frequently Asked Questions
1. What is the projected Compound Annual Growth Rate (CAGR) of the United States Electric Bus Market?
The projected CAGR is approximately 10.55%.
2. Which companies are prominent players in the United States Electric Bus Market?
Key companies in the market include GreenPower Motor Company Inc, GILLIG LLC, Blue Bird Corporation, Proterra INC, Daimler Truck Holding AG, NFI Group Inc, Volvo Grou, BYD Auto Co Ltd, REV group Inc, Lion Electric Company.
3. What are the main segments of the United States Electric Bus Market?
The market segments include Fuel Category.
4. Can you provide details about the market size?
The market size is estimated to be USD XX Million as of 2022.
5. What are some drivers contributing to market growth?
Growing Travel and Tourism Industry is Driving the Car Rental Market.
6. What are the notable trends driving market growth?
OTHER KEY INDUSTRY TRENDS COVERED IN THE REPORT.
7. Are there any restraints impacting market growth?
Increasing Popularity of Ride-Sharing Services Pose Challenges for the Conventional Car Rental Market.
8. Can you provide examples of recent developments in the market?
December 2023: Proterra announced its new EV battery factory in South Carolina as demand for commercial electric vehicles increased.October 2023: In October 2022, Solaris launched two new electric buses, Urbino 12 Electric and Urbino 18.75 Electric, at the 6th International Fair of Public Transport – Transexpo in Kielce, Poland.October 2023: BYD (Build Your Dreams) announced that a partnership with the Los Olivos Elementary School District would bring a BYD Type A electric school bus to Santa Barbara County students, making the Los Olivos Elementary School District the first in the United States to have 100% zero-emission fleet of school buses.
9. What pricing options are available for accessing the report?
Pricing options include single-user, multi-user, and enterprise licenses priced at USD 3800, USD 4500, and USD 5800 respectively.
10. Is the market size provided in terms of value or volume?
The market size is provided in terms of value, measured in Million.
11. Are there any specific market keywords associated with the report?
Yes, the market keyword associated with the report is "United States Electric Bus Market," which aids in identifying and referencing the specific market segment covered.
12. How do I determine which pricing option suits my needs best?
The pricing options vary based on user requirements and access needs. Individual users may opt for single-user licenses, while businesses requiring broader access may choose multi-user or enterprise licenses for cost-effective access to the report.
13. Are there any additional resources or data provided in the United States Electric Bus Market report?
While the report offers comprehensive insights, it's advisable to review the specific contents or supplementary materials provided to ascertain if additional resources or data are available.
14. How can I stay updated on further developments or reports in the United States Electric Bus Market?
To stay informed about further developments, trends, and reports in the United States Electric Bus Market, consider subscribing to industry newsletters, following relevant companies and organizations, or regularly checking reputable industry news sources and publications.
Methodology
Step 1 - Identification of Relevant Samples Size from Population Database


Step 2 - Approaches for Defining Global Market Size (Value, Volume* & Price*)

Note*: In applicable scenarios
Step 3 - Data Sources
Primary Research
- Web Analytics
- Survey Reports
- Research Institute
- Latest Research Reports
- Opinion Leaders
Secondary Research
- Annual Reports
- White Paper
- Latest Press Release
- Industry Association
- Paid Database
- Investor Presentations

Step 4 - Data Triangulation
Involves using different sources of information in order to increase the validity of a study
These sources are likely to be stakeholders in a program - participants, other researchers, program staff, other community members, and so on.
Then we put all data in single framework & apply various statistical tools to find out the dynamic on the market.
During the analysis stage, feedback from the stakeholder groups would be compared to determine areas of agreement as well as areas of divergence


