
Key Insights
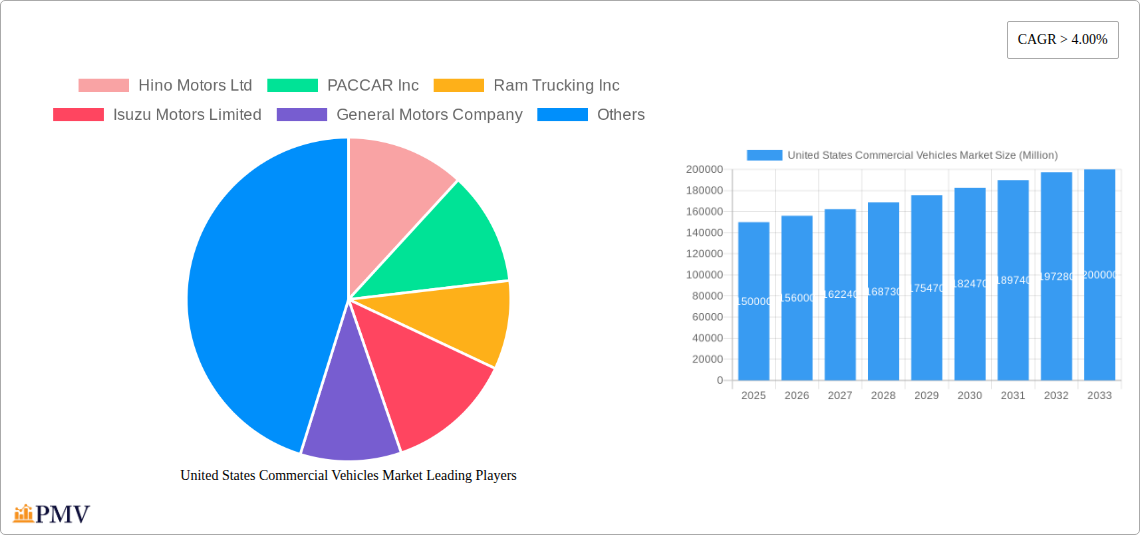
The United States commercial vehicle market is experiencing robust growth, driven by a burgeoning e-commerce sector fueling demand for last-mile delivery solutions and a strengthening construction industry necessitating increased heavy-duty vehicle deployment. The market's expansion is further propelled by advancements in vehicle technology, including the integration of hybrid and electric propulsion systems aimed at improving fuel efficiency and reducing emissions, aligning with stricter environmental regulations. While the adoption of alternative fuel vehicles like LPG remains relatively niche compared to diesel, its growth trajectory is promising, fueled by government incentives and a growing awareness of environmental sustainability. The market is segmented by vehicle type (primarily heavy-duty trucks, light-duty trucks, and buses) and propulsion type (diesel, gasoline, hybrid, electric, and LPG). Considering a global CAGR of over 4% and the significant size of the US economy, we can reasonably estimate the US commercial vehicle market size in 2025 to be approximately $150 billion, projecting to $200 billion by 2033 based on sustained growth. This growth is, however, tempered by potential economic downturns, fluctuations in fuel prices, and the high initial investment costs associated with adopting electric and hybrid technologies.
Major players such as Hino Motors, PACCAR, Ram Trucking, Isuzu Motors, General Motors, Daimler, Volvo Group, Toyota, and Ford compete fiercely, focusing on product innovation, technological advancements, and expanding their dealer networks to maintain a strong market presence. The competitive landscape is characterized by strategic alliances, mergers and acquisitions, and the ongoing development of advanced driver-assistance systems (ADAS) and autonomous driving capabilities. The regional distribution within the US market is heavily weighted towards regions with significant industrial and logistical activity, like the Midwest and West Coast. Future growth will likely be influenced by infrastructure investments, the continued development of charging infrastructure for electric vehicles, and the overall economic health of the nation. The market presents significant opportunities for manufacturers who can effectively navigate the evolving technological and regulatory landscape.
This detailed report provides an in-depth analysis of the United States commercial vehicles market, covering the period from 2019 to 2033. It offers actionable insights into market structure, competitive dynamics, industry trends, and future growth potential, focusing on key segments like Hybrid and Electric Vehicles, LPG vehicles, and various commercial vehicle types. The report is essential for industry stakeholders, investors, and anyone seeking to understand this dynamic market.
United States Commercial Vehicles Market Market Structure & Competitive Dynamics
The US commercial vehicles market exhibits a moderately concentrated structure, with a handful of dominant players commanding significant market share. Key players include PACCAR Inc, Daimler Truck Holding AG, Volvo Group, Ford Motor Company, General Motors Company, Toyota Motor Corporation, Isuzu Motors Limited, and Hino Motors Ltd. Ram Trucking Inc. also plays a significant role, though their global web presence is less prominent. The market is characterized by ongoing innovation, particularly in propulsion systems (hybrid and electric vehicles, LPG).
- Market Concentration: The top five players hold an estimated xx% of the market share in 2024, indicating a moderate level of concentration.
- Innovation Ecosystems: Significant investments in R&D are driving innovation in areas such as fuel efficiency, autonomous driving, and connected vehicle technologies.
- Regulatory Frameworks: Stringent emission regulations and safety standards are shaping the market landscape, influencing the adoption of cleaner technologies.
- Product Substitutes: The emergence of alternative transportation solutions, such as rail freight and improved intermodal transport, presents a challenge to the commercial vehicle market.
- End-User Trends: Growing e-commerce and the need for efficient last-mile delivery are driving demand for specific vehicle types, such as light commercial vehicles and delivery vans.
- M&A Activities: The past five years have witnessed xx M&A deals in the US commercial vehicle market, with a total deal value of approximately $xx Million. These activities reflect strategic moves to consolidate market share and access new technologies.
United States Commercial Vehicles Market Industry Trends & Insights
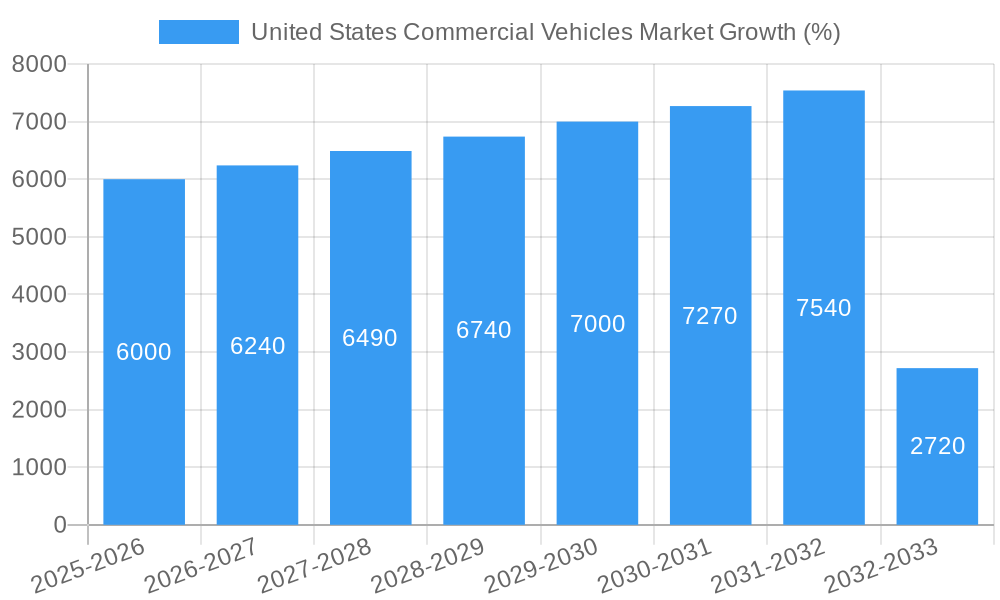
The US commercial vehicle market is poised for substantial growth, driven by several key factors. The market witnessed a CAGR of xx% during the historical period (2019-2024), and is projected to grow at a CAGR of xx% during the forecast period (2025-2033). This growth is fueled by a robust economy, expanding infrastructure projects, and increasing demand for efficient and sustainable transportation solutions. Technological advancements, such as the adoption of hybrid and electric vehicles, are further accelerating market expansion. Consumer preferences are shifting towards fuel-efficient and environmentally friendly vehicles. Competitive dynamics remain intense, with major players vying for market share through product innovation, strategic partnerships, and aggressive marketing strategies. Market penetration of electric commercial vehicles is expected to reach xx% by 2033. The shift towards autonomous driving technologies also presents both opportunities and challenges.
Dominant Markets & Segments in United States Commercial Vehicles Market
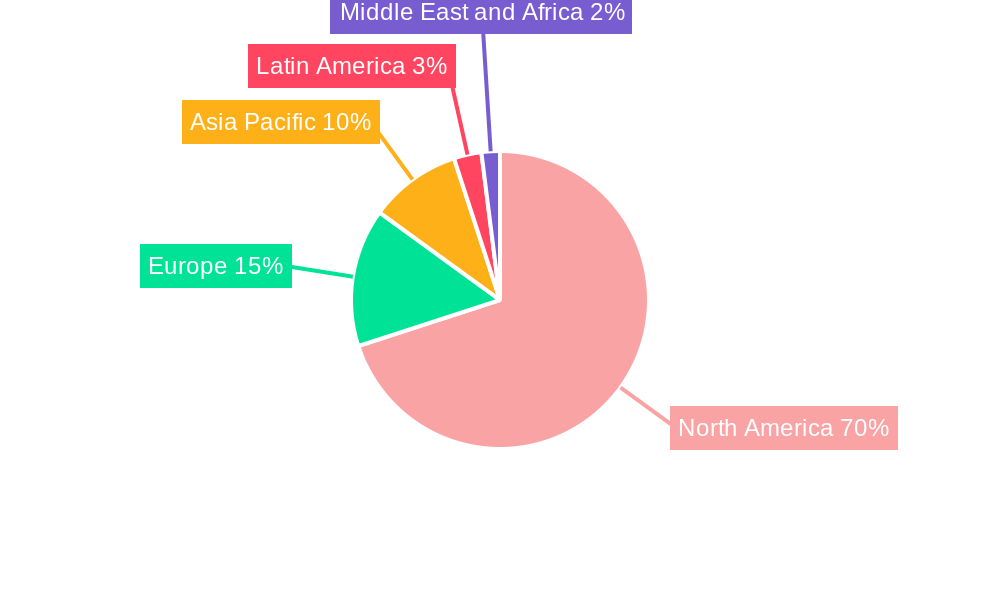
The report identifies the California region as the dominant market for commercial vehicles within the United States due to its extensive infrastructure, robust economy, and high population density. Within the vehicle types segment, Class 8 heavy-duty trucks command the largest market share, driven by long-haul transportation needs. In the propulsion type segment, conventional diesel vehicles still dominate, but the market share of hybrid and electric vehicles is steadily increasing, driven by regulatory pressure and sustainability concerns. The LPG segment exhibits modest growth, primarily driven by its cost-effectiveness in specific applications.
- Key Drivers for California Dominance:
- Extensive highway network and logistics infrastructure.
- High population density leading to increased freight movement.
- Stringent emission regulations driving adoption of cleaner vehicles.
- Strong economic activity and a large number of businesses operating in the state.
United States Commercial Vehicles Market Product Innovations
Recent product innovations focus on improving fuel efficiency, reducing emissions, and enhancing safety features. Advancements in hybrid and electric powertrains, along with the integration of advanced driver-assistance systems (ADAS) and autonomous driving capabilities, are transforming the commercial vehicle landscape. These innovations are aimed at enhancing operational efficiency, reducing the total cost of ownership (TCO), and improving driver safety. Manufacturers are also focusing on developing vehicles specifically tailored to meet the demands of e-commerce and last-mile delivery.
Report Segmentation & Scope
The report segments the market based on:
Vehicle Type: Light Commercial Vehicles (LCVs), Medium and Heavy Commercial Vehicles (M&HCVs), including various classes (e.g., Class 8 trucks). LCVs show moderate growth, while M&HCVs continue to dominate, with a projected xx% growth by 2033. Competitive dynamics are highly variable across these segments.
Propulsion Type: Diesel, Gasoline, Hybrid, Electric, LPG, CNG. The hybrid and electric vehicle segments are expected to exhibit the highest growth rate. The diesel segment will continue to be significant, while others hold a smaller but growing market share.
Application: Construction, Transportation, Logistics, etc. Growth is driven by demand from construction and logistics sectors, with construction showing a projected xx% market share by 2033.
Key Drivers of United States Commercial Vehicles Market Growth
Several key factors are driving growth in the US commercial vehicle market. These include:
- Robust Economic Growth: A strong economy fuels demand for goods and services, leading to increased freight transportation needs.
- Infrastructure Development: Investment in roads, bridges, and other infrastructure projects creates opportunities for commercial vehicle sales.
- Technological Advancements: Innovations in fuel efficiency, safety features, and autonomous driving technologies are enhancing the attractiveness of commercial vehicles.
- Government Regulations: Policies aimed at reducing emissions and improving fuel efficiency are driving the adoption of cleaner vehicle technologies.
Challenges in the United States Commercial Vehicles Market Sector
The US commercial vehicle market faces several challenges:
- Supply Chain Disruptions: Global supply chain issues can affect the availability of parts and components, impacting production and sales.
- High Fuel Prices: Fluctuations in fuel prices can significantly impact the operating costs of commercial vehicles.
- Stringent Emission Regulations: Meeting increasingly stringent emission standards requires significant investment in new technologies.
- Driver Shortages: A growing shortage of qualified commercial vehicle drivers poses a challenge to the industry.
Leading Players in the United States Commercial Vehicles Market Market
- Hino Motors Ltd
- PACCAR Inc
- Ram Trucking Inc
- Isuzu Motors Limited
- General Motors Company
- Daimler AG (Mercedes-Benz AG)
- Daimler Truck Holding AG
- Volvo Group
- Toyota Motor Corporation
- Ford Motor Company
Key Developments in United States Commercial Vehicles Market Sector
- August 2023: General Motors will launch an all-electric Cadillac Escalade in late 2024, signaling a significant push into the electric vehicle market.
- August 2023: General Motors doubles down on plans for an electric future in the Middle East, indicating a growing focus on global expansion of its electric vehicle offerings. This may indirectly impact the US market through technological advancements and supply chain optimization.
- August 2023: Toyota Kirloskar Motor launched the all-new MPV Vellfire strong hybrid electric vehicle (SHEV), indicating continued investment in hybrid technology and expansion into new vehicle segments. While this launch is in India, it reflects global trends that could impact the US market.
Strategic United States Commercial Vehicles Market Market Outlook
The US commercial vehicle market holds significant growth potential. Continued investment in infrastructure, the growing adoption of electric and hybrid vehicles, advancements in autonomous driving technology, and the increasing demand for efficient transportation solutions will drive future market expansion. Strategic opportunities exist for companies that can successfully navigate the challenges associated with supply chain disruptions, driver shortages, and emission regulations. Focus on innovation, sustainability, and strategic partnerships will be crucial for success in this dynamic market.
United States Commercial Vehicles Market Segmentation
-
1. Vehicle Type
-
1.1. Commercial Vehicles
- 1.1.1. Buses
- 1.1.2. Heavy-duty Commercial Trucks
- 1.1.3. Light Commercial Pick-up Trucks
- 1.1.4. Light Commercial Vans
- 1.1.5. Medium-duty Commercial Trucks
-
1.1. Commercial Vehicles
-
2. Propulsion Type
-
2.1. Hybrid and Electric Vehicles
-
2.1.1. By Fuel Category
- 2.1.1.1. BEV
- 2.1.1.2. FCEV
- 2.1.1.3. HEV
- 2.1.1.4. PHEV
-
2.1.1. By Fuel Category
-
2.2. ICE
- 2.2.1. CNG
- 2.2.2. Diesel
- 2.2.3. Gasoline
- 2.2.4. LPG
-
2.1. Hybrid and Electric Vehicles
United States Commercial Vehicles Market Segmentation By Geography
- 1. United States
United States Commercial Vehicles Market REPORT HIGHLIGHTS
| Aspects | Details |
|---|---|
| Study Period | 2019-2033 |
| Base Year | 2024 |
| Estimated Year | 2025 |
| Forecast Period | 2025-2033 |
| Historical Period | 2019-2024 |
| Growth Rate | CAGR of > 4.00% from 2019-2033 |
| Segmentation |
|
Table of Contents
- 1. Introduction
- 1.1. Research Scope
- 1.2. Market Segmentation
- 1.3. Research Methodology
- 1.4. Definitions and Assumptions
- 2. Executive Summary
- 2.1. Introduction
- 3. Market Dynamics
- 3.1. Introduction
- 3.2. Market Drivers
- 3.2.1. Rapid Urbanization and Demand for Convinient Transportation
- 3.3. Market Restrains
- 3.3.1. Traffic Congestion in Major Cities
- 3.4. Market Trends
- 3.4.1. OTHER KEY INDUSTRY TRENDS COVERED IN THE REPORT
- 4. Market Factor Analysis
- 4.1. Porters Five Forces
- 4.2. Supply/Value Chain
- 4.3. PESTEL analysis
- 4.4. Market Entropy
- 4.5. Patent/Trademark Analysis
- 5. United States Commercial Vehicles Market Analysis, Insights and Forecast, 2019-2031
- 5.1. Market Analysis, Insights and Forecast - by Vehicle Type
- 5.1.1. Commercial Vehicles
- 5.1.1.1. Buses
- 5.1.1.2. Heavy-duty Commercial Trucks
- 5.1.1.3. Light Commercial Pick-up Trucks
- 5.1.1.4. Light Commercial Vans
- 5.1.1.5. Medium-duty Commercial Trucks
- 5.1.1. Commercial Vehicles
- 5.2. Market Analysis, Insights and Forecast - by Propulsion Type
- 5.2.1. Hybrid and Electric Vehicles
- 5.2.1.1. By Fuel Category
- 5.2.1.1.1. BEV
- 5.2.1.1.2. FCEV
- 5.2.1.1.3. HEV
- 5.2.1.1.4. PHEV
- 5.2.1.1. By Fuel Category
- 5.2.2. ICE
- 5.2.2.1. CNG
- 5.2.2.2. Diesel
- 5.2.2.3. Gasoline
- 5.2.2.4. LPG
- 5.2.1. Hybrid and Electric Vehicles
- 5.3. Market Analysis, Insights and Forecast - by Region
- 5.3.1. United States
- 5.1. Market Analysis, Insights and Forecast - by Vehicle Type
- 6. North America United States Commercial Vehicles Market Analysis, Insights and Forecast, 2019-2031
- 6.1. Market Analysis, Insights and Forecast - By Country/Sub-region
- 6.1.1 United States
- 6.1.2 Canada
- 6.1.3 Rest of North America
- 7. Europe United States Commercial Vehicles Market Analysis, Insights and Forecast, 2019-2031
- 7.1. Market Analysis, Insights and Forecast - By Country/Sub-region
- 7.1.1 Germany
- 7.1.2 United Kingdom
- 7.1.3 France
- 7.1.4 Russia
- 7.1.5 Spain
- 7.1.6 Rest of Europe
- 8. Asia Pacific United States Commercial Vehicles Market Analysis, Insights and Forecast, 2019-2031
- 8.1. Market Analysis, Insights and Forecast - By Country/Sub-region
- 8.1.1 India
- 8.1.2 China
- 8.1.3 Japan
- 8.1.4 South Korea
- 8.1.5 Australia
- 8.1.6 Rest of Asia Pacific
- 9. Latin America United States Commercial Vehicles Market Analysis, Insights and Forecast, 2019-2031
- 9.1. Market Analysis, Insights and Forecast - By Country/Sub-region
- 9.1.1 Mexico
- 9.1.2 Brazil
- 9.1.3 Argentina
- 9.1.4 Rest Of Latin America
- 10. Middle East and Africa United States Commercial Vehicles Market Analysis, Insights and Forecast, 2019-2031
- 10.1. Market Analysis, Insights and Forecast - By Country/Sub-region
- 10.1.1 United Arab Emirates
- 10.1.2 Saudi Arabia
- 10.1.3 Rest of Middle East and Africa
- 11. Competitive Analysis
- 11.1. Market Share Analysis 2024
- 11.2. Company Profiles
- 11.2.1 Hino Motors Ltd
- 11.2.1.1. Overview
- 11.2.1.2. Products
- 11.2.1.3. SWOT Analysis
- 11.2.1.4. Recent Developments
- 11.2.1.5. Financials (Based on Availability)
- 11.2.2 PACCAR Inc
- 11.2.2.1. Overview
- 11.2.2.2. Products
- 11.2.2.3. SWOT Analysis
- 11.2.2.4. Recent Developments
- 11.2.2.5. Financials (Based on Availability)
- 11.2.3 Ram Trucking Inc
- 11.2.3.1. Overview
- 11.2.3.2. Products
- 11.2.3.3. SWOT Analysis
- 11.2.3.4. Recent Developments
- 11.2.3.5. Financials (Based on Availability)
- 11.2.4 Isuzu Motors Limited
- 11.2.4.1. Overview
- 11.2.4.2. Products
- 11.2.4.3. SWOT Analysis
- 11.2.4.4. Recent Developments
- 11.2.4.5. Financials (Based on Availability)
- 11.2.5 General Motors Company
- 11.2.5.1. Overview
- 11.2.5.2. Products
- 11.2.5.3. SWOT Analysis
- 11.2.5.4. Recent Developments
- 11.2.5.5. Financials (Based on Availability)
- 11.2.6 Daimler AG (Mercedes-Benz AG)
- 11.2.6.1. Overview
- 11.2.6.2. Products
- 11.2.6.3. SWOT Analysis
- 11.2.6.4. Recent Developments
- 11.2.6.5. Financials (Based on Availability)
- 11.2.7 Daimler Truck Holding AG
- 11.2.7.1. Overview
- 11.2.7.2. Products
- 11.2.7.3. SWOT Analysis
- 11.2.7.4. Recent Developments
- 11.2.7.5. Financials (Based on Availability)
- 11.2.8 Volvo Grou
- 11.2.8.1. Overview
- 11.2.8.2. Products
- 11.2.8.3. SWOT Analysis
- 11.2.8.4. Recent Developments
- 11.2.8.5. Financials (Based on Availability)
- 11.2.9 Toyota Motor Corporation
- 11.2.9.1. Overview
- 11.2.9.2. Products
- 11.2.9.3. SWOT Analysis
- 11.2.9.4. Recent Developments
- 11.2.9.5. Financials (Based on Availability)
- 11.2.10 Ford Motor Company
- 11.2.10.1. Overview
- 11.2.10.2. Products
- 11.2.10.3. SWOT Analysis
- 11.2.10.4. Recent Developments
- 11.2.10.5. Financials (Based on Availability)
- 11.2.1 Hino Motors Ltd
List of Figures
- Figure 1: United States Commercial Vehicles Market Revenue Breakdown (Million, %) by Product 2024 & 2032
- Figure 2: United States Commercial Vehicles Market Share (%) by Company 2024
List of Tables
- Table 1: United States Commercial Vehicles Market Revenue Million Forecast, by Region 2019 & 2032
- Table 2: United States Commercial Vehicles Market Revenue Million Forecast, by Vehicle Type 2019 & 2032
- Table 3: United States Commercial Vehicles Market Revenue Million Forecast, by Propulsion Type 2019 & 2032
- Table 4: United States Commercial Vehicles Market Revenue Million Forecast, by Region 2019 & 2032
- Table 5: United States Commercial Vehicles Market Revenue Million Forecast, by Country 2019 & 2032
- Table 6: United States United States Commercial Vehicles Market Revenue (Million) Forecast, by Application 2019 & 2032
- Table 7: Canada United States Commercial Vehicles Market Revenue (Million) Forecast, by Application 2019 & 2032
- Table 8: Rest of North America United States Commercial Vehicles Market Revenue (Million) Forecast, by Application 2019 & 2032
- Table 9: United States Commercial Vehicles Market Revenue Million Forecast, by Country 2019 & 2032
- Table 10: Germany United States Commercial Vehicles Market Revenue (Million) Forecast, by Application 2019 & 2032
- Table 11: United Kingdom United States Commercial Vehicles Market Revenue (Million) Forecast, by Application 2019 & 2032
- Table 12: France United States Commercial Vehicles Market Revenue (Million) Forecast, by Application 2019 & 2032
- Table 13: Russia United States Commercial Vehicles Market Revenue (Million) Forecast, by Application 2019 & 2032
- Table 14: Spain United States Commercial Vehicles Market Revenue (Million) Forecast, by Application 2019 & 2032
- Table 15: Rest of Europe United States Commercial Vehicles Market Revenue (Million) Forecast, by Application 2019 & 2032
- Table 16: United States Commercial Vehicles Market Revenue Million Forecast, by Country 2019 & 2032
- Table 17: India United States Commercial Vehicles Market Revenue (Million) Forecast, by Application 2019 & 2032
- Table 18: China United States Commercial Vehicles Market Revenue (Million) Forecast, by Application 2019 & 2032
- Table 19: Japan United States Commercial Vehicles Market Revenue (Million) Forecast, by Application 2019 & 2032
- Table 20: South Korea United States Commercial Vehicles Market Revenue (Million) Forecast, by Application 2019 & 2032
- Table 21: Australia United States Commercial Vehicles Market Revenue (Million) Forecast, by Application 2019 & 2032
- Table 22: Rest of Asia Pacific United States Commercial Vehicles Market Revenue (Million) Forecast, by Application 2019 & 2032
- Table 23: United States Commercial Vehicles Market Revenue Million Forecast, by Country 2019 & 2032
- Table 24: Mexico United States Commercial Vehicles Market Revenue (Million) Forecast, by Application 2019 & 2032
- Table 25: Brazil United States Commercial Vehicles Market Revenue (Million) Forecast, by Application 2019 & 2032
- Table 26: Argentina United States Commercial Vehicles Market Revenue (Million) Forecast, by Application 2019 & 2032
- Table 27: Rest Of Latin America United States Commercial Vehicles Market Revenue (Million) Forecast, by Application 2019 & 2032
- Table 28: United States Commercial Vehicles Market Revenue Million Forecast, by Country 2019 & 2032
- Table 29: United Arab Emirates United States Commercial Vehicles Market Revenue (Million) Forecast, by Application 2019 & 2032
- Table 30: Saudi Arabia United States Commercial Vehicles Market Revenue (Million) Forecast, by Application 2019 & 2032
- Table 31: Rest of Middle East and Africa United States Commercial Vehicles Market Revenue (Million) Forecast, by Application 2019 & 2032
- Table 32: United States Commercial Vehicles Market Revenue Million Forecast, by Vehicle Type 2019 & 2032
- Table 33: United States Commercial Vehicles Market Revenue Million Forecast, by Propulsion Type 2019 & 2032
- Table 34: United States Commercial Vehicles Market Revenue Million Forecast, by Country 2019 & 2032
Frequently Asked Questions
1. What is the projected Compound Annual Growth Rate (CAGR) of the United States Commercial Vehicles Market?
The projected CAGR is approximately > 4.00%.
2. Which companies are prominent players in the United States Commercial Vehicles Market?
Key companies in the market include Hino Motors Ltd, PACCAR Inc, Ram Trucking Inc, Isuzu Motors Limited, General Motors Company, Daimler AG (Mercedes-Benz AG), Daimler Truck Holding AG, Volvo Grou, Toyota Motor Corporation, Ford Motor Company.
3. What are the main segments of the United States Commercial Vehicles Market?
The market segments include Vehicle Type, Propulsion Type.
4. Can you provide details about the market size?
The market size is estimated to be USD XX Million as of 2022.
5. What are some drivers contributing to market growth?
Rapid Urbanization and Demand for Convinient Transportation.
6. What are the notable trends driving market growth?
OTHER KEY INDUSTRY TRENDS COVERED IN THE REPORT.
7. Are there any restraints impacting market growth?
Traffic Congestion in Major Cities.
8. Can you provide examples of recent developments in the market?
August 2023: General Motors will launch an all-electric Cadillac Escalade in late 2024August 2023: General Motors doubles down on plans for an electric future in the Middle East.August 2023: Toyota Kirloskar Motor launched the all-new MPV Vellfire strong hybrid electric vehicle (SHEV) for a starting price of INR 11.99 million and going to INR 12.99 million.
9. What pricing options are available for accessing the report?
Pricing options include single-user, multi-user, and enterprise licenses priced at USD 3800, USD 4500, and USD 5800 respectively.
10. Is the market size provided in terms of value or volume?
The market size is provided in terms of value, measured in Million.
11. Are there any specific market keywords associated with the report?
Yes, the market keyword associated with the report is "United States Commercial Vehicles Market," which aids in identifying and referencing the specific market segment covered.
12. How do I determine which pricing option suits my needs best?
The pricing options vary based on user requirements and access needs. Individual users may opt for single-user licenses, while businesses requiring broader access may choose multi-user or enterprise licenses for cost-effective access to the report.
13. Are there any additional resources or data provided in the United States Commercial Vehicles Market report?
While the report offers comprehensive insights, it's advisable to review the specific contents or supplementary materials provided to ascertain if additional resources or data are available.
14. How can I stay updated on further developments or reports in the United States Commercial Vehicles Market?
To stay informed about further developments, trends, and reports in the United States Commercial Vehicles Market, consider subscribing to industry newsletters, following relevant companies and organizations, or regularly checking reputable industry news sources and publications.
Methodology
Step 1 - Identification of Relevant Samples Size from Population Database


Step 2 - Approaches for Defining Global Market Size (Value, Volume* & Price*)

Note*: In applicable scenarios
Step 3 - Data Sources
Primary Research
- Web Analytics
- Survey Reports
- Research Institute
- Latest Research Reports
- Opinion Leaders
Secondary Research
- Annual Reports
- White Paper
- Latest Press Release
- Industry Association
- Paid Database
- Investor Presentations

Step 4 - Data Triangulation
Involves using different sources of information in order to increase the validity of a study
These sources are likely to be stakeholders in a program - participants, other researchers, program staff, other community members, and so on.
Then we put all data in single framework & apply various statistical tools to find out the dynamic on the market.
During the analysis stage, feedback from the stakeholder groups would be compared to determine areas of agreement as well as areas of divergence


